
|
|||||
|
 | |
| |
| |
| |
| |
| |
|
Gene: SERPINB4 |
Gene summary for SERPINB4 |
| Gene information | Species | Human | Gene symbol | SERPINB4 | Gene ID | 6318 |
| Gene name | serpin family B member 4 | |
| Gene Alias | LEUPIN | |
| Cytomap | 18q21.33 | |
| Gene Type | protein-coding | GO ID | GO:0001906 | UniProtAcc | P48594 |
Top |
Malignant transformation analysis |
| Identification of the aberrant gene expression in precancerous and cancerous lesions by comparing the gene expression of stem-like cells in diseased tissues with normal stem cells |
| Entrez ID | Symbol | Replicates | Species | Organ | Tissue | Adj P-value | Log2FC | Malignancy |
| 6318 | SERPINB4 | CA_HPV_1 | Human | Cervix | CC | 7.16e-07 | -3.98e-01 | 0.0264 |
| 6318 | SERPINB4 | CA_HPV_3 | Human | Cervix | CC | 1.43e-05 | -3.03e-01 | 0.0414 |
| 6318 | SERPINB4 | HSIL_HPV_1 | Human | Cervix | HSIL_HPV | 2.06e-15 | -5.11e-01 | 0.0116 |
| 6318 | SERPINB4 | HSIL_HPV_2 | Human | Cervix | HSIL_HPV | 4.92e-16 | -4.95e-01 | 0.0208 |
| 6318 | SERPINB4 | N_HPV_1 | Human | Cervix | N_HPV | 7.74e-11 | -4.45e-01 | 0.0079 |
| 6318 | SERPINB4 | Tumor | Human | Cervix | CC | 3.92e-46 | 1.09e+00 | 0.1241 |
| 6318 | SERPINB4 | sample3 | Human | Cervix | CC | 1.46e-38 | 9.29e-01 | 0.1387 |
| 6318 | SERPINB4 | H2 | Human | Cervix | HSIL_HPV | 5.70e-03 | -2.59e-01 | 0.0632 |
| 6318 | SERPINB4 | L1 | Human | Cervix | CC | 1.51e-49 | 1.36e+00 | 0.0802 |
| 6318 | SERPINB4 | T3 | Human | Cervix | CC | 1.10e-39 | 9.42e-01 | 0.1389 |
| 6318 | SERPINB4 | P5T-E | Human | Esophagus | ESCC | 5.30e-21 | 7.57e-01 | 0.1327 |
| 6318 | SERPINB4 | P23T-E | Human | Esophagus | ESCC | 2.37e-13 | 1.62e+00 | 0.108 |
| 6318 | SERPINB4 | P36T-E | Human | Esophagus | ESCC | 6.23e-11 | 6.75e-01 | 0.1187 |
| 6318 | SERPINB4 | P37T-E | Human | Esophagus | ESCC | 6.05e-08 | 4.82e-01 | 0.1371 |
| 6318 | SERPINB4 | P62T-E | Human | Esophagus | ESCC | 1.17e-28 | 2.05e+00 | 0.1302 |
| 6318 | SERPINB4 | P74T-E | Human | Esophagus | ESCC | 4.76e-19 | 2.85e+00 | 0.1479 |
| 6318 | SERPINB4 | P75T-E | Human | Esophagus | ESCC | 2.20e-17 | 8.28e-01 | 0.1125 |
| 6318 | SERPINB4 | P76T-E | Human | Esophagus | ESCC | 3.75e-03 | 6.55e-01 | 0.1207 |
| 6318 | SERPINB4 | P82T-E | Human | Esophagus | ESCC | 4.14e-03 | 1.39e+00 | 0.1072 |
| 6318 | SERPINB4 | P107T-E | Human | Esophagus | ESCC | 1.03e-13 | 9.21e-01 | 0.171 |
| Page: 1 2 |
| Tissue | Expression Dynamics | Abbreviation |
| Cervix | 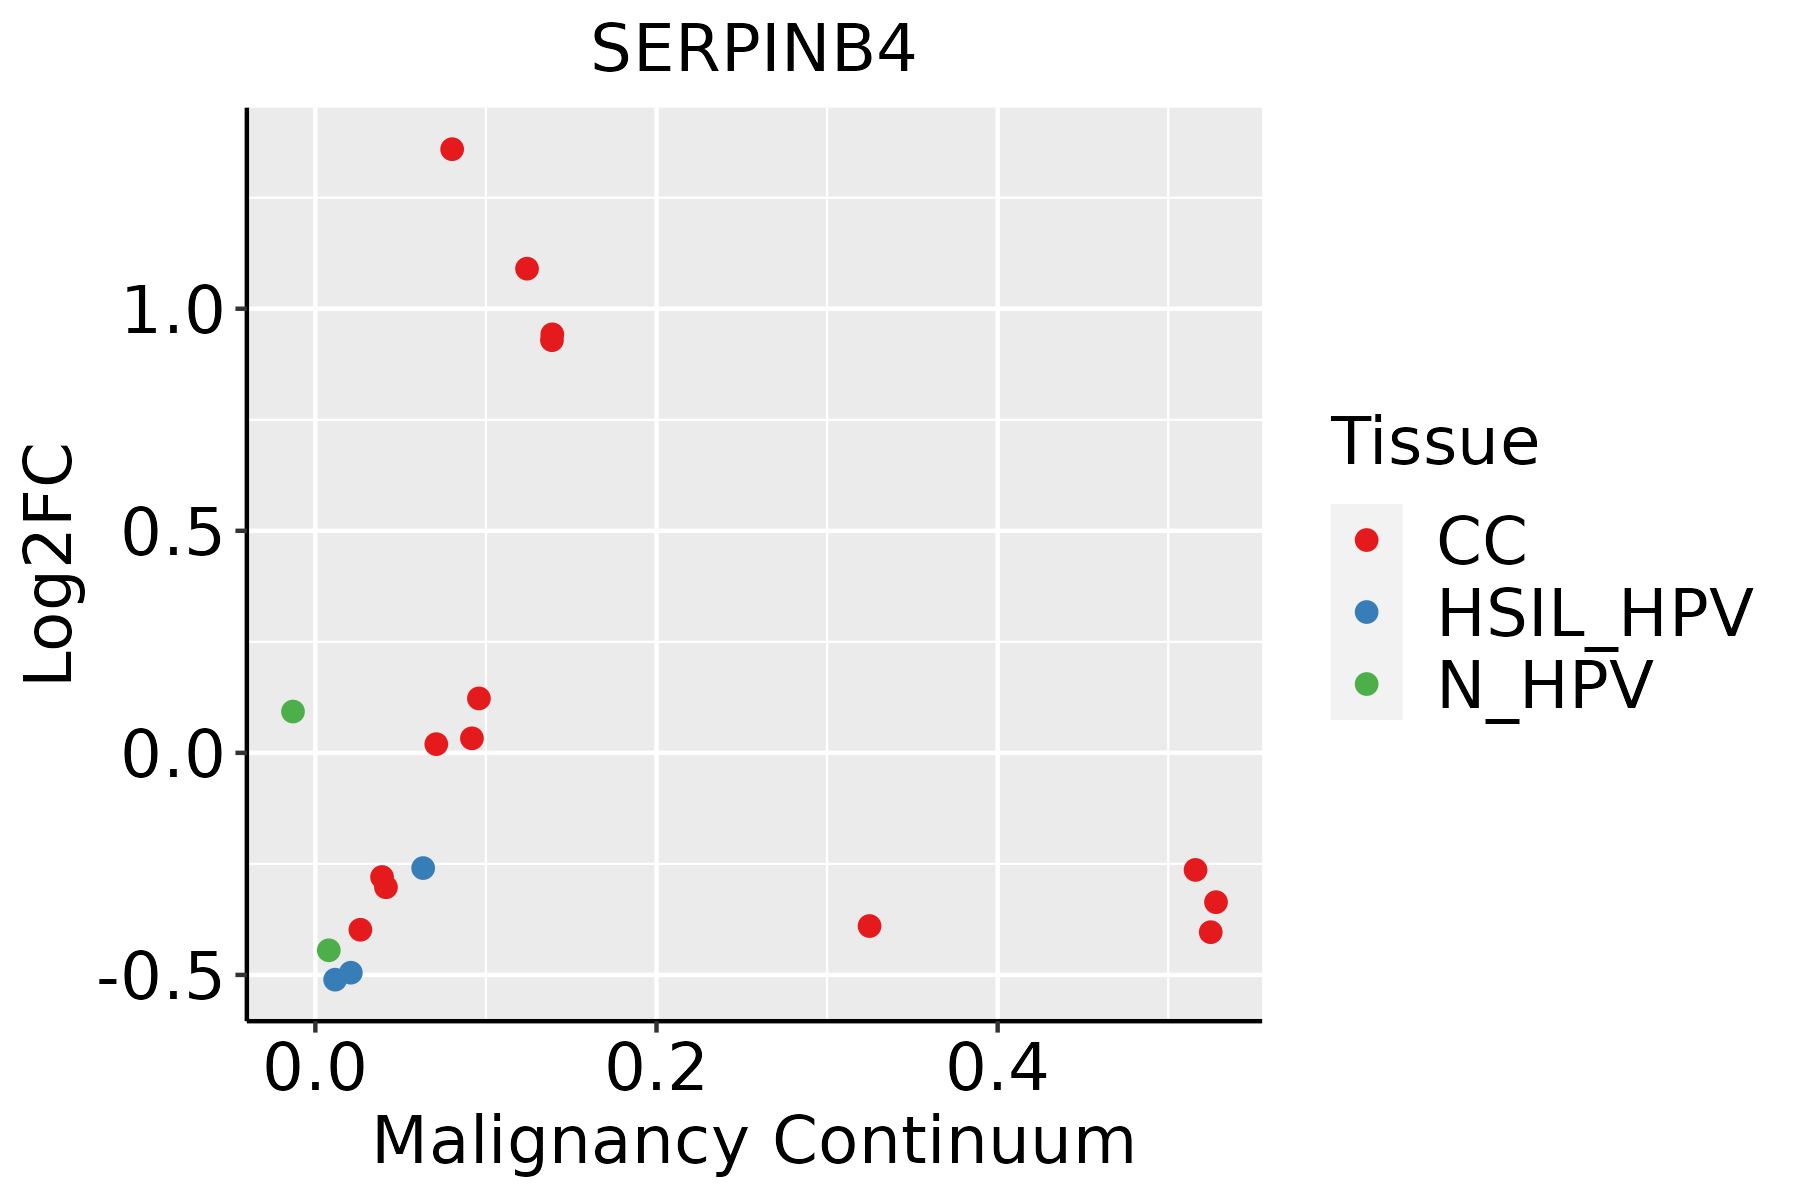 | CC: Cervix cancer |
| HSIL_HPV: HPV-infected high-grade squamous intraepithelial lesions | ||
| N_HPV: HPV-infected normal cervix | ||
| Esophagus |  | ESCC: Esophageal squamous cell carcinoma |
| HGIN: High-grade intraepithelial neoplasias | ||
| LGIN: Low-grade intraepithelial neoplasias | ||
| Oral Cavity | 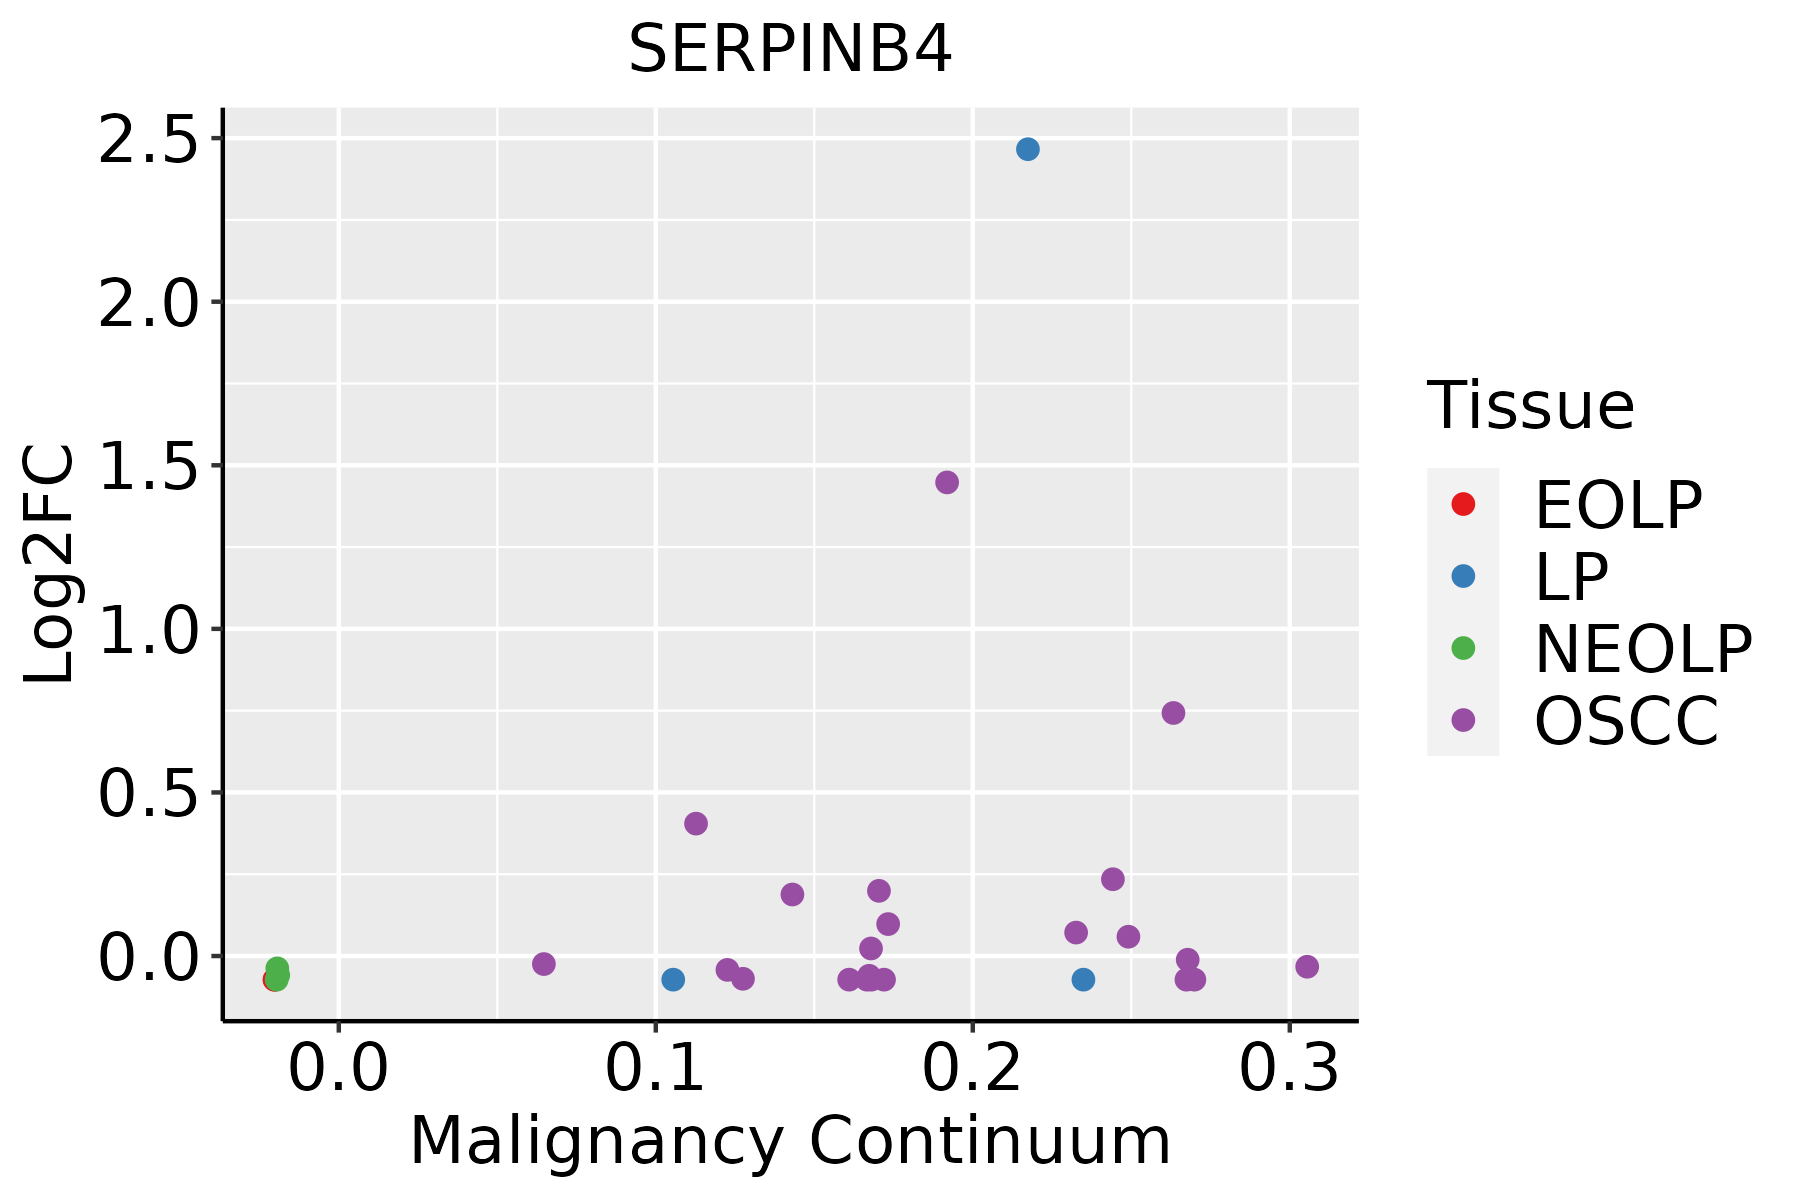 | EOLP: Erosive Oral lichen planus |
| LP: leukoplakia | ||
| NEOLP: Non-erosive oral lichen planus | ||
| OSCC: Oral squamous cell carcinoma | ||
| Skin | 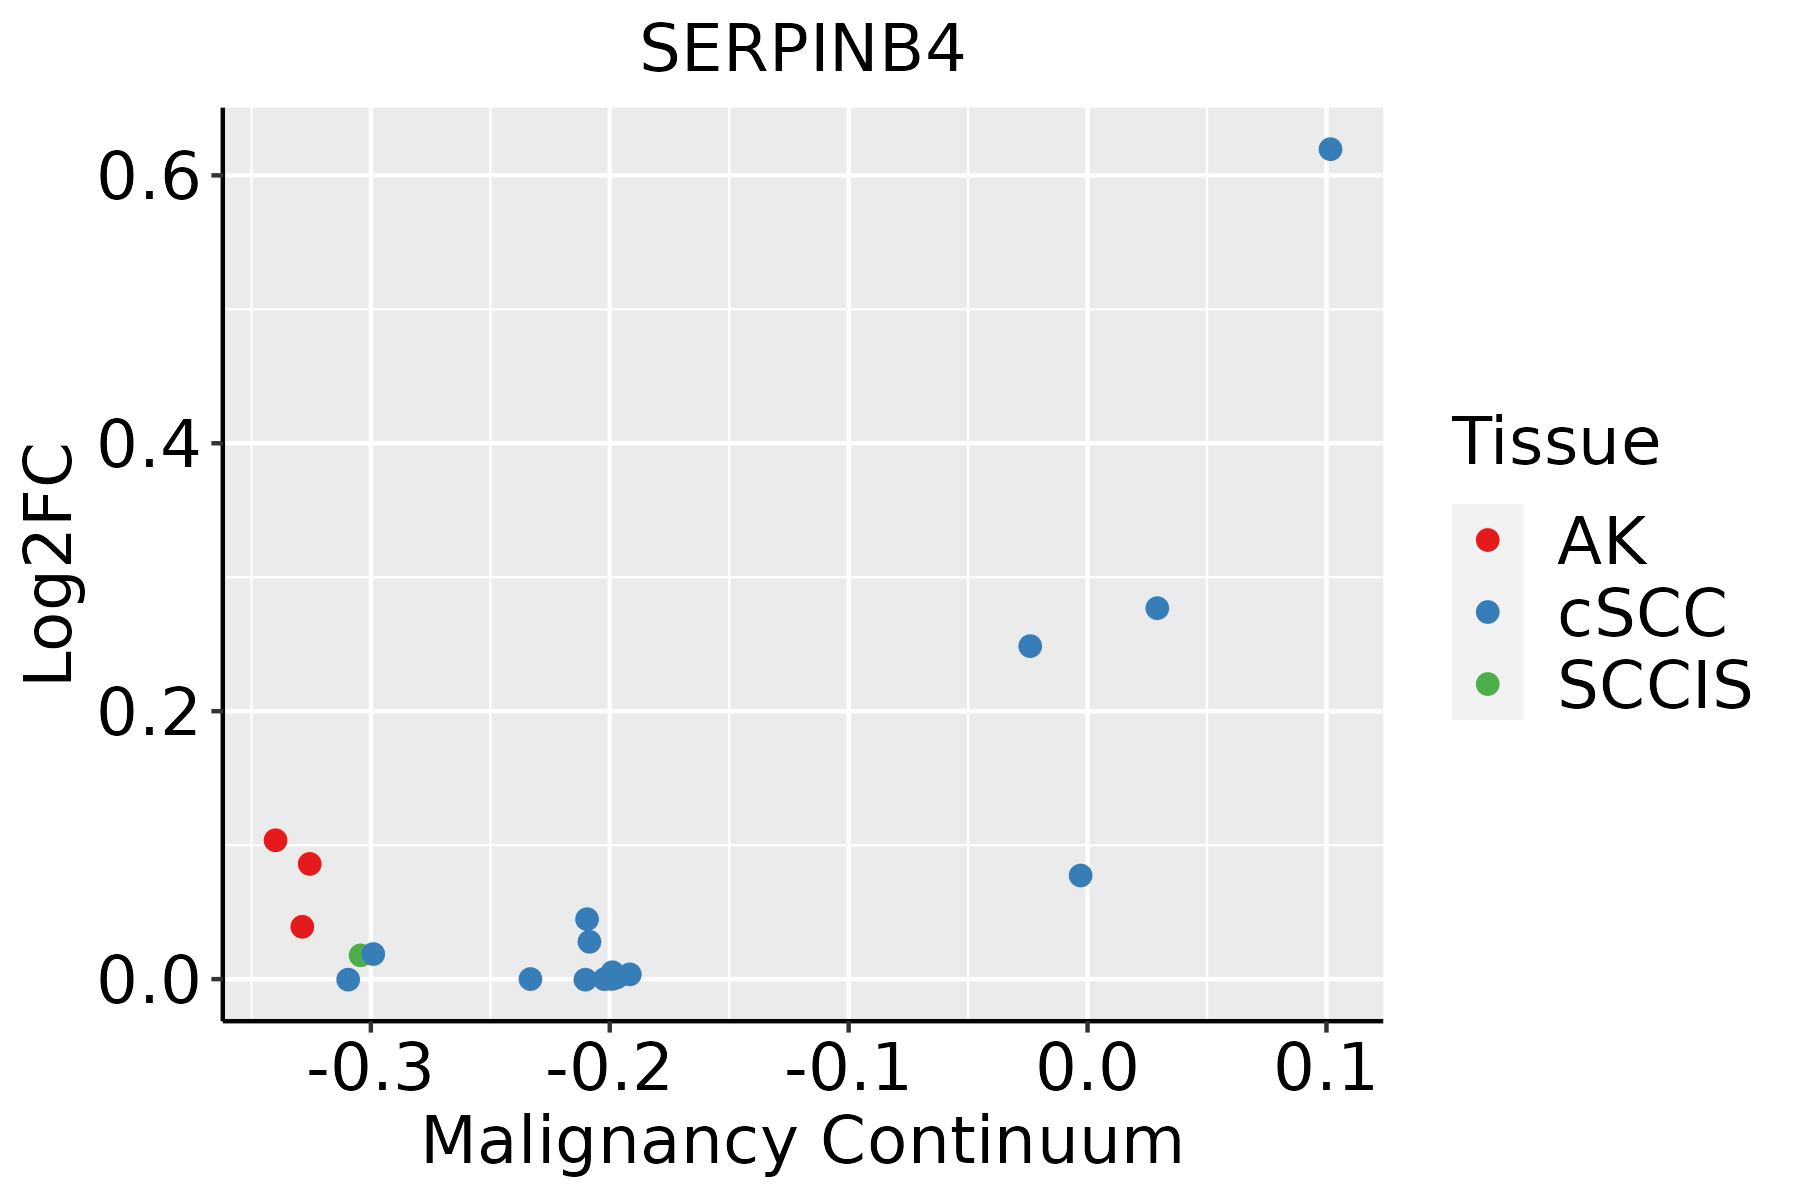 | AK: Actinic keratosis |
| cSCC: Cutaneous squamous cell carcinoma | ||
| SCCIS:squamous cell carcinoma in situ | ||
| Thyroid | 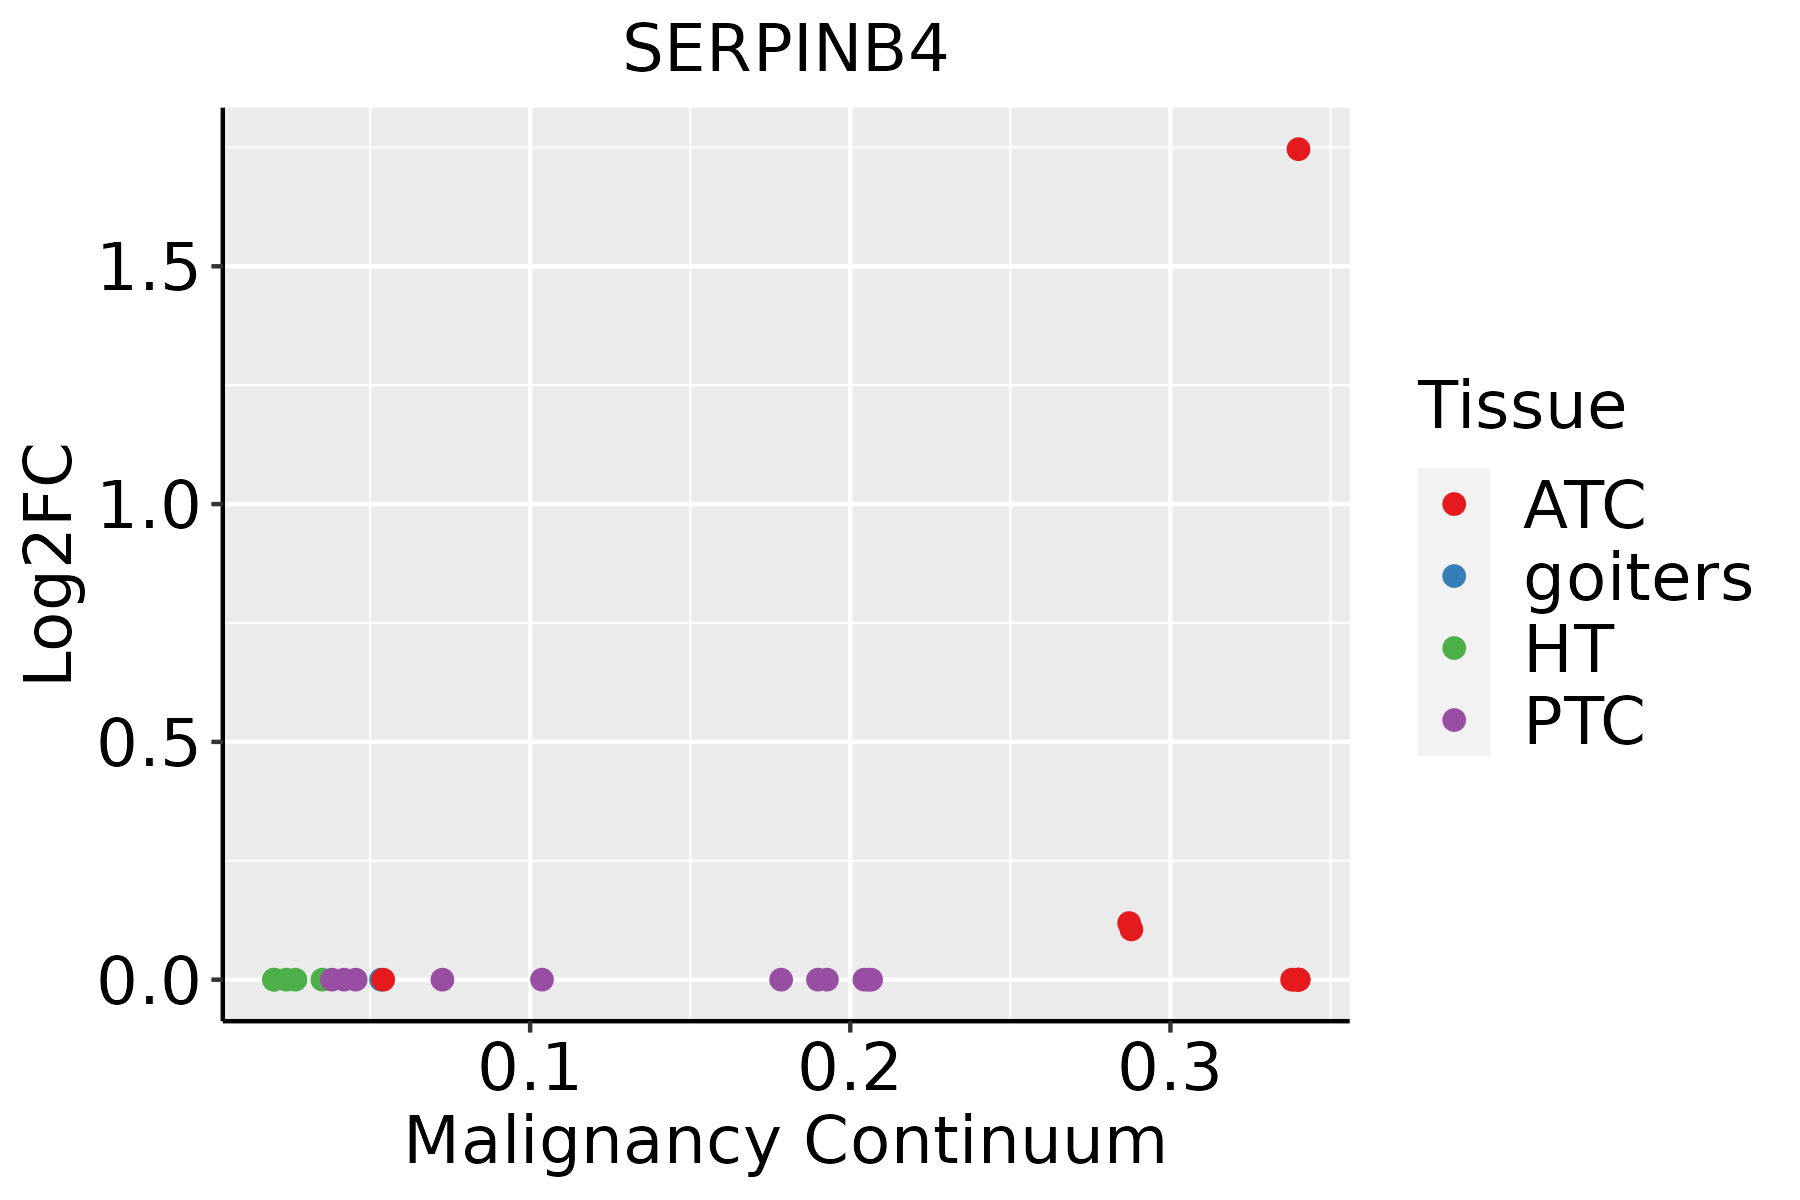 | ATC: Anaplastic thyroid cancer |
| HT: Hashimoto's thyroiditis | ||
| PTC: Papillary thyroid cancer |
| ∗log2FC in expression of this searched gene in stem-like cells from each diseased tissue sample relative to stem-like cells in normal samples in each tissue plotted against the malignancy continuum. Samples are colored based on if they are from different disease stage. |
Top |
Malignant transformation related pathway analysis |
| Find out the enriched GO biological processes and KEGG pathways involved in transition from healthy to precancer to cancer |
| Tissue | Disease Stage | Enriched GO biological Processes |
| Colorectum | AD |  |
| Colorectum | SER |  |
| Colorectum | MSS |  |
| Colorectum | MSI-H |  |
| Colorectum | FAP |  |
| ∗Top 15 enriched GO BP terms are showed in the bar plot of each disease state in each tissue. Each row represents a significant GO biological process which is colored according to the -log10(p.adjust). |
| Page: 1 2 3 4 5 6 7 8 9 |
| GO ID | Tissue | Disease Stage | Description | Gene Ratio | Bg Ratio | pvalue | p.adjust | Count |
| GO:005254710 | Cervix | CC | regulation of peptidase activity | 112/2311 | 461/18723 | 6.70e-13 | 3.08e-10 | 112 |
| GO:005254810 | Cervix | CC | regulation of endopeptidase activity | 103/2311 | 432/18723 | 1.89e-11 | 5.14e-09 | 103 |
| GO:00026837 | Cervix | CC | negative regulation of immune system process | 94/2311 | 434/18723 | 2.63e-08 | 1.87e-06 | 94 |
| GO:004586110 | Cervix | CC | negative regulation of proteolysis | 80/2311 | 351/18723 | 2.88e-08 | 1.98e-06 | 80 |
| GO:00513469 | Cervix | CC | negative regulation of hydrolase activity | 81/2311 | 379/18723 | 4.27e-07 | 1.67e-05 | 81 |
| GO:00104669 | Cervix | CC | negative regulation of peptidase activity | 60/2311 | 262/18723 | 1.27e-06 | 4.34e-05 | 60 |
| GO:001095110 | Cervix | CC | negative regulation of endopeptidase activity | 56/2311 | 252/18723 | 7.43e-06 | 1.74e-04 | 56 |
| GO:00028315 | Cervix | CC | regulation of response to biotic stimulus | 67/2311 | 327/18723 | 1.79e-05 | 3.36e-04 | 67 |
| GO:00028322 | Cervix | CC | negative regulation of response to biotic stimulus | 27/2311 | 108/18723 | 2.27e-04 | 2.55e-03 | 27 |
| GO:00507773 | Cervix | CC | negative regulation of immune response | 41/2311 | 194/18723 | 3.63e-04 | 3.76e-03 | 41 |
| GO:00321022 | Cervix | CC | negative regulation of response to external stimulus | 75/2311 | 420/18723 | 5.96e-04 | 5.61e-03 | 75 |
| GO:00450882 | Cervix | CC | regulation of innate immune response | 44/2311 | 218/18723 | 6.40e-04 | 5.97e-03 | 44 |
| GO:00026983 | Cervix | CC | negative regulation of immune effector process | 26/2311 | 110/18723 | 7.40e-04 | 6.63e-03 | 26 |
| GO:00026973 | Cervix | CC | regulation of immune effector process | 62/2311 | 339/18723 | 9.25e-04 | 7.84e-03 | 62 |
| GO:00313423 | Cervix | CC | negative regulation of cell killing | 10/2311 | 28/18723 | 1.28e-03 | 1.02e-02 | 10 |
| GO:00458243 | Cervix | CC | negative regulation of innate immune response | 18/2311 | 71/18723 | 2.01e-03 | 1.47e-02 | 18 |
| GO:0031348 | Cervix | CC | negative regulation of defense response | 48/2311 | 258/18723 | 2.30e-03 | 1.65e-02 | 48 |
| GO:00019067 | Cervix | CC | cell killing | 37/2311 | 188/18723 | 2.61e-03 | 1.80e-02 | 37 |
| GO:0045953 | Cervix | CC | negative regulation of natural killer cell mediated cytotoxicity | 7/2311 | 18/18723 | 3.99e-03 | 2.48e-02 | 7 |
| GO:0002443 | Cervix | CC | leukocyte mediated immunity | 73/2311 | 440/18723 | 5.01e-03 | 2.98e-02 | 73 |
| Page: 1 2 3 4 5 6 |
| Pathway ID | Tissue | Disease Stage | Description | Gene Ratio | Bg Ratio | pvalue | p.adjust | qvalue | Count |
| hsa051465 | Cervix | CC | Amoebiasis | 29/1267 | 102/8465 | 3.31e-04 | 1.70e-03 | 1.01e-03 | 29 |
| hsa0514612 | Cervix | CC | Amoebiasis | 29/1267 | 102/8465 | 3.31e-04 | 1.70e-03 | 1.01e-03 | 29 |
| hsa051468 | Oral cavity | OSCC | Amoebiasis | 59/3704 | 102/8465 | 2.78e-03 | 7.17e-03 | 3.65e-03 | 59 |
| hsa0514615 | Oral cavity | OSCC | Amoebiasis | 59/3704 | 102/8465 | 2.78e-03 | 7.17e-03 | 3.65e-03 | 59 |
| Page: 1 |
Top |
Cell-cell communication analysis |
| Identification of potential cell-cell interactions between two cell types and their ligand-receptor pairs for different disease states |
| Ligand | Receptor | LRpair | Pathway | Tissue | Disease Stage |
| Page: 1 |
Top |
Single-cell gene regulatory network inference analysis |
| Find out the significant the regulons (TFs) and the target genes of each regulon across cell types for different disease states |
| TF | Cell Type | Tissue | Disease Stage | Target Gene | RSS | Regulon Activity |
| ∗The dot plots of a searched regulon are shown for all cell subpopulations in each disease state of each tissue based on the regulon specific score inferred using pySCENIC and by calculating the average expression. |
| Page: 1 |
Top |
Somatic mutation of malignant transformation related genes |
| Annotation of somatic variants for genes involved in malignant transformation |
| Hugo Symbol | Variant Class | Variant Classification | dbSNP RS | HGVSc | HGVSp | HGVSp Short | SWISSPROT | BIOTYPE | SIFT | PolyPhen | Tumor Sample Barcode | Tissue | Histology | Sex | Age | Stage | Therapy Types | Drugs | Outcome |
| SERPINB4 | SNV | Missense_Mutation | novel | c.731N>A | p.Ile244Asn | p.I244N | P48594 | protein_coding | deleterious(0) | probably_damaging(0.962) | TCGA-A2-A3XS-01 | Breast | breast invasive carcinoma | Female | <65 | III/IV | Chemotherapy | cytoxan | PD |
| SERPINB4 | SNV | Missense_Mutation | novel | c.1108N>A | p.Leu370Ile | p.L370I | P48594 | protein_coding | tolerated(0.06) | probably_damaging(0.941) | TCGA-AN-A046-01 | Breast | breast invasive carcinoma | Female | >=65 | I/II | Unknown | Unknown | SD |
| SERPINB4 | SNV | Missense_Mutation | c.951G>A | p.Met317Ile | p.M317I | P48594 | protein_coding | tolerated(0.2) | benign(0.145) | TCGA-D8-A1J8-01 | Breast | breast invasive carcinoma | Female | >=65 | I/II | Hormone Therapy | nolvadex | SD | |
| SERPINB4 | SNV | Missense_Mutation | rs144158243 | c.857N>A | p.Arg286Gln | p.R286Q | P48594 | protein_coding | tolerated(0.13) | benign(0.228) | TCGA-2W-A8YY-01 | Cervix | cervical & endocervical cancer | Female | <65 | I/II | Chemotherapy | cisplatin | CR |
| SERPINB4 | SNV | Missense_Mutation | rs781536461 | c.335N>T | p.Thr112Met | p.T112M | P48594 | protein_coding | deleterious(0.02) | benign(0.106) | TCGA-2W-A8YY-01 | Cervix | cervical & endocervical cancer | Female | <65 | I/II | Chemotherapy | cisplatin | CR |
| SERPINB4 | SNV | Missense_Mutation | novel | c.107N>T | p.Ser36Leu | p.S36L | P48594 | protein_coding | deleterious(0.02) | possibly_damaging(0.717) | TCGA-DG-A2KK-01 | Cervix | cervical & endocervical cancer | Female | <65 | III/IV | Chemotherapy | cisplatin | SD |
| SERPINB4 | SNV | Missense_Mutation | c.374N>C | p.Lys125Thr | p.K125T | P48594 | protein_coding | tolerated(0.06) | possibly_damaging(0.777) | TCGA-AA-3977-01 | Colorectum | colon adenocarcinoma | Male | >=65 | I/II | Unknown | Unknown | SD | |
| SERPINB4 | SNV | Missense_Mutation | c.84N>A | p.Phe28Leu | p.F28L | P48594 | protein_coding | tolerated(0.13) | probably_damaging(0.979) | TCGA-AA-A010-01 | Colorectum | colon adenocarcinoma | Female | <65 | I/II | Chemotherapy | folinic | CR | |
| SERPINB4 | SNV | Missense_Mutation | novel | c.544N>G | p.Phe182Val | p.F182V | P48594 | protein_coding | deleterious(0) | probably_damaging(1) | TCGA-CA-6717-01 | Colorectum | colon adenocarcinoma | Male | <65 | I/II | Chemotherapy | oxaliplatin | CR |
| SERPINB4 | SNV | Missense_Mutation | c.535N>A | p.Ala179Thr | p.A179T | P48594 | protein_coding | tolerated(0.21) | probably_damaging(0.993) | TCGA-D5-6534-01 | Colorectum | colon adenocarcinoma | Female | <65 | I/II | Unknown | Unknown | SD |
| Page: 1 2 3 4 5 6 7 8 |
Top |
Related drugs of malignant transformation related genes |
| Identification of chemicals and drugs interact with genes involved in malignant transfromation |
| (DGIdb 4.0) |
| Entrez ID | Symbol | Category | Interaction Types | Drug Claim Name | Drug Name | PMIDs |
| Page: 1 |

Copyright 2023-Present -The University of Texas Health Science Center at Houston |