
|
|||||
|
 | |
| |
| |
| |
| |
| |
|
Gene: SERPINB2 |
Gene summary for SERPINB2 |
| Gene information | Species | Human | Gene symbol | SERPINB2 | Gene ID | 5055 |
| Gene name | serpin family B member 2 | |
| Gene Alias | HsT1201 | |
| Cytomap | 18q21.33-q22.1 | |
| Gene Type | protein-coding | GO ID | GO:0006508 | UniProtAcc | P05120 |
Top |
Malignant transformation analysis |
| Identification of the aberrant gene expression in precancerous and cancerous lesions by comparing the gene expression of stem-like cells in diseased tissues with normal stem cells |
| Entrez ID | Symbol | Replicates | Species | Organ | Tissue | Adj P-value | Log2FC | Malignancy |
| 5055 | SERPINB2 | LZE24T | Human | Esophagus | ESCC | 5.66e-12 | 1.40e+00 | 0.0596 |
| 5055 | SERPINB2 | P8T-E | Human | Esophagus | ESCC | 7.60e-13 | 1.23e+00 | 0.0889 |
| 5055 | SERPINB2 | P31T-E | Human | Esophagus | ESCC | 7.26e-28 | 1.58e+00 | 0.1251 |
| 5055 | SERPINB2 | P39T-E | Human | Esophagus | ESCC | 1.50e-22 | 1.41e+00 | 0.0894 |
| 5055 | SERPINB2 | P74T-E | Human | Esophagus | ESCC | 3.36e-03 | 7.32e-01 | 0.1479 |
| 5055 | SERPINB2 | P82T-E | Human | Esophagus | ESCC | 1.02e-02 | 6.97e-01 | 0.1072 |
| 5055 | SERPINB2 | P126T-E | Human | Esophagus | ESCC | 2.70e-03 | 2.78e+00 | 0.1125 |
| 5055 | SERPINB2 | P127T-E | Human | Esophagus | ESCC | 1.83e-16 | 7.88e-01 | 0.0826 |
| 5055 | SERPINB2 | P130T-E | Human | Esophagus | ESCC | 7.95e-08 | 1.50e+00 | 0.1676 |
| 5055 | SERPINB2 | C04 | Human | Oral cavity | OSCC | 1.27e-08 | 1.15e+00 | 0.2633 |
| 5055 | SERPINB2 | C21 | Human | Oral cavity | OSCC | 9.44e-34 | 2.03e+00 | 0.2678 |
| 5055 | SERPINB2 | C57 | Human | Oral cavity | OSCC | 3.56e-14 | 1.19e+00 | 0.1679 |
| 5055 | SERPINB2 | C86 | Human | Oral cavity | OSCC | 4.35e-05 | 2.16e+00 | 0.161 |
| 5055 | SERPINB2 | SYSMH3 | Human | Oral cavity | OSCC | 1.19e-11 | 7.05e-01 | 0.2442 |
| 5055 | SERPINB2 | SYSMH5 | Human | Oral cavity | OSCC | 1.18e-02 | 3.82e-01 | 0.0647 |
| 5055 | SERPINB2 | P1_S1_AK | Human | Skin | AK | 1.10e-02 | -3.79e-01 | -0.3399 |
| 5055 | SERPINB2 | P2_S3_AK | Human | Skin | AK | 2.80e-12 | -6.35e-01 | -0.3287 |
| 5055 | SERPINB2 | P3_S6_AK | Human | Skin | AK | 1.51e-04 | -4.37e-01 | -0.3256 |
| 5055 | SERPINB2 | P5_S10_cSCC | Human | Skin | cSCC | 6.94e-11 | -5.17e-01 | -0.299 |
| 5055 | SERPINB2 | P1_cSCC | Human | Skin | cSCC | 4.63e-08 | -7.02e-01 | 0.0292 |
| Page: 1 2 |
| Tissue | Expression Dynamics | Abbreviation |
| Esophagus |  | ESCC: Esophageal squamous cell carcinoma |
| HGIN: High-grade intraepithelial neoplasias | ||
| LGIN: Low-grade intraepithelial neoplasias | ||
| Oral Cavity |  | EOLP: Erosive Oral lichen planus |
| LP: leukoplakia | ||
| NEOLP: Non-erosive oral lichen planus | ||
| OSCC: Oral squamous cell carcinoma | ||
| Skin | 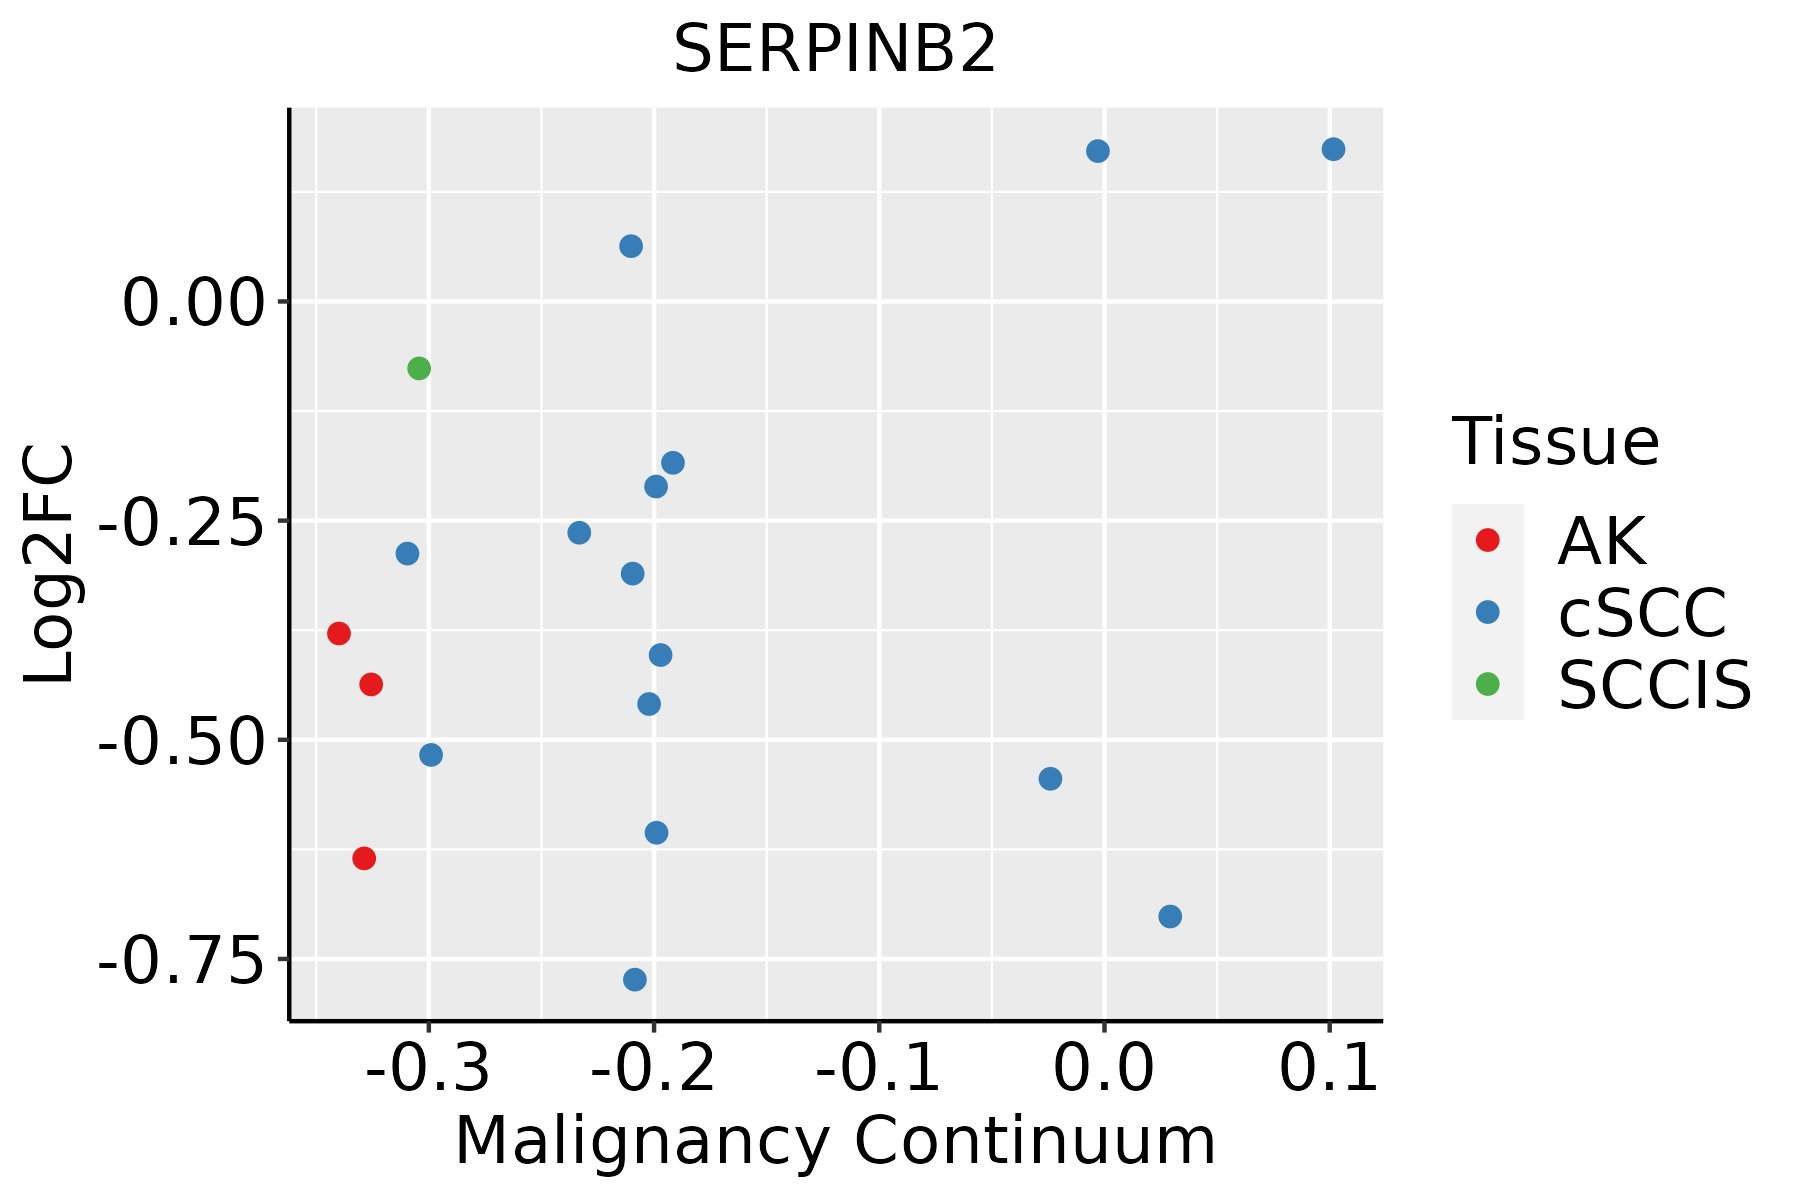 | AK: Actinic keratosis |
| cSCC: Cutaneous squamous cell carcinoma | ||
| SCCIS:squamous cell carcinoma in situ |
| ∗log2FC in expression of this searched gene in stem-like cells from each diseased tissue sample relative to stem-like cells in normal samples in each tissue plotted against the malignancy continuum. Samples are colored based on if they are from different disease stage. |
Top |
Malignant transformation related pathway analysis |
| Find out the enriched GO biological processes and KEGG pathways involved in transition from healthy to precancer to cancer |
| Tissue | Disease Stage | Enriched GO biological Processes |
| Colorectum | AD |  |
| Colorectum | SER |  |
| Colorectum | MSS |  |
| Colorectum | MSI-H |  |
| Colorectum | FAP |  |
| ∗Top 15 enriched GO BP terms are showed in the bar plot of each disease state in each tissue. Each row represents a significant GO biological process which is colored according to the -log10(p.adjust). |
| Page: 1 2 3 4 5 6 7 8 9 |
| GO ID | Tissue | Disease Stage | Description | Gene Ratio | Bg Ratio | pvalue | p.adjust | Count |
| GO:0052547111 | Esophagus | ESCC | regulation of peptidase activity | 275/8552 | 461/18723 | 7.54e-10 | 1.88e-08 | 275 |
| GO:0052548111 | Esophagus | ESCC | regulation of endopeptidase activity | 253/8552 | 432/18723 | 3.68e-08 | 6.78e-07 | 253 |
| GO:004206027 | Esophagus | ESCC | wound healing | 243/8552 | 422/18723 | 4.62e-07 | 6.25e-06 | 243 |
| GO:0045861111 | Esophagus | ESCC | negative regulation of proteolysis | 195/8552 | 351/18723 | 1.13e-04 | 7.85e-04 | 195 |
| GO:0051346110 | Esophagus | ESCC | negative regulation of hydrolase activity | 208/8552 | 379/18723 | 1.76e-04 | 1.14e-03 | 208 |
| GO:190303420 | Esophagus | ESCC | regulation of response to wounding | 93/8552 | 167/18723 | 5.77e-03 | 2.14e-02 | 93 |
| GO:001046620 | Esophagus | ESCC | negative regulation of peptidase activity | 140/8552 | 262/18723 | 6.73e-03 | 2.46e-02 | 140 |
| GO:001095119 | Esophagus | ESCC | negative regulation of endopeptidase activity | 135/8552 | 252/18723 | 6.86e-03 | 2.51e-02 | 135 |
| GO:004206020 | Oral cavity | OSCC | wound healing | 237/7305 | 422/18723 | 4.51e-13 | 2.18e-11 | 237 |
| GO:005254720 | Oral cavity | OSCC | regulation of peptidase activity | 255/7305 | 461/18723 | 5.78e-13 | 2.75e-11 | 255 |
| GO:005254820 | Oral cavity | OSCC | regulation of endopeptidase activity | 235/7305 | 432/18723 | 4.35e-11 | 1.40e-09 | 235 |
| GO:004586120 | Oral cavity | OSCC | negative regulation of proteolysis | 181/7305 | 351/18723 | 1.01e-06 | 1.37e-05 | 181 |
| GO:005134618 | Oral cavity | OSCC | negative regulation of hydrolase activity | 182/7305 | 379/18723 | 1.98e-04 | 1.32e-03 | 182 |
| GO:001095117 | Oral cavity | OSCC | negative regulation of endopeptidase activity | 126/7305 | 252/18723 | 2.37e-04 | 1.54e-03 | 126 |
| GO:001046618 | Oral cavity | OSCC | negative regulation of peptidase activity | 130/7305 | 262/18723 | 2.89e-04 | 1.82e-03 | 130 |
| GO:190303418 | Oral cavity | OSCC | regulation of response to wounding | 87/7305 | 167/18723 | 3.91e-04 | 2.38e-03 | 87 |
| GO:005087819 | Oral cavity | OSCC | regulation of body fluid levels | 179/7305 | 379/18723 | 6.19e-04 | 3.50e-03 | 179 |
| GO:006104116 | Oral cavity | OSCC | regulation of wound healing | 69/7305 | 134/18723 | 2.19e-03 | 9.95e-03 | 69 |
| GO:00075969 | Oral cavity | OSCC | blood coagulation | 102/7305 | 217/18723 | 9.69e-03 | 3.43e-02 | 102 |
| GO:00075999 | Oral cavity | OSCC | hemostasis | 103/7305 | 222/18723 | 1.45e-02 | 4.73e-02 | 103 |
| Page: 1 2 3 |
| Pathway ID | Tissue | Disease Stage | Description | Gene Ratio | Bg Ratio | pvalue | p.adjust | qvalue | Count |
| Page: 1 |
Top |
Cell-cell communication analysis |
| Identification of potential cell-cell interactions between two cell types and their ligand-receptor pairs for different disease states |
| Ligand | Receptor | LRpair | Pathway | Tissue | Disease Stage |
| Page: 1 |
Top |
Single-cell gene regulatory network inference analysis |
| Find out the significant the regulons (TFs) and the target genes of each regulon across cell types for different disease states |
| TF | Cell Type | Tissue | Disease Stage | Target Gene | RSS | Regulon Activity |
| ∗The dot plots of a searched regulon are shown for all cell subpopulations in each disease state of each tissue based on the regulon specific score inferred using pySCENIC and by calculating the average expression. |
| Page: 1 |
Top |
Somatic mutation of malignant transformation related genes |
| Annotation of somatic variants for genes involved in malignant transformation |
| Hugo Symbol | Variant Class | Variant Classification | dbSNP RS | HGVSc | HGVSp | HGVSp Short | SWISSPROT | BIOTYPE | SIFT | PolyPhen | Tumor Sample Barcode | Tissue | Histology | Sex | Age | Stage | Therapy Types | Drugs | Outcome |
| SERPINB2 | SNV | Missense_Mutation | c.220N>A | p.Glu74Lys | p.E74K | P05120 | protein_coding | tolerated(0.33) | benign(0.005) | TCGA-BH-A0HF-01 | Breast | breast invasive carcinoma | Female | >=65 | I/II | Hormone Therapy | arimidex | SD | |
| SERPINB2 | SNV | Missense_Mutation | rs370190157 | c.767N>A | p.Leu256His | p.L256H | P05120 | protein_coding | deleterious(0) | probably_damaging(0.99) | TCGA-D8-A1XK-01 | Breast | breast invasive carcinoma | Female | <65 | I/II | Chemotherapy | doxorubicine+cyclophosphamide | SD |
| SERPINB2 | SNV | Missense_Mutation | novel | c.638N>G | p.Glu213Gly | p.E213G | P05120 | protein_coding | tolerated(0.3) | benign(0.258) | TCGA-2W-A8YY-01 | Cervix | cervical & endocervical cancer | Female | <65 | I/II | Chemotherapy | cisplatin | CR |
| SERPINB2 | SNV | Missense_Mutation | novel | c.642G>C | p.Lys214Asn | p.K214N | P05120 | protein_coding | tolerated(0.22) | benign(0.104) | TCGA-MA-AA3Y-01 | Cervix | cervical & endocervical cancer | Female | <65 | I/II | Unknown | Unknown | SD |
| SERPINB2 | SNV | Missense_Mutation | c.1051N>A | p.Leu351Ile | p.L351I | P05120 | protein_coding | tolerated(0.21) | possibly_damaging(0.545) | TCGA-AA-3510-01 | Colorectum | colon adenocarcinoma | Male | >=65 | I/II | Unknown | Unknown | SD | |
| SERPINB2 | SNV | Missense_Mutation | novel | c.857T>C | p.Ile286Thr | p.I286T | P05120 | protein_coding | deleterious(0.01) | possibly_damaging(0.81) | TCGA-AA-3663-01 | Colorectum | colon adenocarcinoma | Male | <65 | I/II | Unknown | Unknown | SD |
| SERPINB2 | SNV | Missense_Mutation | rs553765342 | c.19G>A | p.Ala7Thr | p.A7T | P05120 | protein_coding | deleterious(0.03) | probably_damaging(0.969) | TCGA-AA-3949-01 | Colorectum | colon adenocarcinoma | Female | >=65 | III/IV | Unknown | Unknown | SD |
| SERPINB2 | SNV | Missense_Mutation | c.581N>T | p.Thr194Ile | p.T194I | P05120 | protein_coding | deleterious(0) | probably_damaging(0.999) | TCGA-AA-3977-01 | Colorectum | colon adenocarcinoma | Male | >=65 | I/II | Unknown | Unknown | SD | |
| SERPINB2 | SNV | Missense_Mutation | novel | c.1183N>A | p.Leu395Ile | p.L395I | P05120 | protein_coding | tolerated(0.06) | possibly_damaging(0.545) | TCGA-AA-3984-01 | Colorectum | colon adenocarcinoma | Female | <65 | I/II | Unknown | Unknown | SD |
| SERPINB2 | SNV | Missense_Mutation | c.512N>T | p.Ser171Phe | p.S171F | P05120 | protein_coding | deleterious(0.02) | benign(0.105) | TCGA-AA-A010-01 | Colorectum | colon adenocarcinoma | Female | <65 | I/II | Chemotherapy | folinic | CR |
| Page: 1 2 3 4 5 6 7 8 |
Top |
Related drugs of malignant transformation related genes |
| Identification of chemicals and drugs interact with genes involved in malignant transfromation |
| (DGIdb 4.0) |
| Entrez ID | Symbol | Category | Interaction Types | Drug Claim Name | Drug Name | PMIDs |
| 5055 | SERPINB2 | PROTEASE INHIBITOR, DRUGGABLE GENOME | UROKINASE | UROKINASE |
| Page: 1 |

Copyright 2023-Present -The University of Texas Health Science Center at Houston |