
|
|||||
|
 | |
| |
| |
| |
| |
| |
|
Gene: SERPINB13 |
Gene summary for SERPINB13 |
| Gene information | Species | Human | Gene symbol | SERPINB13 | Gene ID | 5275 |
| Gene name | serpin family B member 13 | |
| Gene Alias | HSHUR7SEQ | |
| Cytomap | 18q21.33 | |
| Gene Type | protein-coding | GO ID | GO:0006508 | UniProtAcc | A0A0A0MQW3 |
Top |
Malignant transformation analysis |
| Identification of the aberrant gene expression in precancerous and cancerous lesions by comparing the gene expression of stem-like cells in diseased tissues with normal stem cells |
| Entrez ID | Symbol | Replicates | Species | Organ | Tissue | Adj P-value | Log2FC | Malignancy |
| 5275 | SERPINB13 | CA_HPV_2 | Human | Cervix | CC | 4.89e-12 | 5.10e-01 | 0.0391 |
| 5275 | SERPINB13 | CCI_1 | Human | Cervix | CC | 2.13e-21 | 1.49e+00 | 0.528 |
| 5275 | SERPINB13 | CCI_2 | Human | Cervix | CC | 2.03e-05 | 1.45e+00 | 0.5249 |
| 5275 | SERPINB13 | CCI_3 | Human | Cervix | CC | 1.25e-16 | 1.66e+00 | 0.516 |
| 5275 | SERPINB13 | CCII_1 | Human | Cervix | CC | 6.28e-05 | 4.39e-01 | 0.3249 |
| 5275 | SERPINB13 | Tumor | Human | Cervix | CC | 2.54e-104 | 1.52e+00 | 0.1241 |
| 5275 | SERPINB13 | sample3 | Human | Cervix | CC | 8.94e-117 | 1.57e+00 | 0.1387 |
| 5275 | SERPINB13 | L1 | Human | Cervix | CC | 2.61e-11 | 8.11e-01 | 0.0802 |
| 5275 | SERPINB13 | T3 | Human | Cervix | CC | 8.97e-128 | 1.61e+00 | 0.1389 |
| 5275 | SERPINB13 | LZE8T | Human | Esophagus | ESCC | 9.68e-05 | 1.98e-01 | 0.067 |
| 5275 | SERPINB13 | P1T-E | Human | Esophagus | ESCC | 4.54e-04 | 1.60e-01 | 0.0875 |
| 5275 | SERPINB13 | P5T-E | Human | Esophagus | ESCC | 2.80e-40 | 8.73e-01 | 0.1327 |
| 5275 | SERPINB13 | P8T-E | Human | Esophagus | ESCC | 1.46e-05 | 1.59e-01 | 0.0889 |
| 5275 | SERPINB13 | P9T-E | Human | Esophagus | ESCC | 1.21e-13 | 3.43e-01 | 0.1131 |
| 5275 | SERPINB13 | P23T-E | Human | Esophagus | ESCC | 1.45e-22 | 1.12e+00 | 0.108 |
| 5275 | SERPINB13 | P26T-E | Human | Esophagus | ESCC | 2.04e-08 | 3.31e-01 | 0.1276 |
| 5275 | SERPINB13 | P30T-E | Human | Esophagus | ESCC | 6.61e-28 | 1.05e+00 | 0.137 |
| 5275 | SERPINB13 | P37T-E | Human | Esophagus | ESCC | 6.65e-13 | 3.32e-01 | 0.1371 |
| 5275 | SERPINB13 | P39T-E | Human | Esophagus | ESCC | 2.39e-06 | 2.62e-01 | 0.0894 |
| 5275 | SERPINB13 | P47T-E | Human | Esophagus | ESCC | 7.94e-12 | 3.14e-01 | 0.1067 |
| Page: 1 2 |
| Tissue | Expression Dynamics | Abbreviation |
| Cervix |  | CC: Cervix cancer |
| HSIL_HPV: HPV-infected high-grade squamous intraepithelial lesions | ||
| N_HPV: HPV-infected normal cervix | ||
| Esophagus | 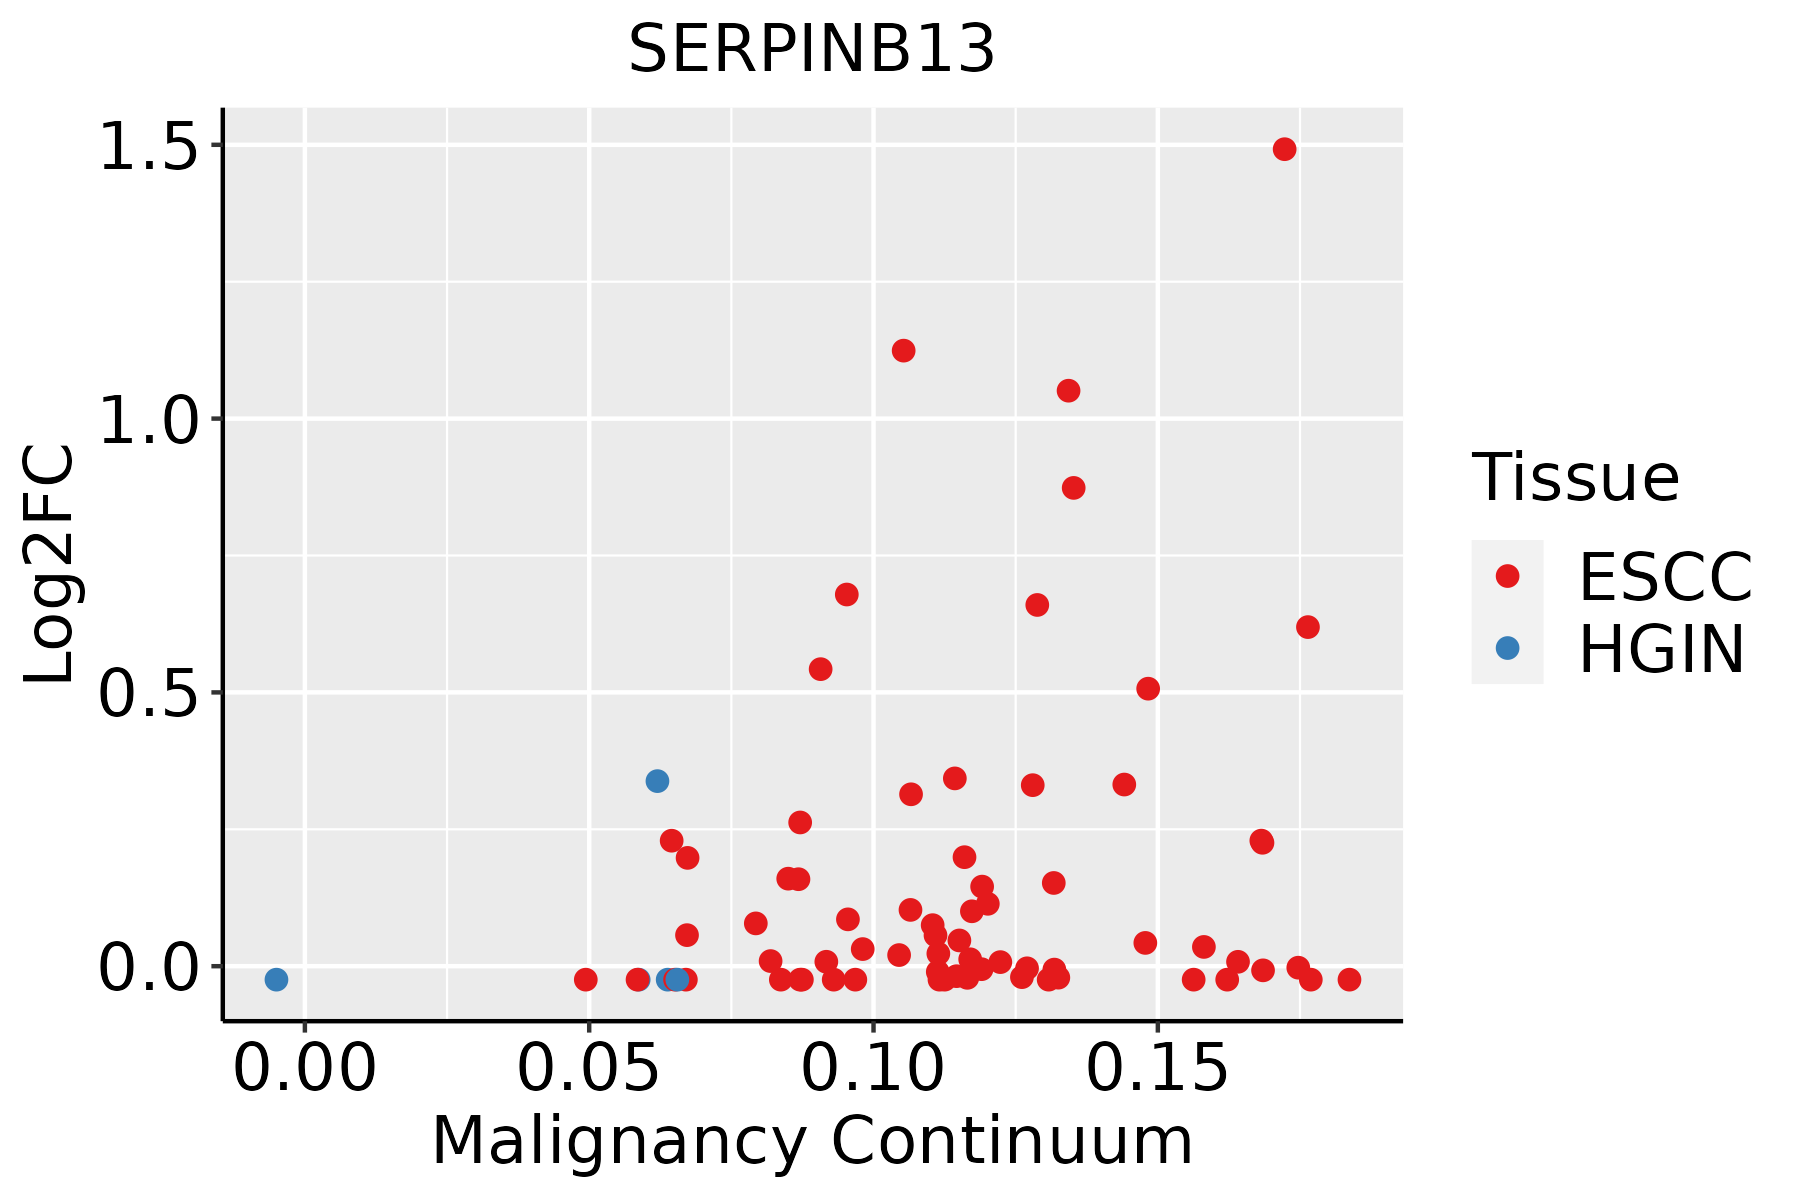 | ESCC: Esophageal squamous cell carcinoma |
| HGIN: High-grade intraepithelial neoplasias | ||
| LGIN: Low-grade intraepithelial neoplasias | ||
| Oral Cavity | 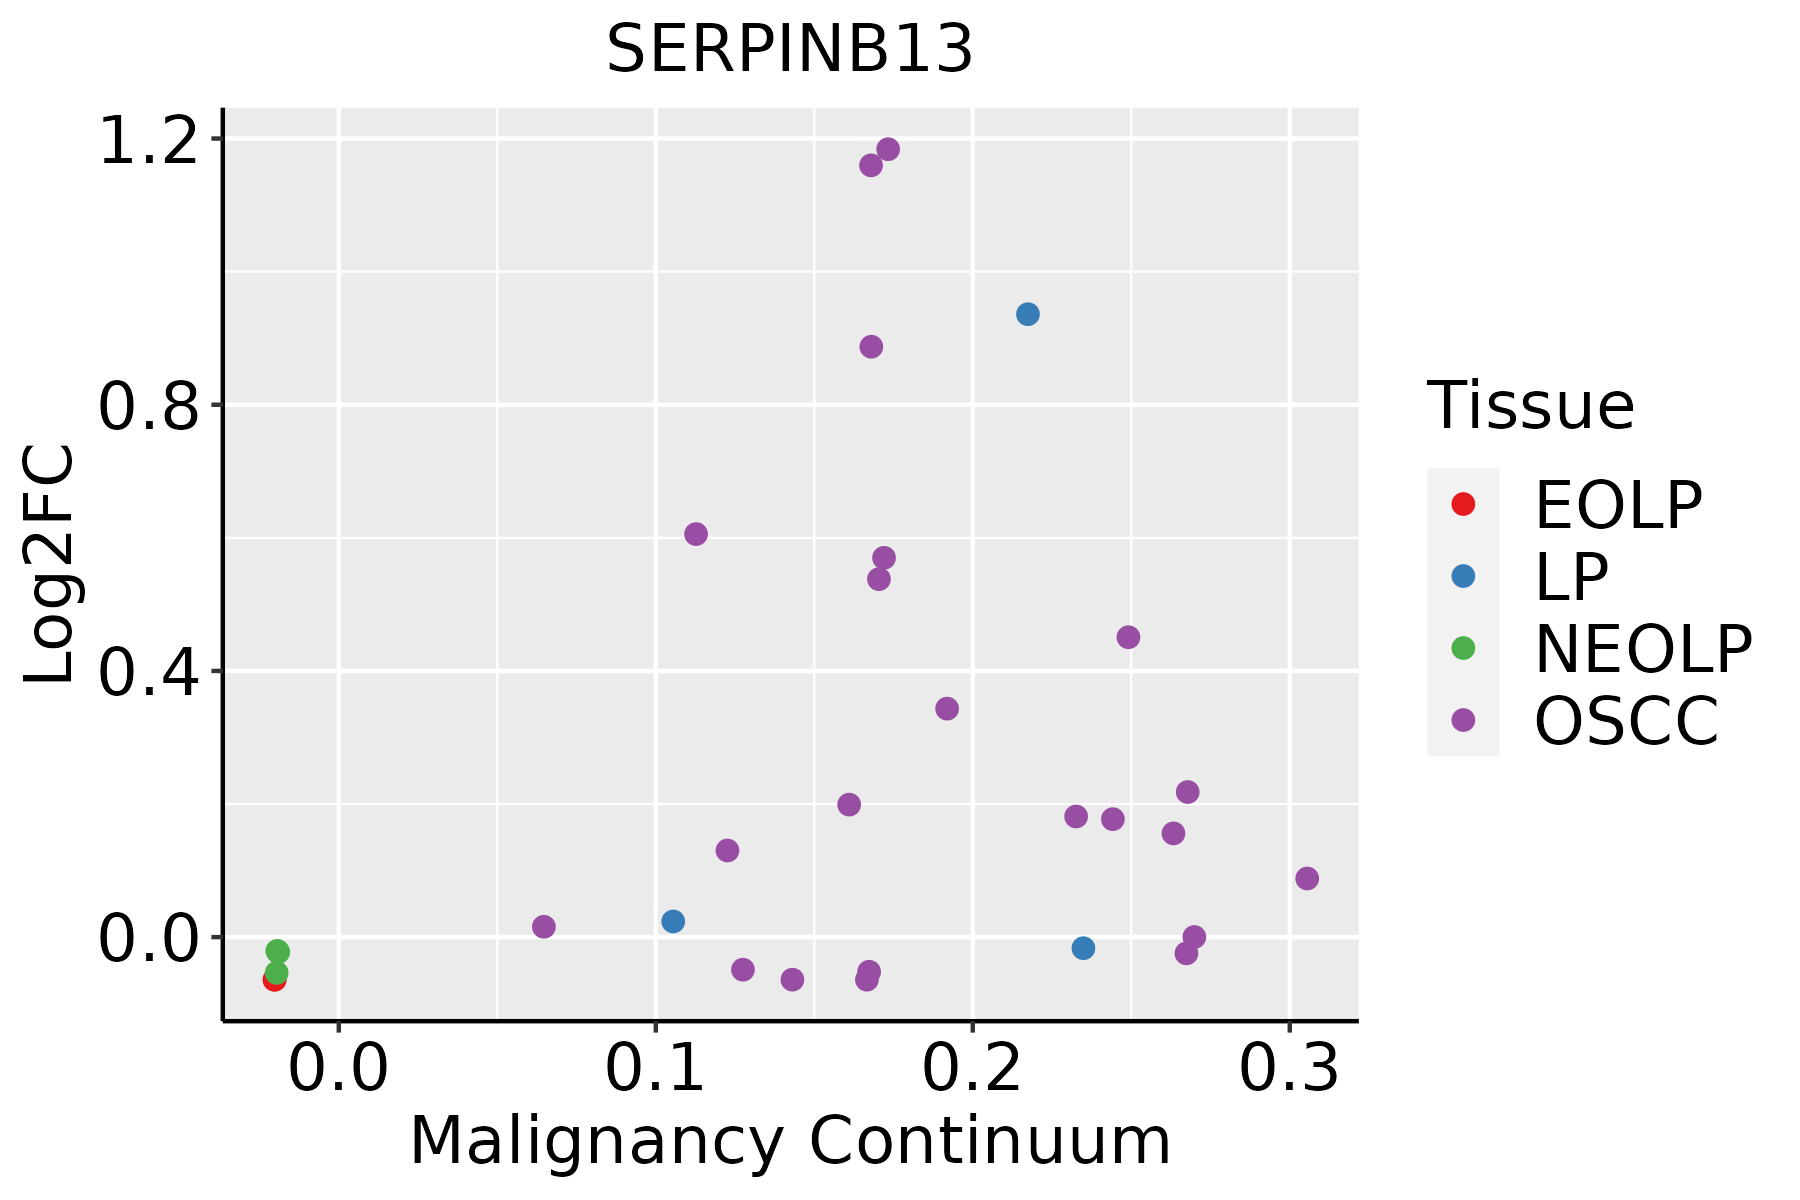 | EOLP: Erosive Oral lichen planus |
| LP: leukoplakia | ||
| NEOLP: Non-erosive oral lichen planus | ||
| OSCC: Oral squamous cell carcinoma | ||
| Skin |  | AK: Actinic keratosis |
| cSCC: Cutaneous squamous cell carcinoma | ||
| SCCIS:squamous cell carcinoma in situ |
| ∗log2FC in expression of this searched gene in stem-like cells from each diseased tissue sample relative to stem-like cells in normal samples in each tissue plotted against the malignancy continuum. Samples are colored based on if they are from different disease stage. |
Top |
Malignant transformation related pathway analysis |
| Find out the enriched GO biological processes and KEGG pathways involved in transition from healthy to precancer to cancer |
| Tissue | Disease Stage | Enriched GO biological Processes |
| Colorectum | AD |  |
| Colorectum | SER |  |
| Colorectum | MSS |  |
| Colorectum | MSI-H |  |
| Colorectum | FAP |  |
| ∗Top 15 enriched GO BP terms are showed in the bar plot of each disease state in each tissue. Each row represents a significant GO biological process which is colored according to the -log10(p.adjust). |
| Page: 1 2 3 4 5 6 7 8 9 |
| GO ID | Tissue | Disease Stage | Description | Gene Ratio | Bg Ratio | pvalue | p.adjust | Count |
| GO:005254710 | Cervix | CC | regulation of peptidase activity | 112/2311 | 461/18723 | 6.70e-13 | 3.08e-10 | 112 |
| GO:005254810 | Cervix | CC | regulation of endopeptidase activity | 103/2311 | 432/18723 | 1.89e-11 | 5.14e-09 | 103 |
| GO:004586110 | Cervix | CC | negative regulation of proteolysis | 80/2311 | 351/18723 | 2.88e-08 | 1.98e-06 | 80 |
| GO:00513469 | Cervix | CC | negative regulation of hydrolase activity | 81/2311 | 379/18723 | 4.27e-07 | 1.67e-05 | 81 |
| GO:00104669 | Cervix | CC | negative regulation of peptidase activity | 60/2311 | 262/18723 | 1.27e-06 | 4.34e-05 | 60 |
| GO:001095110 | Cervix | CC | negative regulation of endopeptidase activity | 56/2311 | 252/18723 | 7.43e-06 | 1.74e-04 | 56 |
| GO:00093149 | Cervix | CC | response to radiation | 86/2311 | 456/18723 | 3.50e-05 | 5.63e-04 | 86 |
| GO:00094112 | Cervix | CC | response to UV | 33/2311 | 149/18723 | 5.51e-04 | 5.29e-03 | 33 |
| GO:19040194 | Cervix | CC | epithelial cell apoptotic process | 27/2311 | 121/18723 | 1.49e-03 | 1.16e-02 | 27 |
| GO:00094163 | Cervix | CC | response to light stimulus | 54/2311 | 320/18723 | 1.03e-02 | 4.97e-02 | 54 |
| GO:000941113 | Esophagus | ESCC | response to UV | 115/8552 | 149/18723 | 3.29e-15 | 1.93e-13 | 115 |
| GO:000931419 | Esophagus | ESCC | response to radiation | 277/8552 | 456/18723 | 4.42e-11 | 1.43e-09 | 277 |
| GO:0052547111 | Esophagus | ESCC | regulation of peptidase activity | 275/8552 | 461/18723 | 7.54e-10 | 1.88e-08 | 275 |
| GO:0052548111 | Esophagus | ESCC | regulation of endopeptidase activity | 253/8552 | 432/18723 | 3.68e-08 | 6.78e-07 | 253 |
| GO:000941611 | Esophagus | ESCC | response to light stimulus | 183/8552 | 320/18723 | 2.03e-05 | 1.76e-04 | 183 |
| GO:0045861111 | Esophagus | ESCC | negative regulation of proteolysis | 195/8552 | 351/18723 | 1.13e-04 | 7.85e-04 | 195 |
| GO:0051346110 | Esophagus | ESCC | negative regulation of hydrolase activity | 208/8552 | 379/18723 | 1.76e-04 | 1.14e-03 | 208 |
| GO:001046620 | Esophagus | ESCC | negative regulation of peptidase activity | 140/8552 | 262/18723 | 6.73e-03 | 2.46e-02 | 140 |
| GO:001095119 | Esophagus | ESCC | negative regulation of endopeptidase activity | 135/8552 | 252/18723 | 6.86e-03 | 2.51e-02 | 135 |
| GO:19040197 | Esophagus | ESCC | epithelial cell apoptotic process | 68/8552 | 121/18723 | 1.27e-02 | 4.21e-02 | 68 |
| Page: 1 2 |
| Pathway ID | Tissue | Disease Stage | Description | Gene Ratio | Bg Ratio | pvalue | p.adjust | qvalue | Count |
| hsa051465 | Cervix | CC | Amoebiasis | 29/1267 | 102/8465 | 3.31e-04 | 1.70e-03 | 1.01e-03 | 29 |
| hsa0514612 | Cervix | CC | Amoebiasis | 29/1267 | 102/8465 | 3.31e-04 | 1.70e-03 | 1.01e-03 | 29 |
| hsa051468 | Oral cavity | OSCC | Amoebiasis | 59/3704 | 102/8465 | 2.78e-03 | 7.17e-03 | 3.65e-03 | 59 |
| hsa0514615 | Oral cavity | OSCC | Amoebiasis | 59/3704 | 102/8465 | 2.78e-03 | 7.17e-03 | 3.65e-03 | 59 |
| Page: 1 |
Top |
Cell-cell communication analysis |
| Identification of potential cell-cell interactions between two cell types and their ligand-receptor pairs for different disease states |
| Ligand | Receptor | LRpair | Pathway | Tissue | Disease Stage |
| Page: 1 |
Top |
Single-cell gene regulatory network inference analysis |
| Find out the significant the regulons (TFs) and the target genes of each regulon across cell types for different disease states |
| TF | Cell Type | Tissue | Disease Stage | Target Gene | RSS | Regulon Activity |
| ∗The dot plots of a searched regulon are shown for all cell subpopulations in each disease state of each tissue based on the regulon specific score inferred using pySCENIC and by calculating the average expression. |
| Page: 1 |
Top |
Somatic mutation of malignant transformation related genes |
| Annotation of somatic variants for genes involved in malignant transformation |
| Hugo Symbol | Variant Class | Variant Classification | dbSNP RS | HGVSc | HGVSp | HGVSp Short | SWISSPROT | BIOTYPE | SIFT | PolyPhen | Tumor Sample Barcode | Tissue | Histology | Sex | Age | Stage | Therapy Types | Drugs | Outcome |
| SERPINB13 | SNV | Missense_Mutation | novel | c.391N>T | p.Asp131Tyr | p.D131Y | protein_coding | deleterious(0) | probably_damaging(1) | TCGA-AN-A046-01 | Breast | breast invasive carcinoma | Female | >=65 | I/II | Unknown | Unknown | SD | |
| SERPINB13 | SNV | Missense_Mutation | rs377348890 | c.624N>T | p.Glu208Asp | p.E208D | protein_coding | tolerated(0.11) | probably_damaging(0.999) | TCGA-AN-A046-01 | Breast | breast invasive carcinoma | Female | >=65 | I/II | Unknown | Unknown | SD | |
| SERPINB13 | insertion | In_Frame_Ins | novel | c.1146_1147insCAT | p.Phe382_Ile383insHis | p.F382_I383insH | protein_coding | TCGA-A7-A26I-01 | Breast | breast invasive carcinoma | Female | >=65 | I/II | Chemotherapy | cytoxan | SD | |||
| SERPINB13 | SNV | Missense_Mutation | rs377348890 | c.624G>T | p.Glu208Asp | p.E208D | protein_coding | tolerated(0.11) | probably_damaging(0.999) | TCGA-FU-A3HZ-01 | Cervix | cervical & endocervical cancer | Female | <65 | I/II | Chemotherapy | cisplatin | CR | |
| SERPINB13 | SNV | Missense_Mutation | novel | c.114N>G | p.Ile38Met | p.I38M | protein_coding | tolerated(0.11) | probably_damaging(0.94) | TCGA-AA-3950-01 | Colorectum | colon adenocarcinoma | Female | >=65 | I/II | Unknown | Unknown | SD | |
| SERPINB13 | SNV | Missense_Mutation | c.805N>T | p.Asp269Tyr | p.D269Y | protein_coding | deleterious(0) | probably_damaging(0.985) | TCGA-AA-3977-01 | Colorectum | colon adenocarcinoma | Male | >=65 | I/II | Unknown | Unknown | SD | ||
| SERPINB13 | SNV | Missense_Mutation | rs139404423 | c.778N>A | p.Asp260Asn | p.D260N | protein_coding | tolerated(0.07) | probably_damaging(0.961) | TCGA-AZ-4315-01 | Colorectum | colon adenocarcinoma | Male | <65 | I/II | Unknown | Unknown | SD | |
| SERPINB13 | SNV | Missense_Mutation | rs138290904 | c.451N>A | p.Asp151Asn | p.D151N | protein_coding | deleterious(0) | probably_damaging(0.977) | TCGA-EI-6917-01 | Colorectum | rectum adenocarcinoma | Male | <65 | III/IV | Chemotherapy | 5fluorouracil+oxaciplatina+l-folinian | SD | |
| SERPINB13 | SNV | Missense_Mutation | rs576283991 | c.148N>A | p.Ala50Thr | p.A50T | protein_coding | deleterious(0.04) | benign(0.082) | TCGA-F5-6814-01 | Colorectum | rectum adenocarcinoma | Male | <65 | I/II | Unknown | Unknown | SD | |
| SERPINB13 | SNV | Missense_Mutation | rs377348890 | c.624N>T | p.Glu208Asp | p.E208D | protein_coding | tolerated(0.11) | probably_damaging(0.999) | TCGA-F5-6814-01 | Colorectum | rectum adenocarcinoma | Male | <65 | I/II | Unknown | Unknown | SD |
| Page: 1 2 3 4 5 6 |
Top |
Related drugs of malignant transformation related genes |
| Identification of chemicals and drugs interact with genes involved in malignant transfromation |
| (DGIdb 4.0) |
| Entrez ID | Symbol | Category | Interaction Types | Drug Claim Name | Drug Name | PMIDs |
| Page: 1 |

Copyright 2023-Present -The University of Texas Health Science Center at Houston |