| Tissue | Expression Dynamics | Abbreviation |
| Cervix | 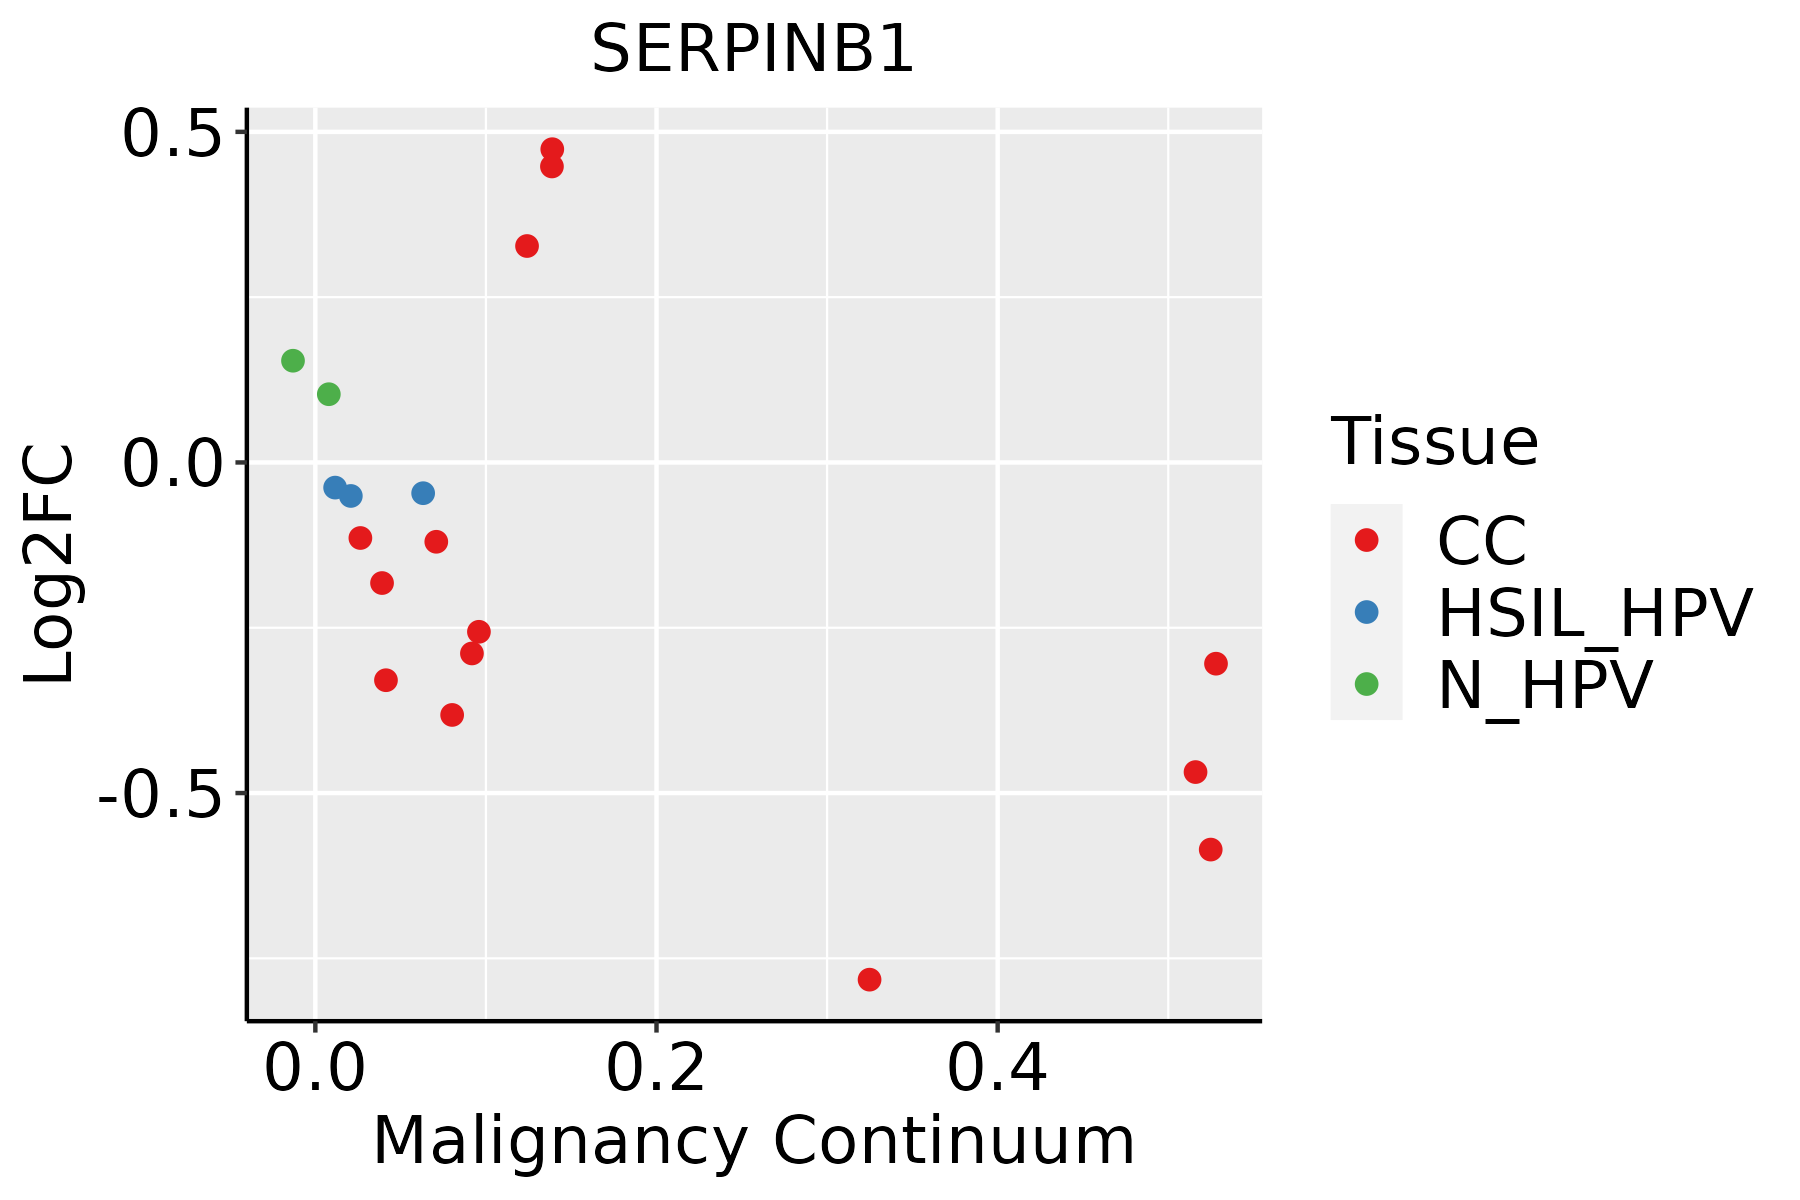 | CC: Cervix cancer |
| HSIL_HPV: HPV-infected high-grade squamous intraepithelial lesions |
| N_HPV: HPV-infected normal cervix |
| Colorectum (GSE201348) |  | FAP: Familial adenomatous polyposis |
| CRC: Colorectal cancer |
| Colorectum (HTA11) |  | AD: Adenomas |
| SER: Sessile serrated lesions |
| MSI-H: Microsatellite-high colorectal cancer |
| MSS: Microsatellite stable colorectal cancer |
| Esophagus | 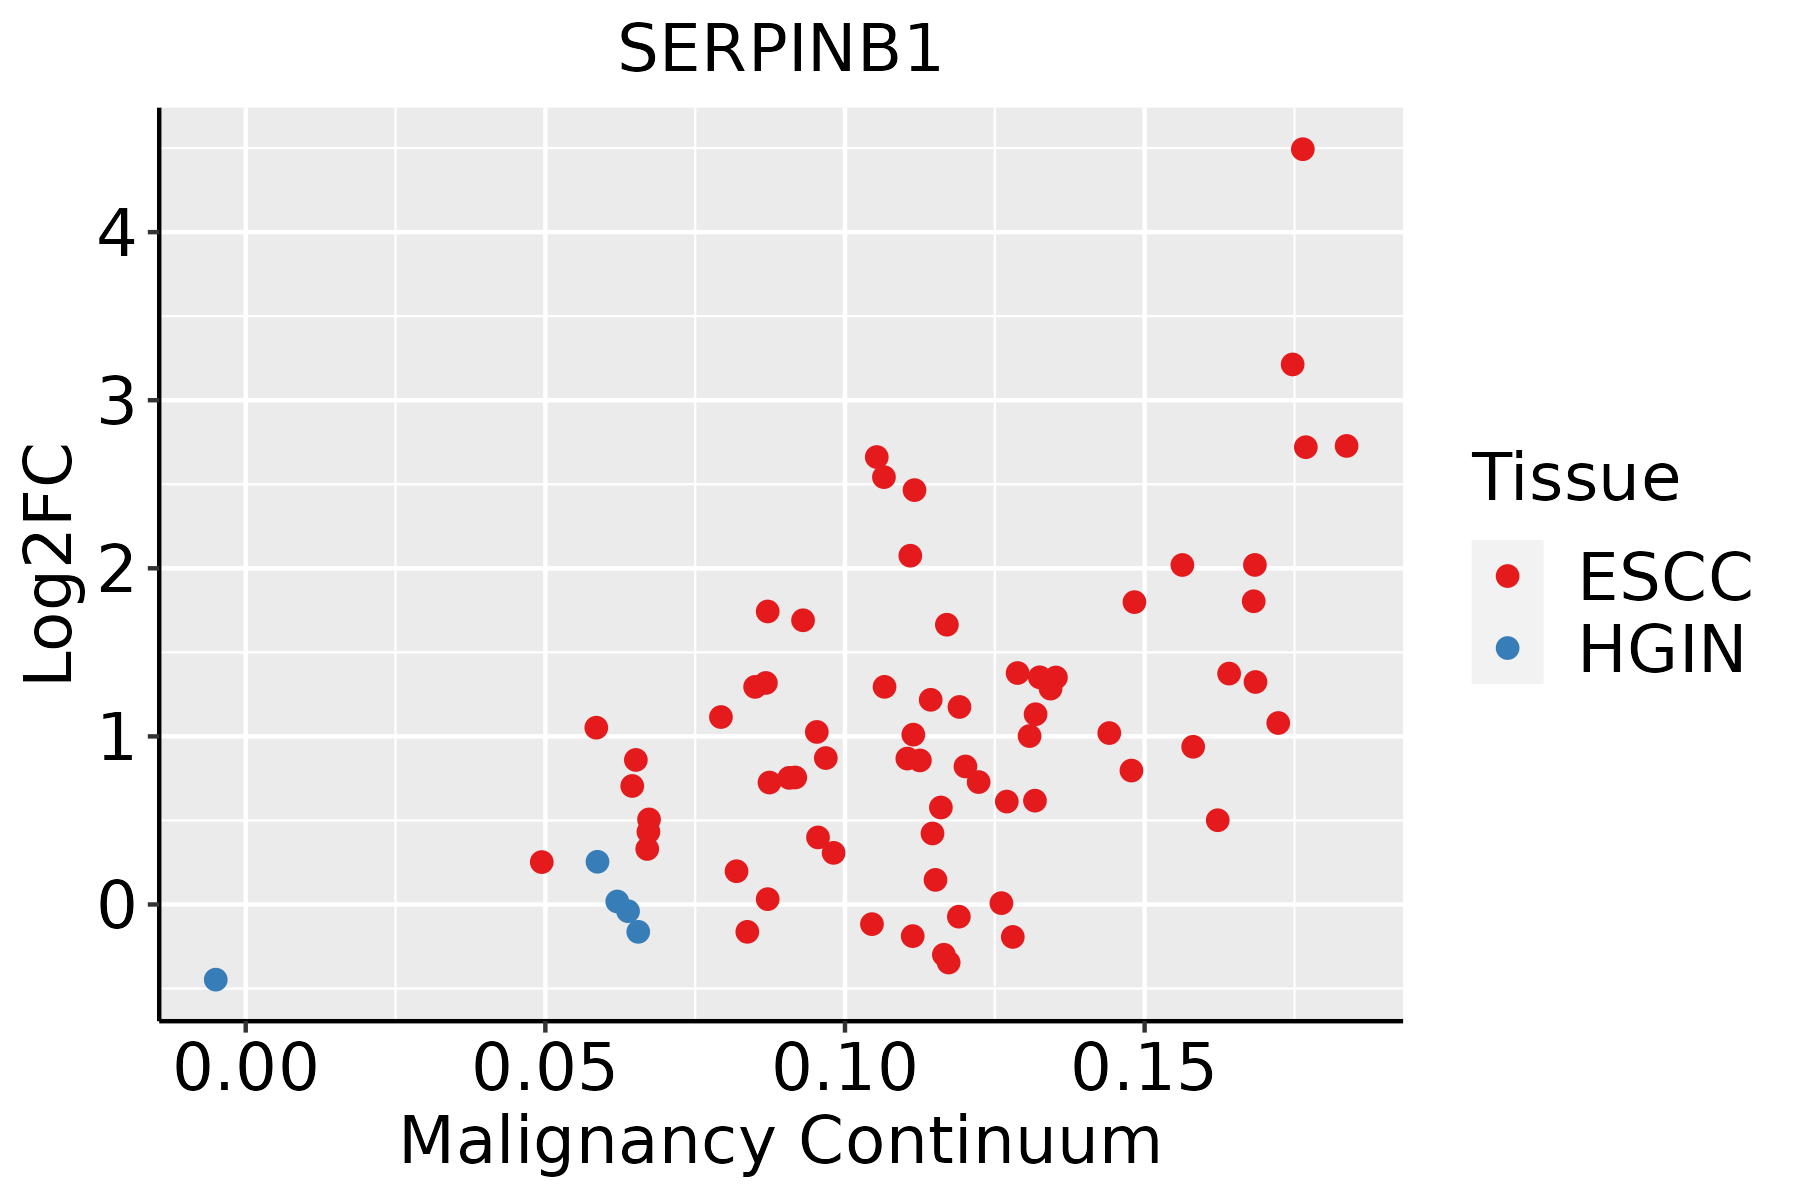 | ESCC: Esophageal squamous cell carcinoma |
| HGIN: High-grade intraepithelial neoplasias |
| LGIN: Low-grade intraepithelial neoplasias |
| GC | 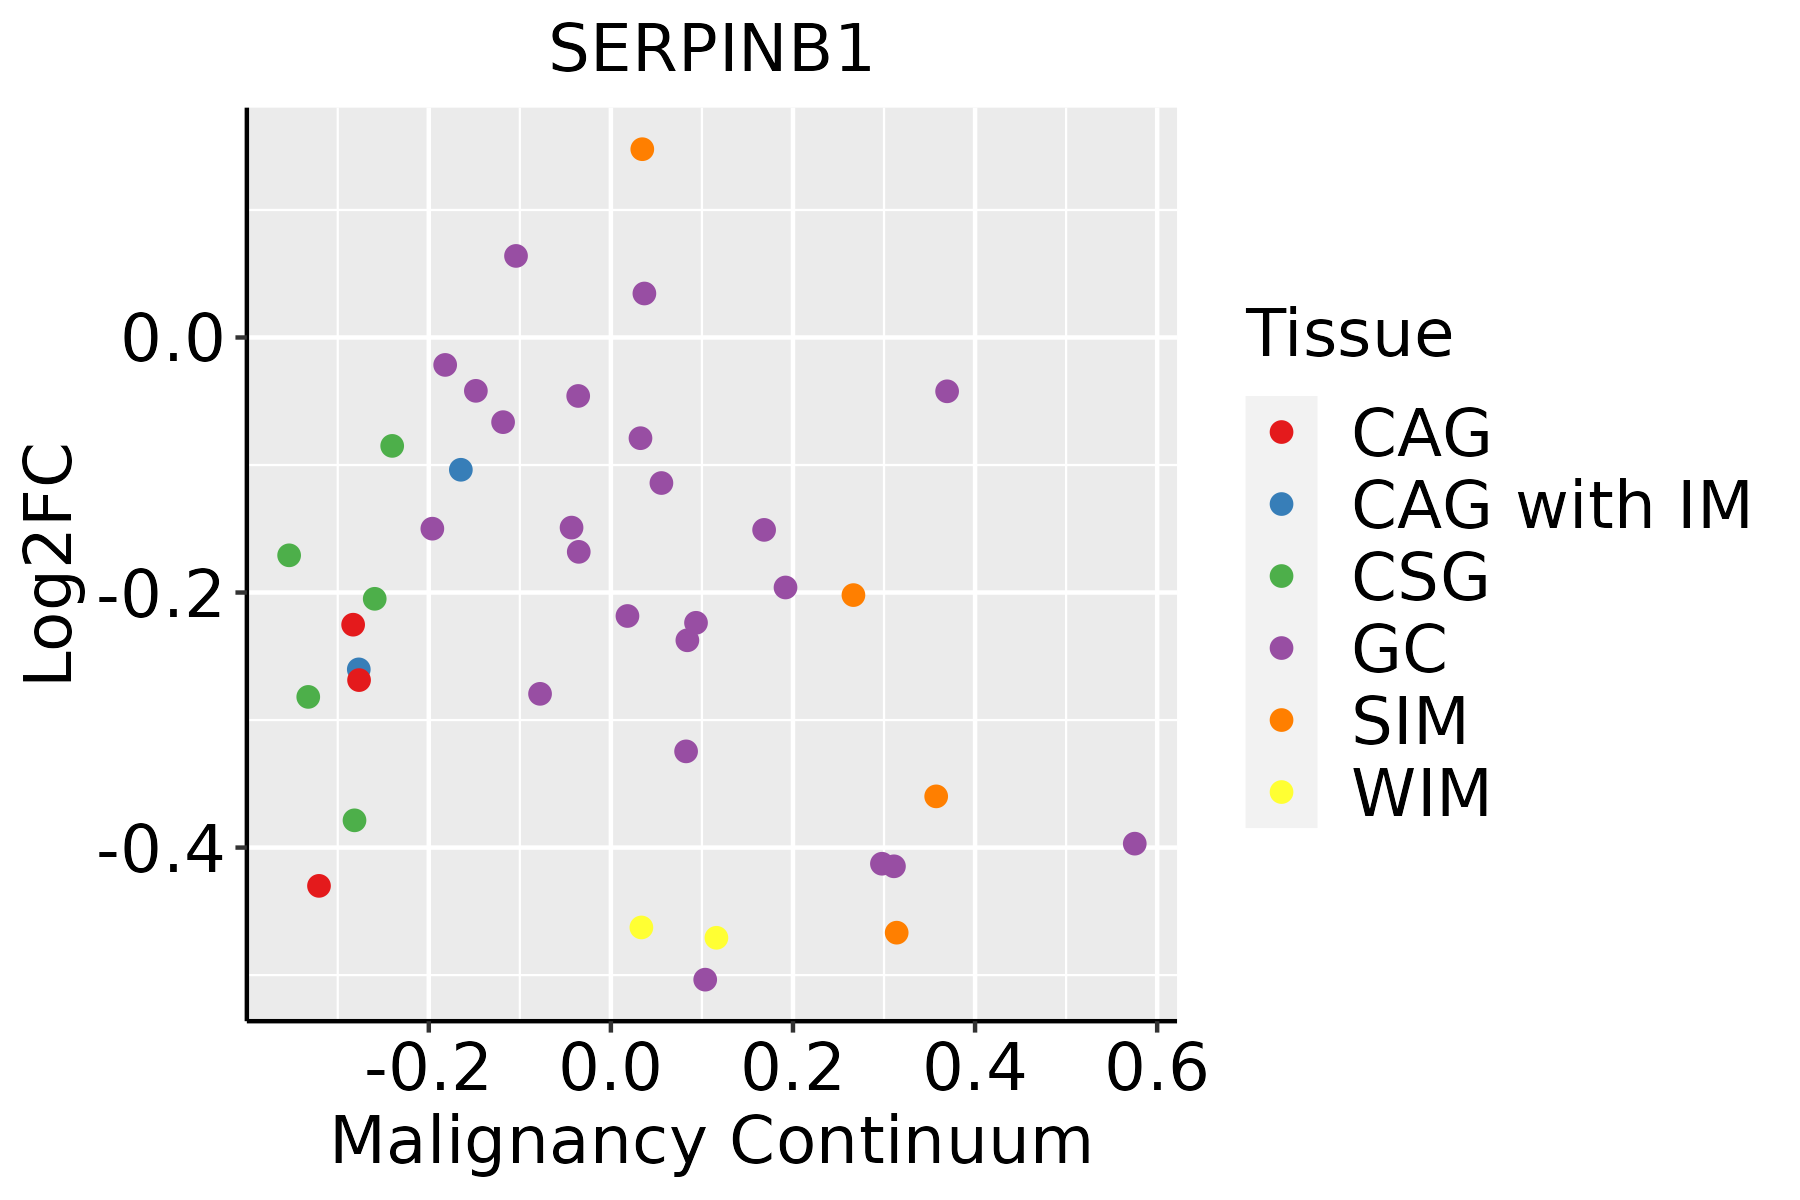 | CAG: Chronic atrophic gastritis |
| CAG with IM: Chronic atrophic gastritis with intestinal metaplasia |
| CSG: Chronic superficial gastritis |
| GC: Gastric cancer |
| SIM: Severe intestinal metaplasia |
| WIM: Wild intestinal metaplasia |
| Liver | 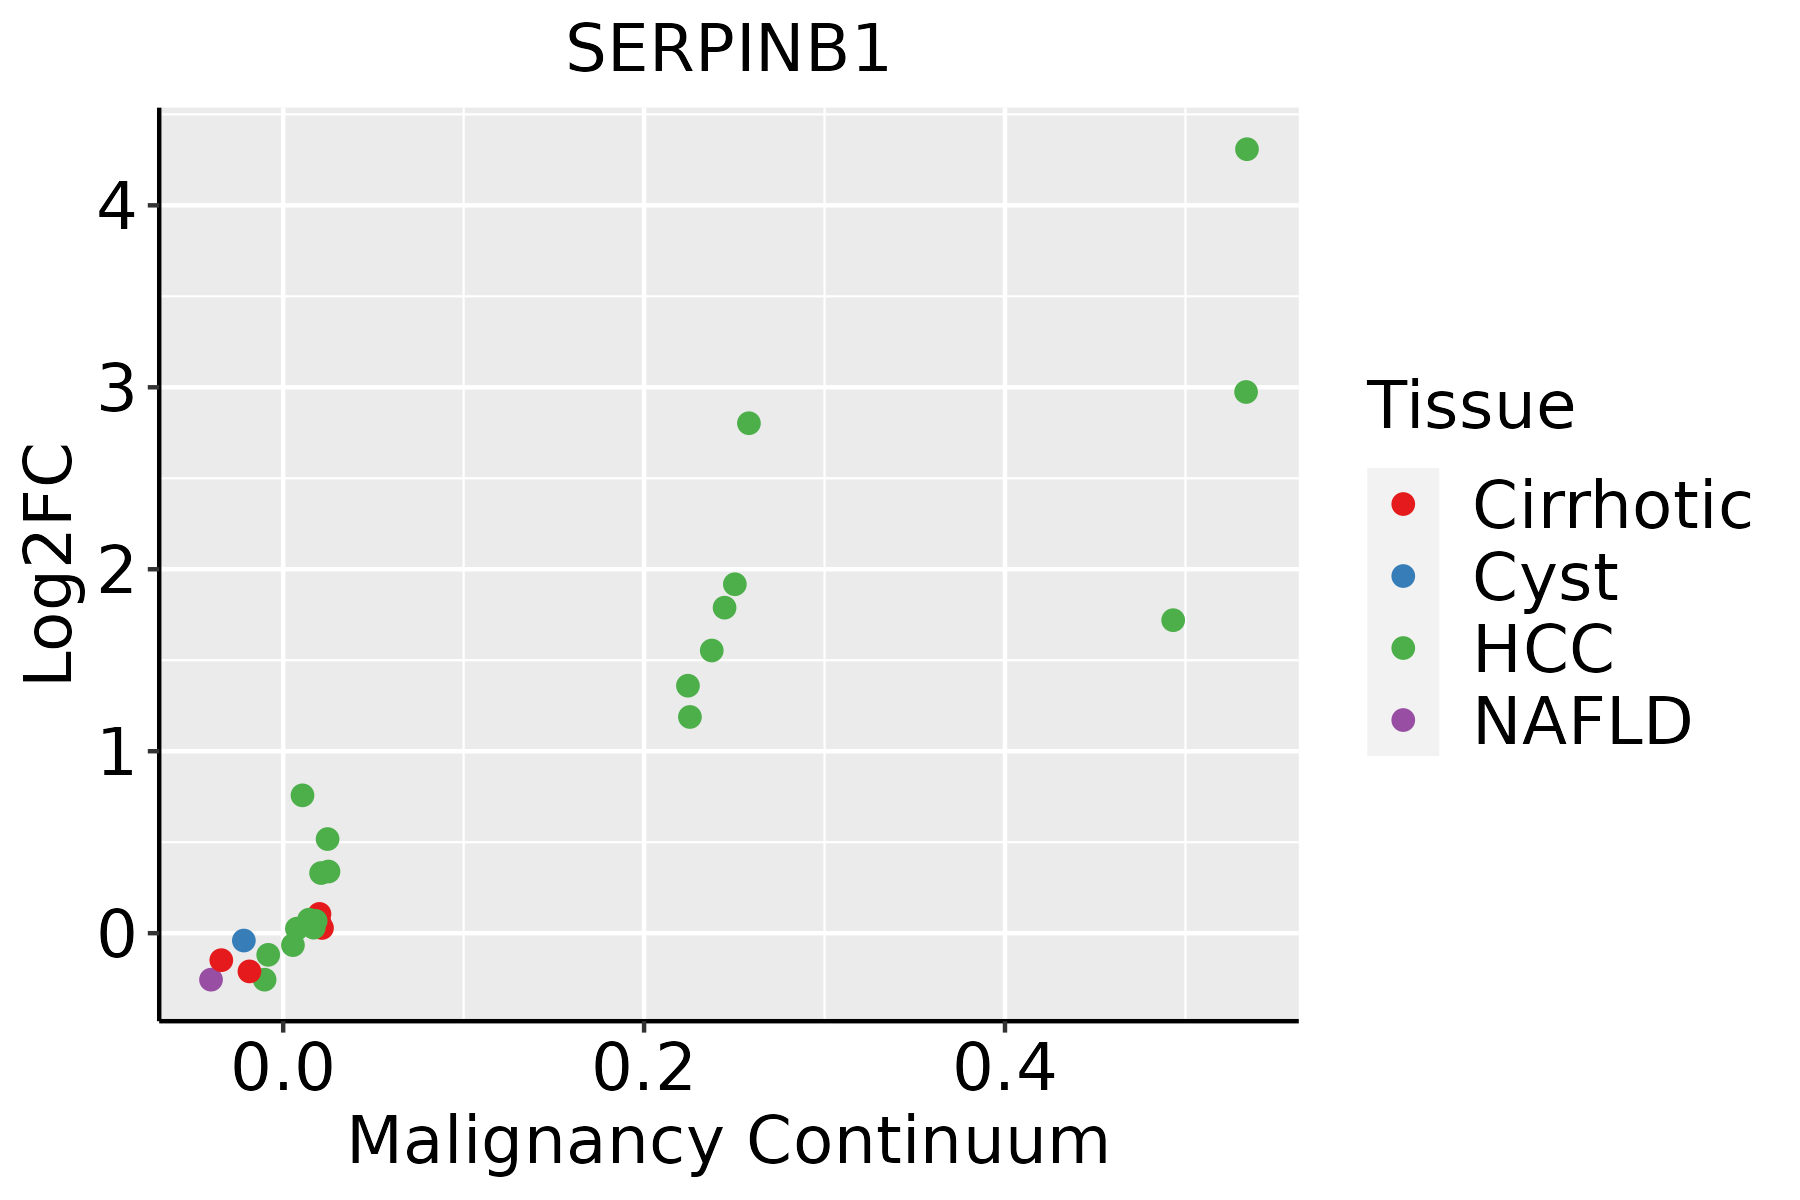 | HCC: Hepatocellular carcinoma |
| NAFLD: Non-alcoholic fatty liver disease |
| Oral Cavity | 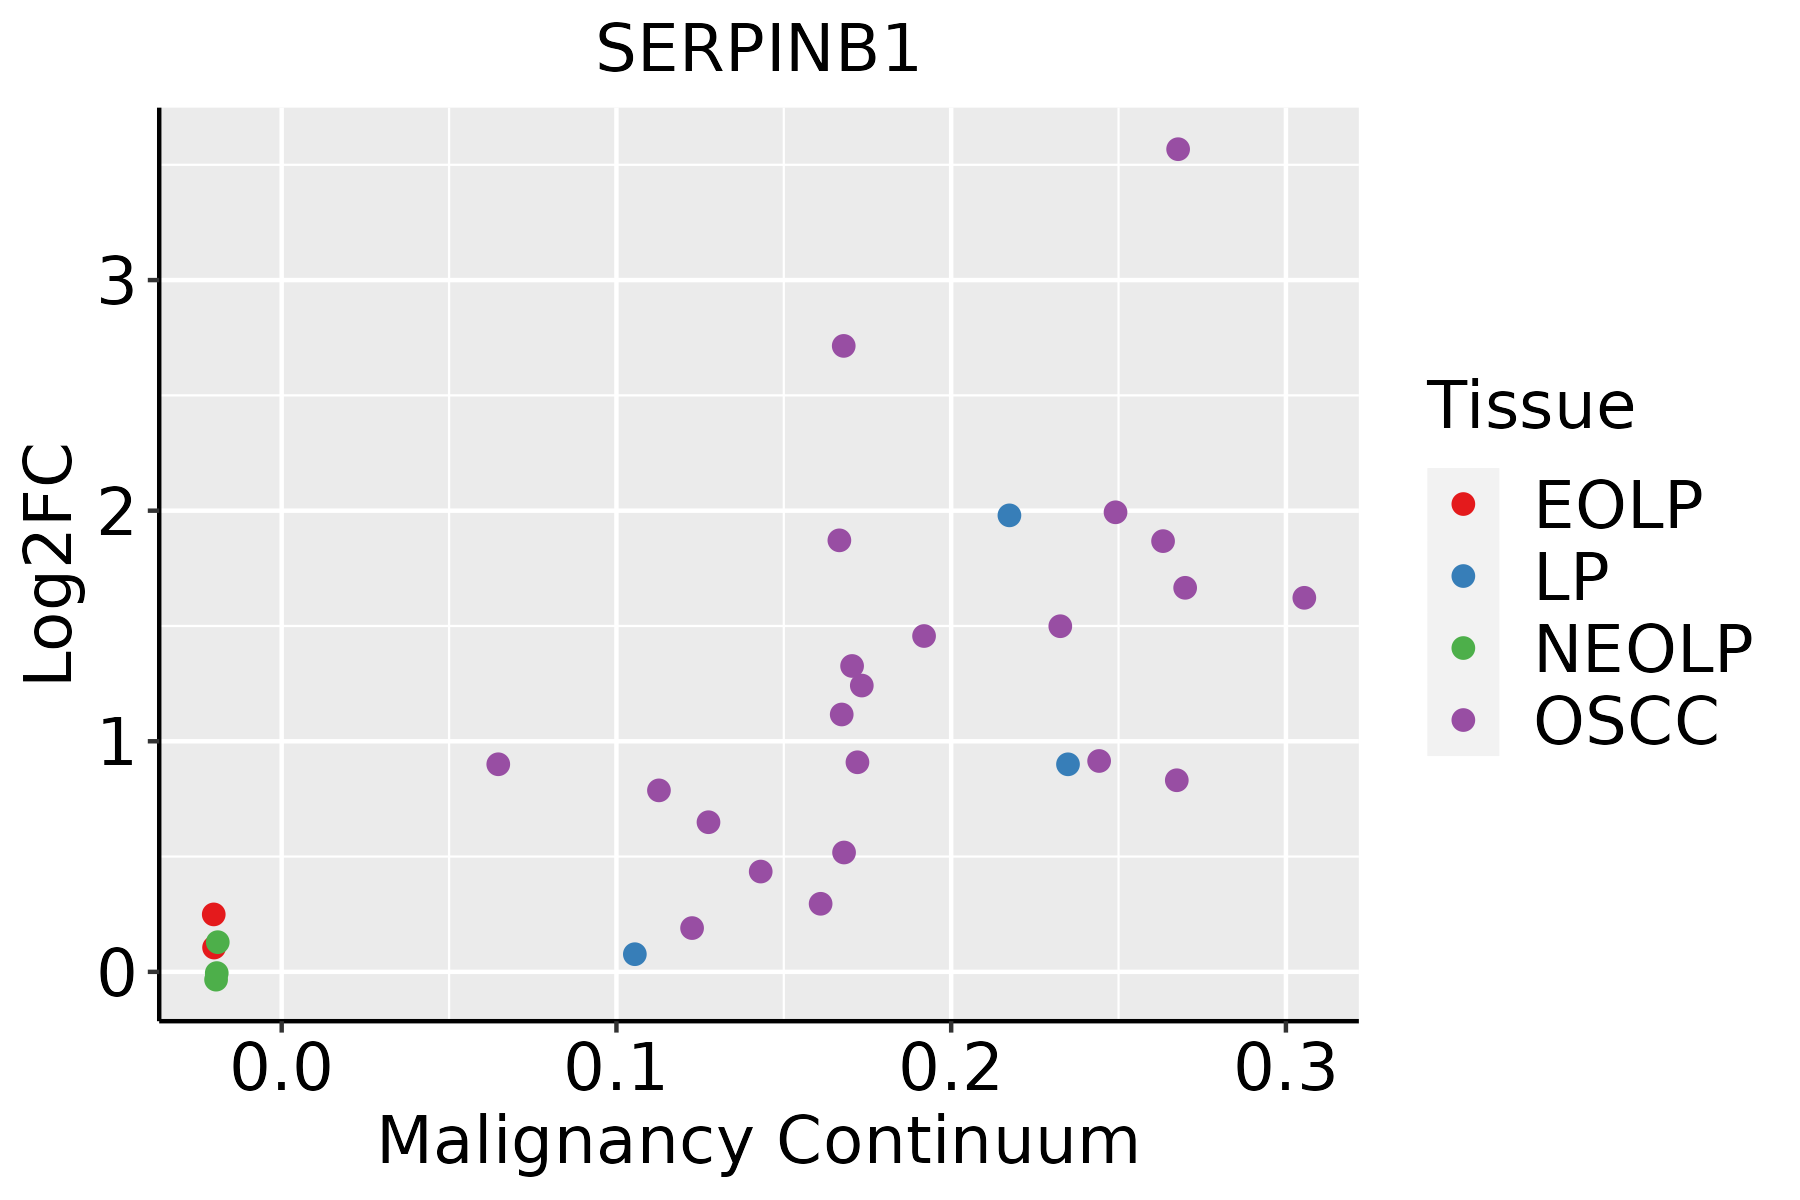 | EOLP: Erosive Oral lichen planus |
| LP: leukoplakia |
| NEOLP: Non-erosive oral lichen planus |
| OSCC: Oral squamous cell carcinoma |
| Prostate | 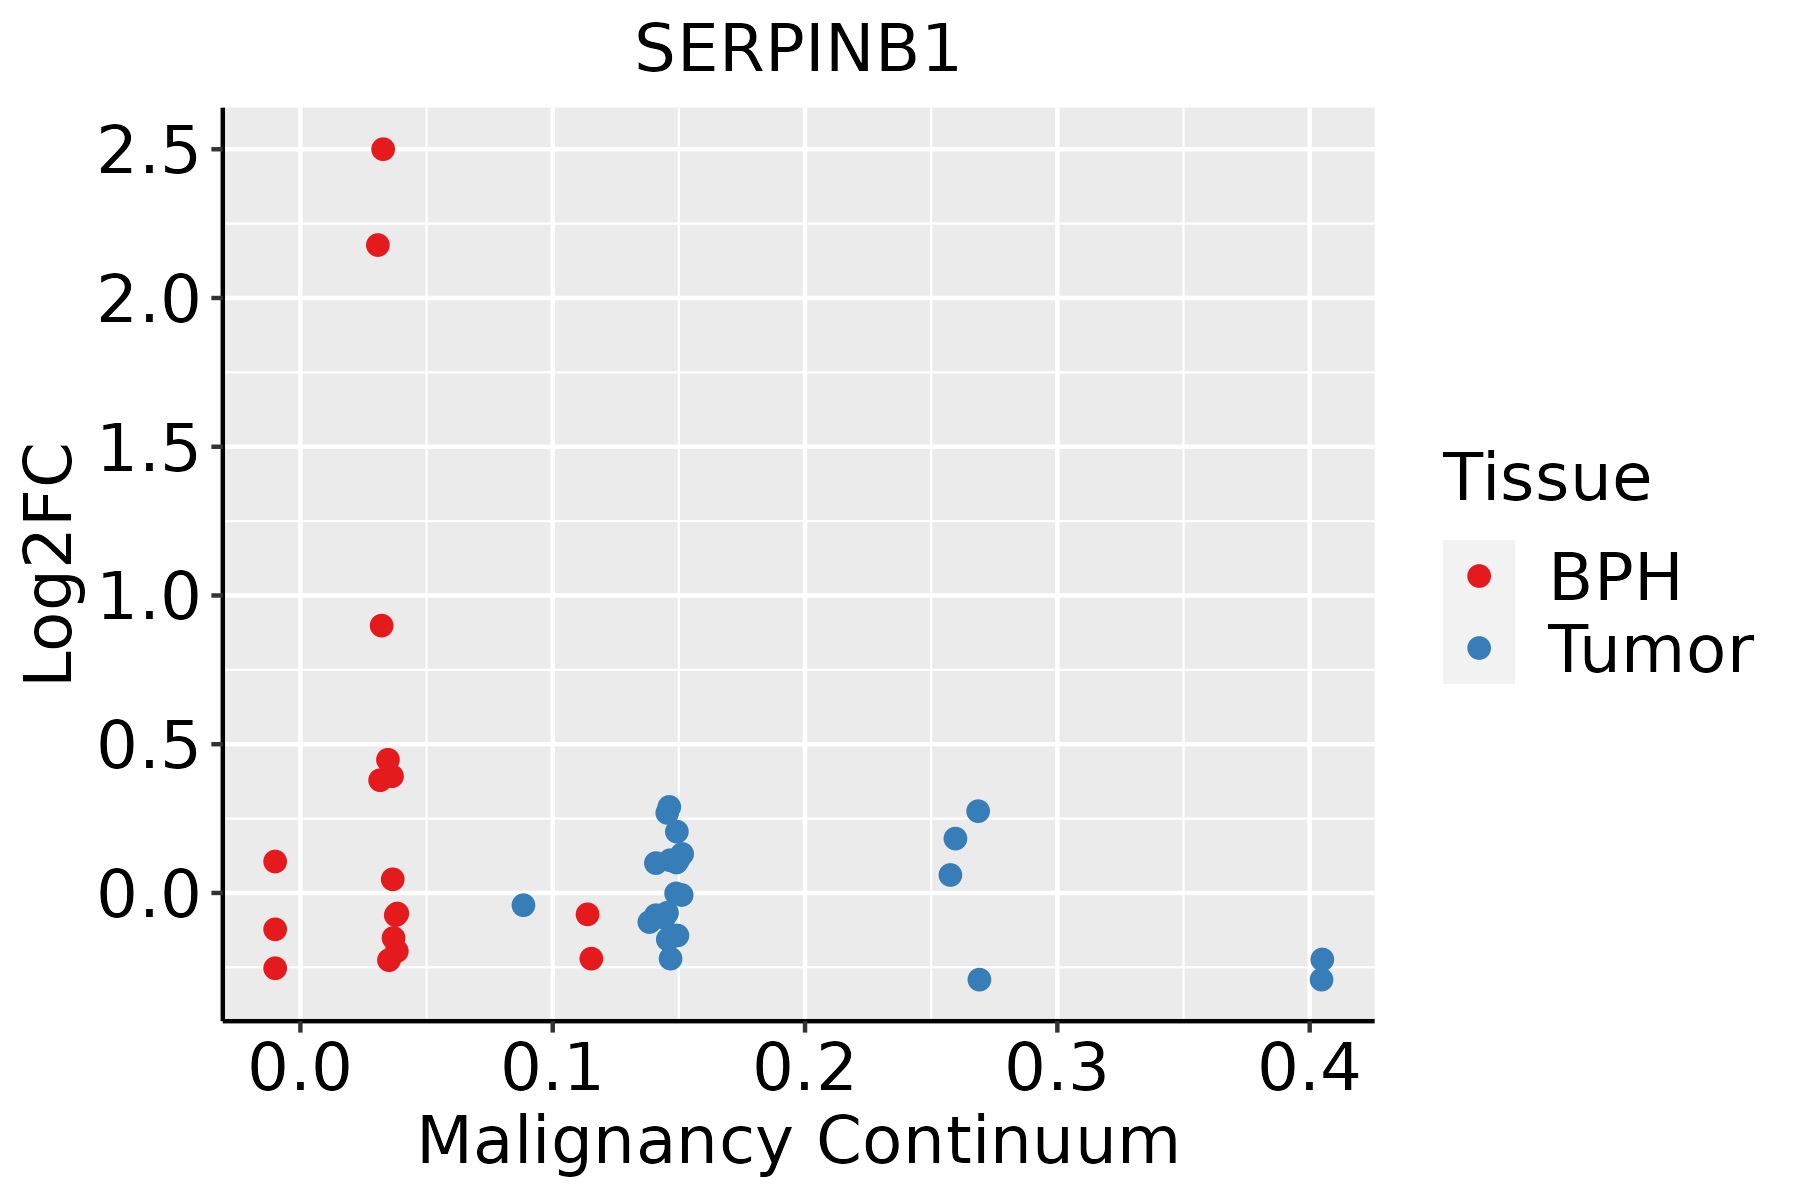 | BPH: Benign Prostatic Hyperplasia |
| Skin | 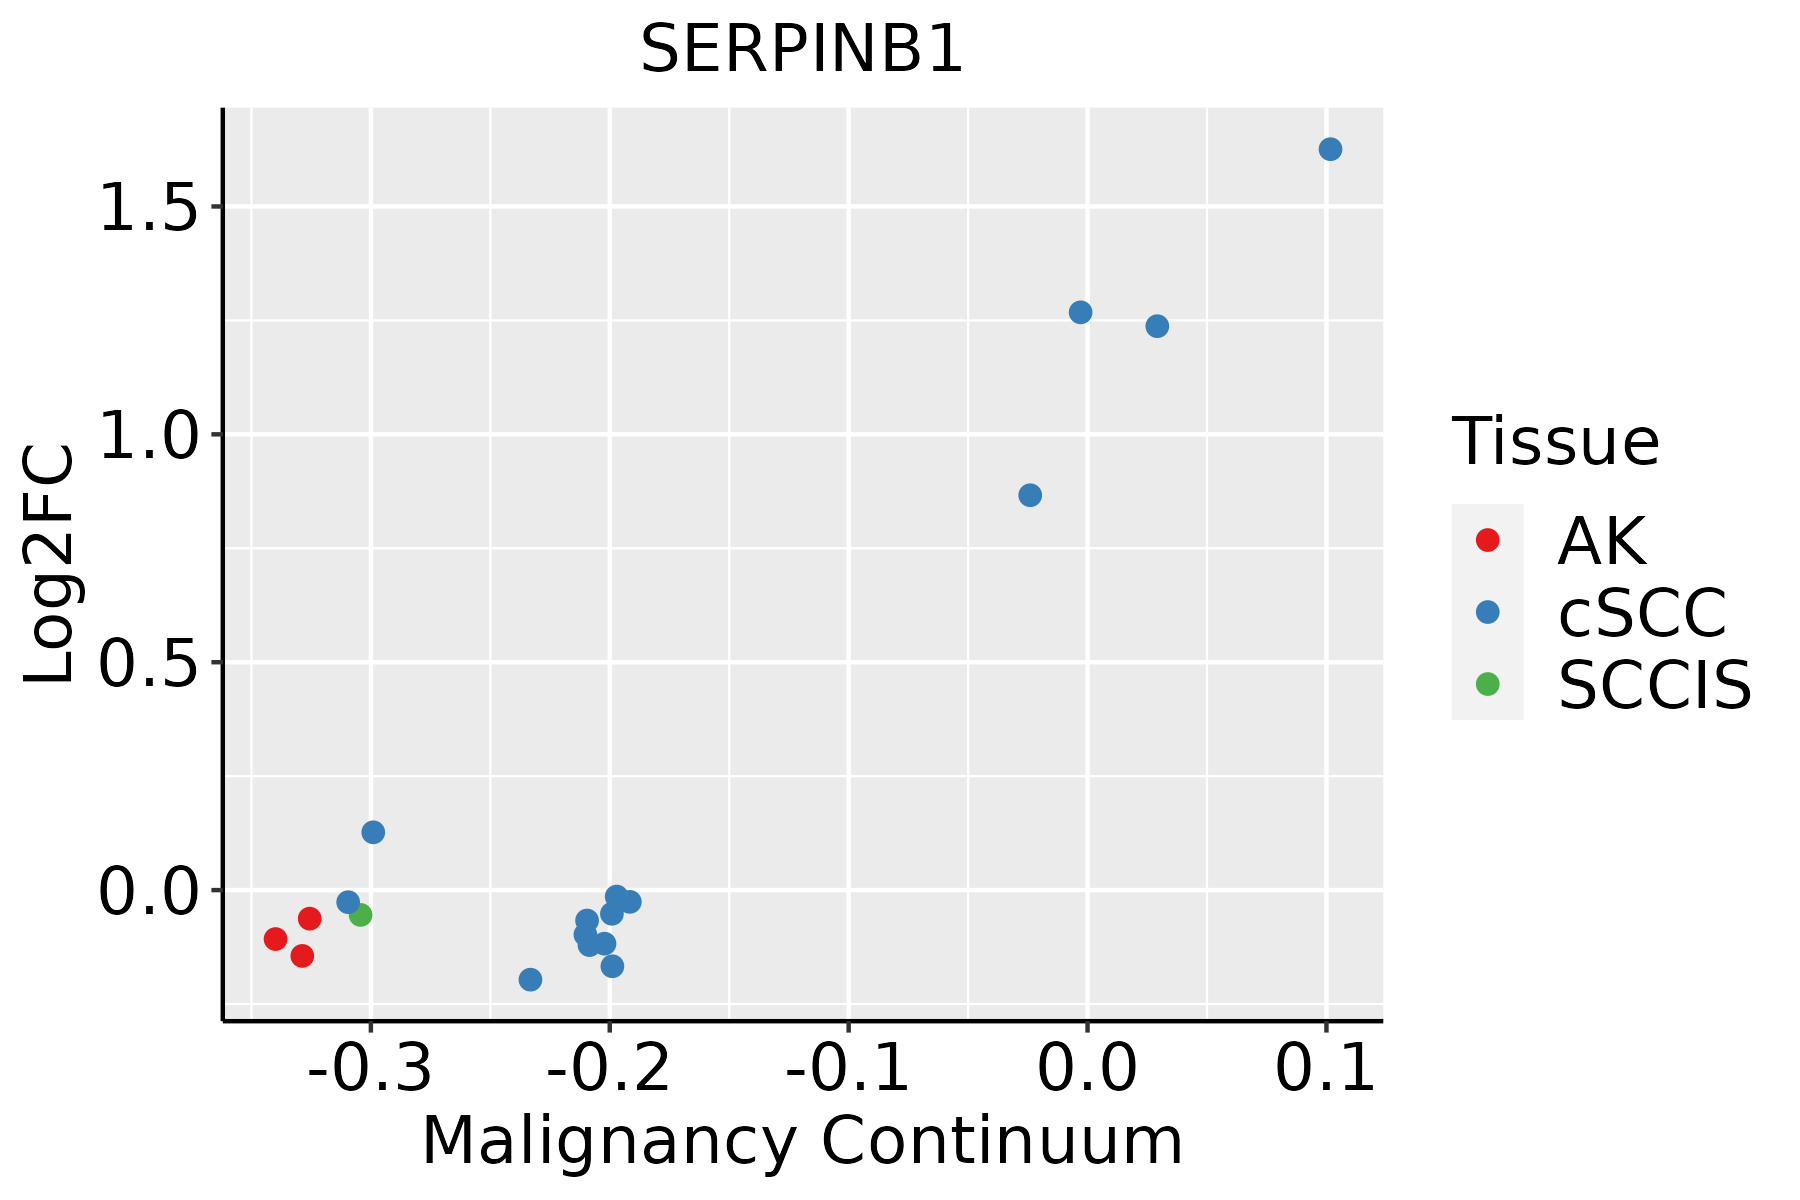 | AK: Actinic keratosis |
| cSCC: Cutaneous squamous cell carcinoma |
| SCCIS:squamous cell carcinoma in situ |
| Thyroid | 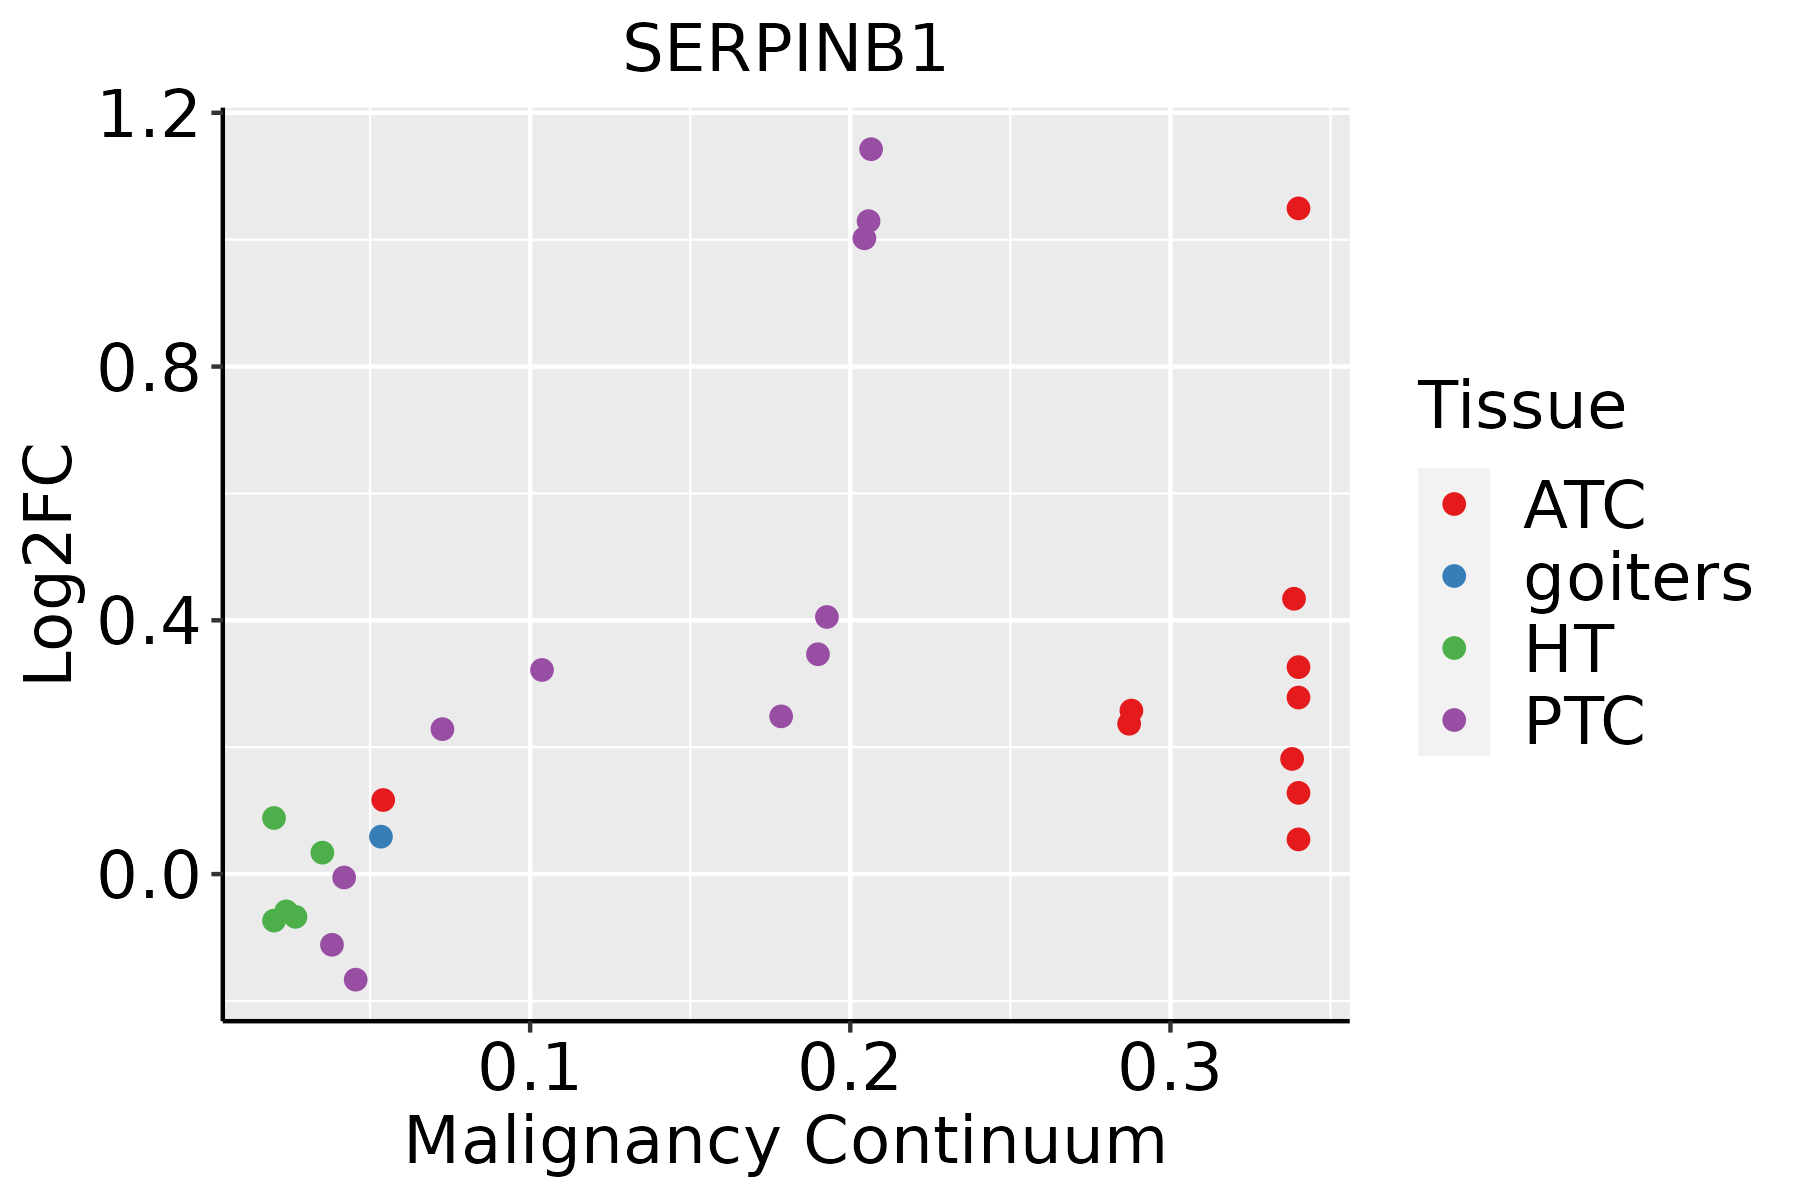 | ATC: Anaplastic thyroid cancer |
| HT: Hashimoto's thyroiditis |
| PTC: Papillary thyroid cancer |
| GO ID | Tissue | Disease Stage | Description | Gene Ratio | Bg Ratio | pvalue | p.adjust | Count |
| GO:005254710 | Cervix | CC | regulation of peptidase activity | 112/2311 | 461/18723 | 6.70e-13 | 3.08e-10 | 112 |
| GO:005254810 | Cervix | CC | regulation of endopeptidase activity | 103/2311 | 432/18723 | 1.89e-11 | 5.14e-09 | 103 |
| GO:00506737 | Cervix | CC | epithelial cell proliferation | 98/2311 | 437/18723 | 2.01e-09 | 2.15e-07 | 98 |
| GO:004586110 | Cervix | CC | negative regulation of proteolysis | 80/2311 | 351/18723 | 2.88e-08 | 1.98e-06 | 80 |
| GO:00513469 | Cervix | CC | negative regulation of hydrolase activity | 81/2311 | 379/18723 | 4.27e-07 | 1.67e-05 | 81 |
| GO:00104669 | Cervix | CC | negative regulation of peptidase activity | 60/2311 | 262/18723 | 1.27e-06 | 4.34e-05 | 60 |
| GO:001095110 | Cervix | CC | negative regulation of endopeptidase activity | 56/2311 | 252/18723 | 7.43e-06 | 1.74e-04 | 56 |
| GO:00093149 | Cervix | CC | response to radiation | 86/2311 | 456/18723 | 3.50e-05 | 5.63e-04 | 86 |
| GO:00094112 | Cervix | CC | response to UV | 33/2311 | 149/18723 | 5.51e-04 | 5.29e-03 | 33 |
| GO:19040194 | Cervix | CC | epithelial cell apoptotic process | 27/2311 | 121/18723 | 1.49e-03 | 1.16e-02 | 27 |
| GO:00094163 | Cervix | CC | response to light stimulus | 54/2311 | 320/18723 | 1.03e-02 | 4.97e-02 | 54 |
| GO:0052547 | Colorectum | AD | regulation of peptidase activity | 137/3918 | 461/18723 | 4.12e-06 | 1.12e-04 | 137 |
| GO:0045861 | Colorectum | AD | negative regulation of proteolysis | 106/3918 | 351/18723 | 2.33e-05 | 4.57e-04 | 106 |
| GO:0052548 | Colorectum | AD | regulation of endopeptidase activity | 124/3918 | 432/18723 | 6.58e-05 | 1.07e-03 | 124 |
| GO:0050673 | Colorectum | AD | epithelial cell proliferation | 119/3918 | 437/18723 | 8.75e-04 | 8.51e-03 | 119 |
| GO:00525471 | Colorectum | SER | regulation of peptidase activity | 114/2897 | 461/18723 | 1.18e-07 | 7.17e-06 | 114 |
| GO:00458611 | Colorectum | SER | negative regulation of proteolysis | 88/2897 | 351/18723 | 1.74e-06 | 7.50e-05 | 88 |
| GO:00525481 | Colorectum | SER | regulation of endopeptidase activity | 103/2897 | 432/18723 | 2.86e-06 | 1.16e-04 | 103 |
| GO:0051346 | Colorectum | SER | negative regulation of hydrolase activity | 82/2897 | 379/18723 | 8.19e-04 | 1.01e-02 | 82 |
| GO:0010466 | Colorectum | SER | negative regulation of peptidase activity | 57/2897 | 262/18723 | 4.15e-03 | 3.38e-02 | 57 |
| Hugo Symbol | Variant Class | Variant Classification | dbSNP RS | HGVSc | HGVSp | HGVSp Short | SWISSPROT | BIOTYPE | SIFT | PolyPhen | Tumor Sample Barcode | Tissue | Histology | Sex | Age | Stage | Therapy Types | Drugs | Outcome |
| SERPINB1 | SNV | Missense_Mutation | rs757989972 | c.1094N>G | p.Asn365Ser | p.N365S | P30740 | protein_coding | tolerated(0.07) | benign(0.355) | TCGA-A1-A0SH-01 | Breast | breast invasive carcinoma | Female | <65 | I/II | Chemotherapy | tc | SD |
| SERPINB1 | SNV | Missense_Mutation | | c.119N>G | p.Ala40Gly | p.A40G | P30740 | protein_coding | deleterious(0.05) | benign(0.068) | TCGA-C8-A27B-01 | Breast | breast invasive carcinoma | Female | <65 | I/II | Chemotherapy | 5-fluorouracil | CR |
| SERPINB1 | SNV | Missense_Mutation | | c.105N>G | p.Ile35Met | p.I35M | P30740 | protein_coding | deleterious(0.02) | possibly_damaging(0.597) | TCGA-D8-A1XQ-01 | Breast | breast invasive carcinoma | Female | >=65 | I/II | Unknown | Unknown | SD |
| SERPINB1 | insertion | In_Frame_Ins | novel | c.668_669insATTGTTTTA | p.Gly223_Glu224insLeuPheTyr | p.G223_E224insLFY | P30740 | protein_coding | | | TCGA-A8-A0A4-01 | Breast | breast invasive carcinoma | Female | >=65 | I/II | Hormone Therapy | tamoxiphen | CR |
| SERPINB1 | deletion | Frame_Shift_Del | | c.1021delN | p.Ala341GlnfsTer6 | p.A341Qfs*6 | P30740 | protein_coding | | | TCGA-D8-A27V-01 | Breast | breast invasive carcinoma | Female | <65 | I/II | Hormone Therapy | tamoxiphen | SD |
| SERPINB1 | SNV | Missense_Mutation | rs752211279 | c.869G>A | p.Arg290His | p.R290H | P30740 | protein_coding | tolerated(0.2) | benign(0.007) | TCGA-2W-A8YY-01 | Cervix | cervical & endocervical cancer | Female | <65 | I/II | Chemotherapy | cisplatin | CR |
| SERPINB1 | SNV | Missense_Mutation | | c.703N>A | p.Asp235Asn | p.D235N | P30740 | protein_coding | tolerated(0.11) | benign(0.04) | TCGA-C5-A7X3-01 | Cervix | cervical & endocervical cancer | Female | >=65 | III/IV | Chemotherapy | cisplatin | SD |
| SERPINB1 | SNV | Missense_Mutation | | c.1063N>A | p.Asp355Asn | p.D355N | P30740 | protein_coding | tolerated(0.08) | possibly_damaging(0.503) | TCGA-F4-6704-01 | Colorectum | colon adenocarcinoma | Male | <65 | III/IV | Unknown | Unknown | SD |
| SERPINB1 | deletion | Frame_Shift_Del | | c.608_609delNN | p.Lys203IlefsTer10 | p.K203Ifs*10 | P30740 | protein_coding | | | TCGA-D5-6530-01 | Colorectum | colon adenocarcinoma | Male | <65 | I/II | Unknown | Unknown | SD |
| SERPINB1 | SNV | Missense_Mutation | rs775777099 | c.34N>A | p.Ala12Thr | p.A12T | P30740 | protein_coding | tolerated(0.13) | benign(0.293) | TCGA-A5-A0G1-01 | Endometrium | uterine corpus endometrioid carcinoma | Female | >=65 | I/II | Unknown | Unknown | SD |


