
|
|||||
|
 | |
| |
| |
| |
| |
| |
|
Gene: SERPINA7 |
Gene summary for SERPINA7 |
| Gene information | Species | Human | Gene symbol | SERPINA7 | Gene ID | 6906 |
| Gene name | serpin family A member 7 | |
| Gene Alias | TBG | |
| Cytomap | Xq22.3 | |
| Gene Type | protein-coding | GO ID | GO:0006508 | UniProtAcc | P05543 |
Top |
Malignant transformation analysis |
| Identification of the aberrant gene expression in precancerous and cancerous lesions by comparing the gene expression of stem-like cells in diseased tissues with normal stem cells |
| Entrez ID | Symbol | Replicates | Species | Organ | Tissue | Adj P-value | Log2FC | Malignancy |
| 6906 | SERPINA7 | HCC1_Meng | Human | Liver | HCC | 8.26e-19 | -1.39e-02 | 0.0246 |
| 6906 | SERPINA7 | HCC2 | Human | Liver | HCC | 1.94e-03 | 2.84e+00 | 0.5341 |
| 6906 | SERPINA7 | Pt14.a | Human | Liver | HCC | 4.80e-03 | 2.15e-01 | 0.0169 |
| 6906 | SERPINA7 | S014 | Human | Liver | HCC | 1.22e-02 | 2.68e-01 | 0.2254 |
| 6906 | SERPINA7 | S029 | Human | Liver | HCC | 1.63e-06 | 5.92e-01 | 0.2581 |
| Page: 1 |
| Tissue | Expression Dynamics | Abbreviation |
| Liver | 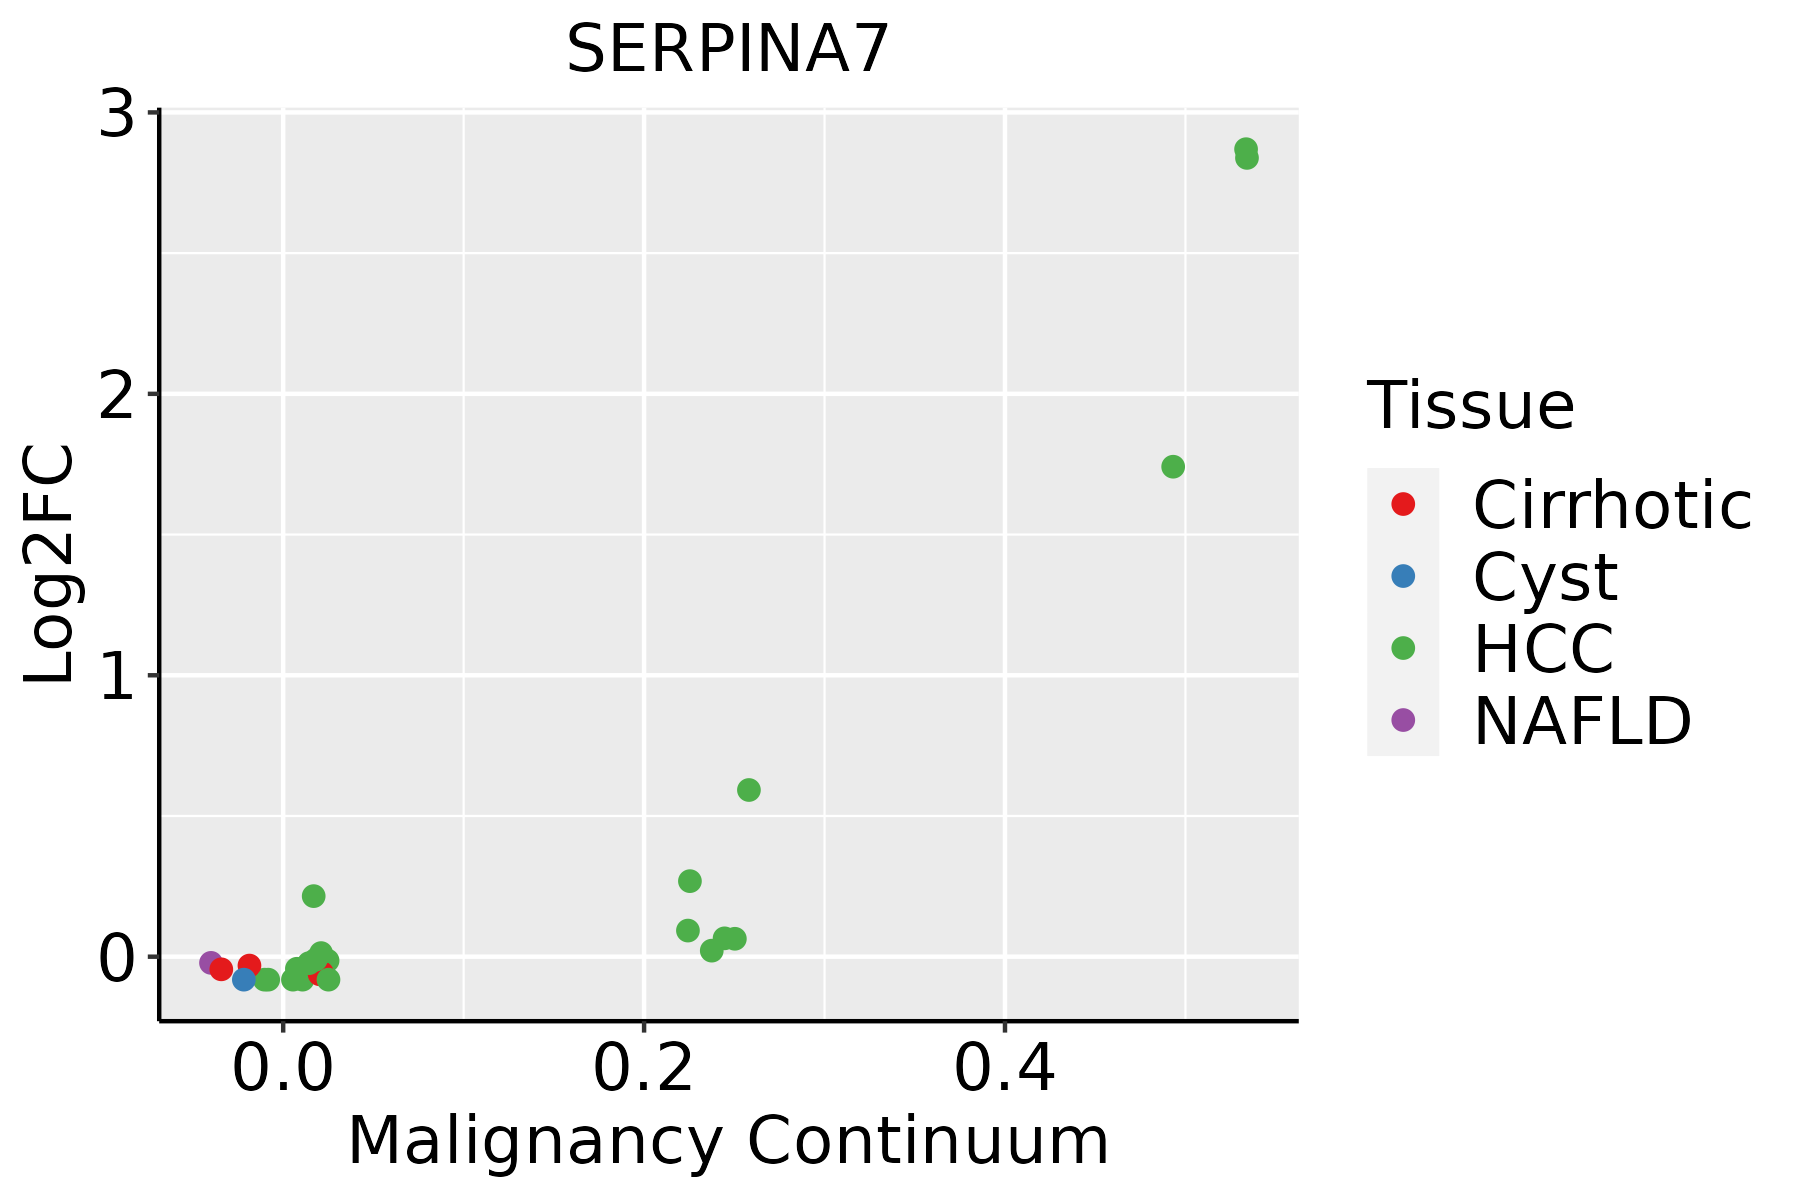 | HCC: Hepatocellular carcinoma |
| NAFLD: Non-alcoholic fatty liver disease |
| ∗log2FC in expression of this searched gene in stem-like cells from each diseased tissue sample relative to stem-like cells in normal samples in each tissue plotted against the malignancy continuum. Samples are colored based on if they are from different disease stage. |
Top |
Malignant transformation related pathway analysis |
| Find out the enriched GO biological processes and KEGG pathways involved in transition from healthy to precancer to cancer |
| Tissue | Disease Stage | Enriched GO biological Processes |
| Colorectum | AD |  |
| Colorectum | SER |  |
| Colorectum | MSS |  |
| Colorectum | MSI-H |  |
| Colorectum | FAP |  |
| ∗Top 15 enriched GO BP terms are showed in the bar plot of each disease state in each tissue. Each row represents a significant GO biological process which is colored according to the -log10(p.adjust). |
| Page: 1 2 3 4 5 6 7 8 9 |
| GO ID | Tissue | Disease Stage | Description | Gene Ratio | Bg Ratio | pvalue | p.adjust | Count |
| GO:005254722 | Liver | HCC | regulation of peptidase activity | 247/7958 | 461/18723 | 8.28e-07 | 1.27e-05 | 247 |
| GO:005254822 | Liver | HCC | regulation of endopeptidase activity | 230/7958 | 432/18723 | 3.58e-06 | 4.68e-05 | 230 |
| GO:004586122 | Liver | HCC | negative regulation of proteolysis | 186/7958 | 351/18723 | 4.19e-05 | 4.11e-04 | 186 |
| GO:005134622 | Liver | HCC | negative regulation of hydrolase activity | 195/7958 | 379/18723 | 2.44e-04 | 1.82e-03 | 195 |
| GO:001095121 | Liver | HCC | negative regulation of endopeptidase activity | 129/7958 | 252/18723 | 3.17e-03 | 1.47e-02 | 129 |
| GO:001046621 | Liver | HCC | negative regulation of peptidase activity | 132/7958 | 262/18723 | 5.82e-03 | 2.42e-02 | 132 |
| Page: 1 |
| Pathway ID | Tissue | Disease Stage | Description | Gene Ratio | Bg Ratio | pvalue | p.adjust | qvalue | Count |
| Page: 1 |
Top |
Cell-cell communication analysis |
| Identification of potential cell-cell interactions between two cell types and their ligand-receptor pairs for different disease states |
| Ligand | Receptor | LRpair | Pathway | Tissue | Disease Stage |
| Page: 1 |
Top |
Single-cell gene regulatory network inference analysis |
| Find out the significant the regulons (TFs) and the target genes of each regulon across cell types for different disease states |
| TF | Cell Type | Tissue | Disease Stage | Target Gene | RSS | Regulon Activity |
| ∗The dot plots of a searched regulon are shown for all cell subpopulations in each disease state of each tissue based on the regulon specific score inferred using pySCENIC and by calculating the average expression. |
| Page: 1 |
Top |
Somatic mutation of malignant transformation related genes |
| Annotation of somatic variants for genes involved in malignant transformation |
| Hugo Symbol | Variant Class | Variant Classification | dbSNP RS | HGVSc | HGVSp | HGVSp Short | SWISSPROT | BIOTYPE | SIFT | PolyPhen | Tumor Sample Barcode | Tissue | Histology | Sex | Age | Stage | Therapy Types | Drugs | Outcome |
| SERPINA7 | SNV | Missense_Mutation | c.1037N>A | p.Leu346His | p.L346H | P05543 | protein_coding | deleterious(0) | probably_damaging(0.994) | TCGA-A7-A26F-01 | Breast | breast invasive carcinoma | Female | <65 | I/II | Chemotherapy | taxotere | SD | |
| SERPINA7 | SNV | Missense_Mutation | novel | c.438C>A | p.Phe146Leu | p.F146L | P05543 | protein_coding | deleterious(0) | possibly_damaging(0.887) | TCGA-AN-A046-01 | Breast | breast invasive carcinoma | Female | >=65 | I/II | Unknown | Unknown | SD |
| SERPINA7 | SNV | Missense_Mutation | novel | c.340C>T | p.His114Tyr | p.H114Y | P05543 | protein_coding | tolerated(0.16) | benign(0.021) | TCGA-AR-A0TU-01 | Breast | breast invasive carcinoma | Female | <65 | I/II | Unspecific | Doxorubicin | SD |
| SERPINA7 | SNV | Missense_Mutation | c.832N>C | p.Glu278Gln | p.E278Q | P05543 | protein_coding | deleterious(0.04) | benign(0.03) | TCGA-E9-A1RH-01 | Breast | breast invasive carcinoma | Female | <65 | I/II | Chemotherapy | 5-fluorouracil | SD | |
| SERPINA7 | insertion | Frame_Shift_Ins | novel | c.446_447insGATGTTCATACCAT | p.Asp149GlufsTer45 | p.D149Efs*45 | P05543 | protein_coding | TCGA-AR-A0TU-01 | Breast | breast invasive carcinoma | Female | <65 | I/II | Unspecific | Doxorubicin | SD | ||
| SERPINA7 | insertion | Frame_Shift_Ins | novel | c.337_338insCA | p.Gln113ProfsTer4 | p.Q113Pfs*4 | P05543 | protein_coding | TCGA-AR-A0TU-01 | Breast | breast invasive carcinoma | Female | <65 | I/II | Unspecific | Doxorubicin | SD | ||
| SERPINA7 | SNV | Missense_Mutation | c.1219G>T | p.Gly407Trp | p.G407W | P05543 | protein_coding | deleterious(0) | probably_damaging(1) | TCGA-C5-A2LX-01 | Cervix | cervical & endocervical cancer | Female | <65 | I/II | Chemotherapy | cisplatin | SD | |
| SERPINA7 | SNV | Missense_Mutation | rs375380232 | c.881G>A | p.Arg294His | p.R294H | P05543 | protein_coding | tolerated(0.76) | benign(0.006) | TCGA-FU-A40J-01 | Cervix | cervical & endocervical cancer | Female | <65 | III/IV | Chemotherapy | carboplatin | CR |
| SERPINA7 | SNV | Missense_Mutation | novel | c.1166N>C | p.Arg389Thr | p.R389T | P05543 | protein_coding | deleterious(0) | probably_damaging(0.996) | TCGA-MA-AA42-01 | Cervix | cervical & endocervical cancer | Female | >=65 | I/II | Unknown | Unknown | SD |
| SERPINA7 | SNV | Missense_Mutation | novel | c.192G>C | p.Lys64Asn | p.K64N | P05543 | protein_coding | deleterious(0.02) | benign(0.267) | TCGA-VS-A9UI-01 | Cervix | cervical & endocervical cancer | Female | >=65 | I/II | Unknown | Unknown | SD |
| Page: 1 2 3 4 5 6 7 8 9 |
Top |
Related drugs of malignant transformation related genes |
| Identification of chemicals and drugs interact with genes involved in malignant transfromation |
| (DGIdb 4.0) |
| Entrez ID | Symbol | Category | Interaction Types | Drug Claim Name | Drug Name | PMIDs |
| Page: 1 |

Copyright 2023-Present -The University of Texas Health Science Center at Houston |