
|
|||||
|
 | |
| |
| |
| |
| |
| |
|
Gene: SERPINA4 |
Gene summary for SERPINA4 |
| Gene information | Species | Human | Gene symbol | SERPINA4 | Gene ID | 5267 |
| Gene name | serpin family A member 4 | |
| Gene Alias | KAL | |
| Cytomap | 14q32.13 | |
| Gene Type | protein-coding | GO ID | GO:0006508 | UniProtAcc | P29622 |
Top |
Malignant transformation analysis |
| Identification of the aberrant gene expression in precancerous and cancerous lesions by comparing the gene expression of stem-like cells in diseased tissues with normal stem cells |
| Entrez ID | Symbol | Replicates | Species | Organ | Tissue | Adj P-value | Log2FC | Malignancy |
| 5267 | SERPINA4 | S43 | Human | Liver | Cirrhotic | 3.68e-10 | -2.78e-01 | -0.0187 |
| 5267 | SERPINA4 | HCC1_Meng | Human | Liver | HCC | 4.48e-84 | -1.67e-01 | 0.0246 |
| 5267 | SERPINA4 | HCC2_Meng | Human | Liver | HCC | 4.39e-25 | -3.58e-01 | 0.0107 |
| 5267 | SERPINA4 | cirrhotic1 | Human | Liver | Cirrhotic | 9.03e-23 | 4.27e-01 | 0.0202 |
| 5267 | SERPINA4 | cirrhotic2 | Human | Liver | Cirrhotic | 2.97e-36 | 4.01e-01 | 0.0201 |
| 5267 | SERPINA4 | cirrhotic3 | Human | Liver | Cirrhotic | 1.57e-10 | 1.39e-01 | 0.0215 |
| 5267 | SERPINA4 | HCC5 | Human | Liver | HCC | 1.10e-07 | 3.20e-02 | 0.4932 |
| 5267 | SERPINA4 | Pt13.a | Human | Liver | HCC | 9.08e-14 | -5.02e-01 | 0.021 |
| 5267 | SERPINA4 | Pt13.b | Human | Liver | HCC | 1.08e-08 | -4.84e-01 | 0.0251 |
| 5267 | SERPINA4 | Pt13.c | Human | Liver | HCC | 3.47e-06 | -5.24e-01 | 0.0076 |
| 5267 | SERPINA4 | Pt14.a | Human | Liver | HCC | 1.76e-04 | 1.30e-01 | 0.0169 |
| 5267 | SERPINA4 | Pt14.b | Human | Liver | HCC | 6.00e-06 | -1.50e-01 | 0.018 |
| 5267 | SERPINA4 | Pt14.d | Human | Liver | HCC | 3.28e-03 | -2.66e-01 | 0.0143 |
| 5267 | SERPINA4 | S016 | Human | Liver | HCC | 2.38e-05 | -4.72e-01 | 0.2243 |
| Page: 1 |
| Tissue | Expression Dynamics | Abbreviation |
| Liver | 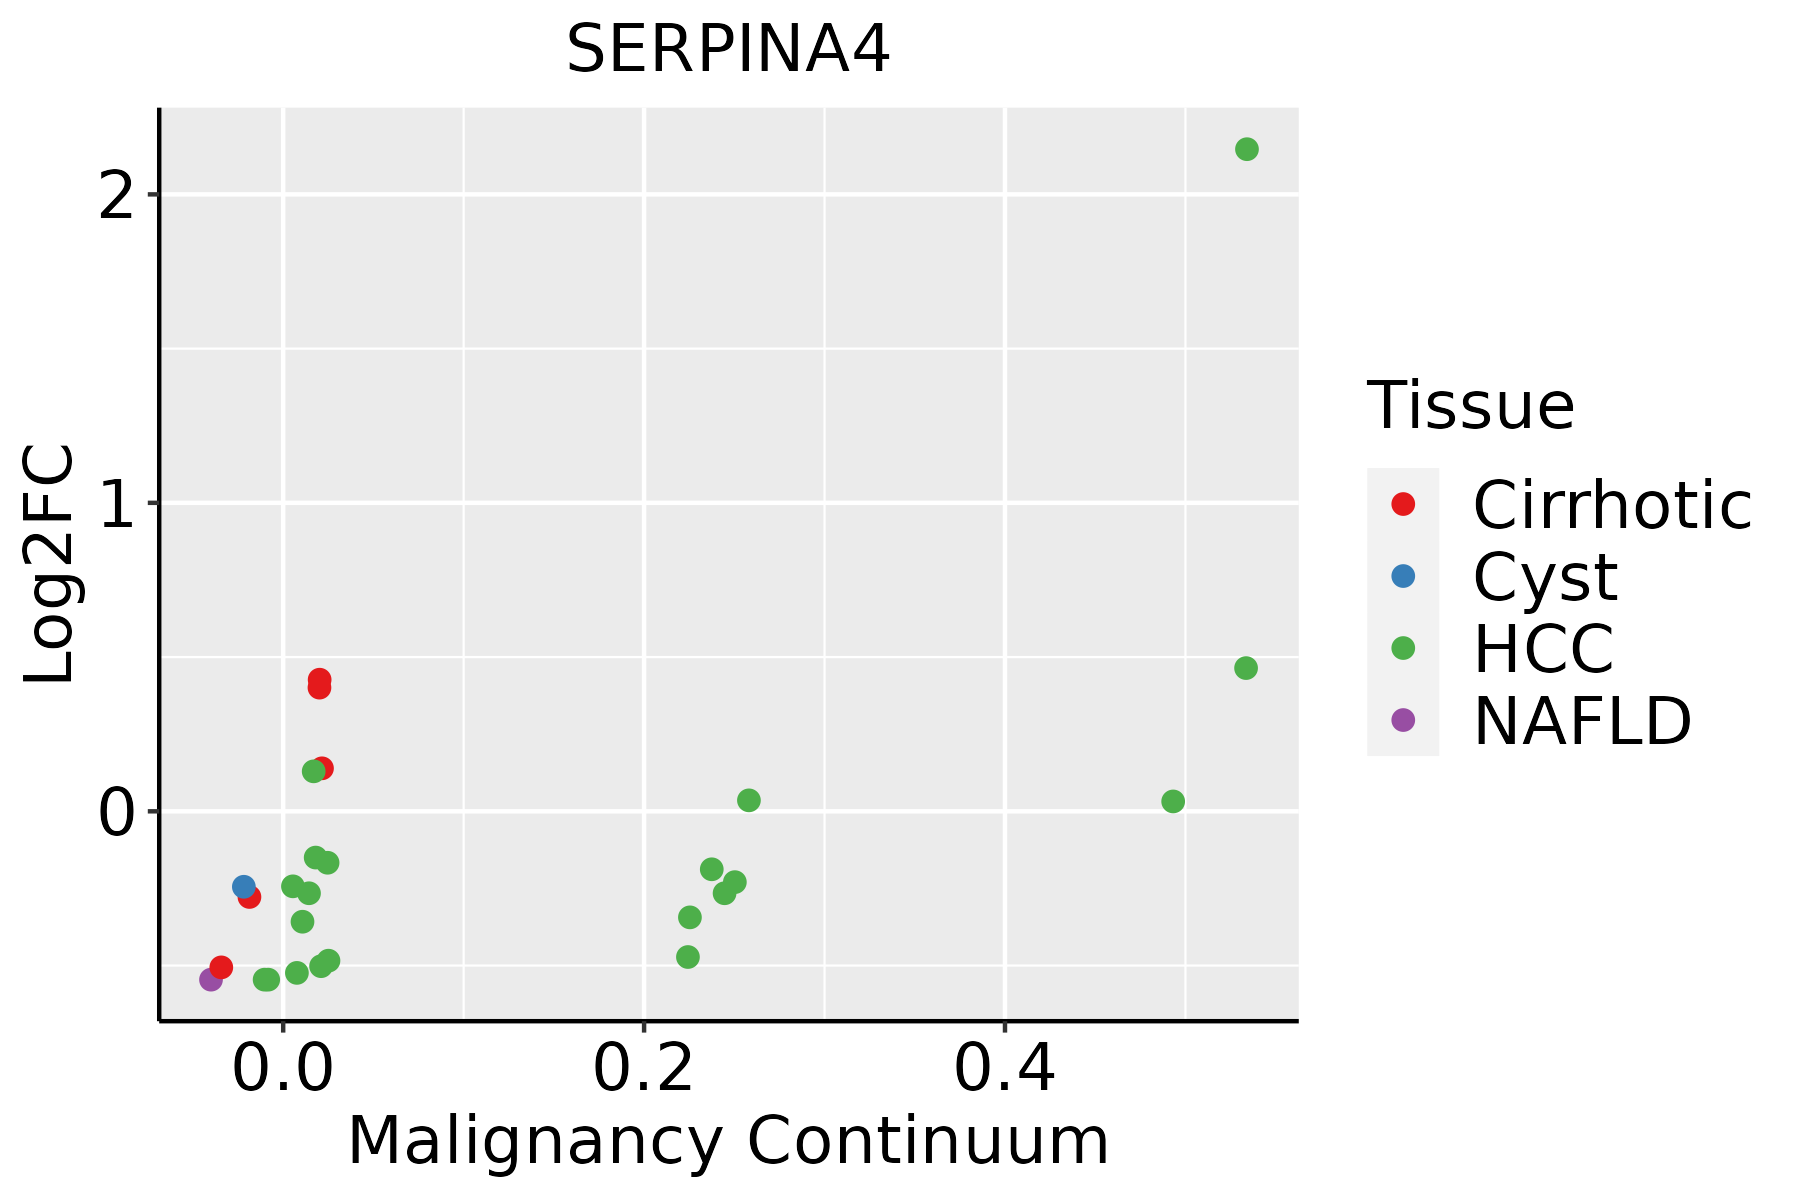 | HCC: Hepatocellular carcinoma |
| NAFLD: Non-alcoholic fatty liver disease |
| ∗log2FC in expression of this searched gene in stem-like cells from each diseased tissue sample relative to stem-like cells in normal samples in each tissue plotted against the malignancy continuum. Samples are colored based on if they are from different disease stage. |
Top |
Malignant transformation related pathway analysis |
| Find out the enriched GO biological processes and KEGG pathways involved in transition from healthy to precancer to cancer |
| Tissue | Disease Stage | Enriched GO biological Processes |
| Colorectum | AD |  |
| Colorectum | SER |  |
| Colorectum | MSS |  |
| Colorectum | MSI-H |  |
| Colorectum | FAP |  |
| ∗Top 15 enriched GO BP terms are showed in the bar plot of each disease state in each tissue. Each row represents a significant GO biological process which is colored according to the -log10(p.adjust). |
| Page: 1 2 3 4 5 6 7 8 9 |
| GO ID | Tissue | Disease Stage | Description | Gene Ratio | Bg Ratio | pvalue | p.adjust | Count |
| GO:005254712 | Liver | Cirrhotic | regulation of peptidase activity | 185/4634 | 461/18723 | 1.32e-13 | 1.09e-11 | 185 |
| GO:005254812 | Liver | Cirrhotic | regulation of endopeptidase activity | 172/4634 | 432/18723 | 2.12e-12 | 1.58e-10 | 172 |
| GO:004586112 | Liver | Cirrhotic | negative regulation of proteolysis | 136/4634 | 351/18723 | 3.46e-09 | 1.42e-07 | 136 |
| GO:005134612 | Liver | Cirrhotic | negative regulation of hydrolase activity | 139/4634 | 379/18723 | 1.24e-07 | 3.42e-06 | 139 |
| GO:001095111 | Liver | Cirrhotic | negative regulation of endopeptidase activity | 98/4634 | 252/18723 | 4.19e-07 | 9.77e-06 | 98 |
| GO:001046612 | Liver | Cirrhotic | negative regulation of peptidase activity | 100/4634 | 262/18723 | 8.90e-07 | 1.84e-05 | 100 |
| GO:005254722 | Liver | HCC | regulation of peptidase activity | 247/7958 | 461/18723 | 8.28e-07 | 1.27e-05 | 247 |
| GO:005254822 | Liver | HCC | regulation of endopeptidase activity | 230/7958 | 432/18723 | 3.58e-06 | 4.68e-05 | 230 |
| GO:004586122 | Liver | HCC | negative regulation of proteolysis | 186/7958 | 351/18723 | 4.19e-05 | 4.11e-04 | 186 |
| GO:005134622 | Liver | HCC | negative regulation of hydrolase activity | 195/7958 | 379/18723 | 2.44e-04 | 1.82e-03 | 195 |
| GO:001095121 | Liver | HCC | negative regulation of endopeptidase activity | 129/7958 | 252/18723 | 3.17e-03 | 1.47e-02 | 129 |
| GO:001046621 | Liver | HCC | negative regulation of peptidase activity | 132/7958 | 262/18723 | 5.82e-03 | 2.42e-02 | 132 |
| Page: 1 |
| Pathway ID | Tissue | Disease Stage | Description | Gene Ratio | Bg Ratio | pvalue | p.adjust | qvalue | Count |
| Page: 1 |
Top |
Cell-cell communication analysis |
| Identification of potential cell-cell interactions between two cell types and their ligand-receptor pairs for different disease states |
| Ligand | Receptor | LRpair | Pathway | Tissue | Disease Stage |
| Page: 1 |
Top |
Single-cell gene regulatory network inference analysis |
| Find out the significant the regulons (TFs) and the target genes of each regulon across cell types for different disease states |
| TF | Cell Type | Tissue | Disease Stage | Target Gene | RSS | Regulon Activity |
| ∗The dot plots of a searched regulon are shown for all cell subpopulations in each disease state of each tissue based on the regulon specific score inferred using pySCENIC and by calculating the average expression. |
| Page: 1 |
Top |
Somatic mutation of malignant transformation related genes |
| Annotation of somatic variants for genes involved in malignant transformation |
| Hugo Symbol | Variant Class | Variant Classification | dbSNP RS | HGVSc | HGVSp | HGVSp Short | SWISSPROT | BIOTYPE | SIFT | PolyPhen | Tumor Sample Barcode | Tissue | Histology | Sex | Age | Stage | Therapy Types | Drugs | Outcome |
| SERPINA4 | SNV | Missense_Mutation | rs151234180 | c.248N>T | p.Ser83Leu | p.S83L | P29622 | protein_coding | deleterious(0) | probably_damaging(0.984) | TCGA-A2-A0YM-01 | Breast | breast invasive carcinoma | Female | >=65 | I/II | Unknown | Unknown | SD |
| SERPINA4 | SNV | Missense_Mutation | rs748691639 | c.550N>A | p.Asp184Asn | p.D184N | P29622 | protein_coding | tolerated(0.83) | benign(0.069) | TCGA-AO-A0JB-01 | Breast | breast invasive carcinoma | Female | <65 | III/IV | Chemotherapy | cyclophosphamide | SD |
| SERPINA4 | SNV | Missense_Mutation | rs373176783 | c.484G>A | p.Val162Ile | p.V162I | P29622 | protein_coding | tolerated(0.06) | benign(0.078) | TCGA-AO-A0JJ-01 | Breast | breast invasive carcinoma | Female | <65 | I/II | Chemotherapy | cyclophospamide | SD |
| SERPINA4 | SNV | Missense_Mutation | c.50T>A | p.Leu17His | p.L17H | P29622 | protein_coding | deleterious(0.03) | possibly_damaging(0.84) | TCGA-AR-A0TU-01 | Breast | breast invasive carcinoma | Female | <65 | I/II | Unspecific | Doxorubicin | SD | |
| SERPINA4 | insertion | Nonsense_Mutation | novel | c.610_611insGTTTGTAA | p.Asp204GlyfsTer3 | p.D204Gfs*3 | P29622 | protein_coding | TCGA-A8-A08H-01 | Breast | breast invasive carcinoma | Female | >=65 | I/II | Unknown | Unknown | SD | ||
| SERPINA4 | insertion | In_Frame_Ins | novel | c.612_613insCATATAAAGCACTCCACAGAT | p.Asp204_Val205insHisIleLysHisSerThrAsp | p.D204_V205insHIKHSTD | P29622 | protein_coding | TCGA-A8-A08H-01 | Breast | breast invasive carcinoma | Female | >=65 | I/II | Unknown | Unknown | SD | ||
| SERPINA4 | deletion | Frame_Shift_Del | novel | c.1057delN | p.Lys353AsnfsTer54 | p.K353Nfs*54 | P29622 | protein_coding | TCGA-D8-A27V-01 | Breast | breast invasive carcinoma | Female | <65 | I/II | Hormone Therapy | tamoxiphen | SD | ||
| SERPINA4 | SNV | Missense_Mutation | c.181C>T | p.Arg61Cys | p.R61C | P29622 | protein_coding | tolerated(0.1) | benign(0.397) | TCGA-EA-A5ZF-01 | Cervix | cervical & endocervical cancer | Female | <65 | I/II | Unknown | Unknown | PD | |
| SERPINA4 | SNV | Missense_Mutation | c.181C>T | p.Arg61Cys | p.R61C | P29622 | protein_coding | tolerated(0.1) | benign(0.397) | TCGA-EK-A2RK-01 | Cervix | cervical & endocervical cancer | Female | >=65 | I/II | Unknown | Unknown | SD | |
| SERPINA4 | SNV | Missense_Mutation | novel | c.1145N>C | p.Ser382Thr | p.S382T | P29622 | protein_coding | tolerated(0.57) | benign(0.034) | TCGA-ZJ-AAX8-01 | Cervix | cervical & endocervical cancer | Female | <65 | III/IV | Unknown | Unknown | SD |
| Page: 1 2 3 4 5 6 7 |
Top |
Related drugs of malignant transformation related genes |
| Identification of chemicals and drugs interact with genes involved in malignant transfromation |
| (DGIdb 4.0) |
| Entrez ID | Symbol | Category | Interaction Types | Drug Claim Name | Drug Name | PMIDs |
| Page: 1 |

Copyright 2023-Present -The University of Texas Health Science Center at Houston |