
|
|||||
|
 | |
| |
| |
| |
| |
| |
|
Gene: SERPINA10 |
Gene summary for SERPINA10 |
| Gene information | Species | Human | Gene symbol | SERPINA10 | Gene ID | 51156 |
| Gene name | serpin family A member 10 | |
| Gene Alias | PZI | |
| Cytomap | 14q32.13 | |
| Gene Type | protein-coding | GO ID | GO:0006508 | UniProtAcc | A0A024R6I6 |
Top |
Malignant transformation analysis |
| Identification of the aberrant gene expression in precancerous and cancerous lesions by comparing the gene expression of stem-like cells in diseased tissues with normal stem cells |
| Entrez ID | Symbol | Replicates | Species | Organ | Tissue | Adj P-value | Log2FC | Malignancy |
| 51156 | SERPINA10 | NAFLD1 | Human | Liver | NAFLD | 2.08e-03 | 3.26e-01 | -0.04 |
| 51156 | SERPINA10 | HCC1_Meng | Human | Liver | HCC | 5.85e-69 | 2.18e-01 | 0.0246 |
| 51156 | SERPINA10 | HCC2 | Human | Liver | HCC | 1.94e-08 | 2.63e+00 | 0.5341 |
| 51156 | SERPINA10 | Pt13.b | Human | Liver | HCC | 1.90e-02 | 1.07e-01 | 0.0251 |
| 51156 | SERPINA10 | Pt14.b | Human | Liver | HCC | 3.99e-03 | 2.35e-01 | 0.018 |
| 51156 | SERPINA10 | S014 | Human | Liver | HCC | 4.62e-25 | 9.12e-01 | 0.2254 |
| 51156 | SERPINA10 | S015 | Human | Liver | HCC | 1.85e-24 | 1.12e+00 | 0.2375 |
| 51156 | SERPINA10 | S016 | Human | Liver | HCC | 3.00e-26 | 9.27e-01 | 0.2243 |
| 51156 | SERPINA10 | S028 | Human | Liver | HCC | 1.07e-07 | 4.42e-01 | 0.2503 |
| 51156 | SERPINA10 | S029 | Human | Liver | HCC | 1.49e-15 | 6.40e-01 | 0.2581 |
| Page: 1 |
| Tissue | Expression Dynamics | Abbreviation |
| Liver | 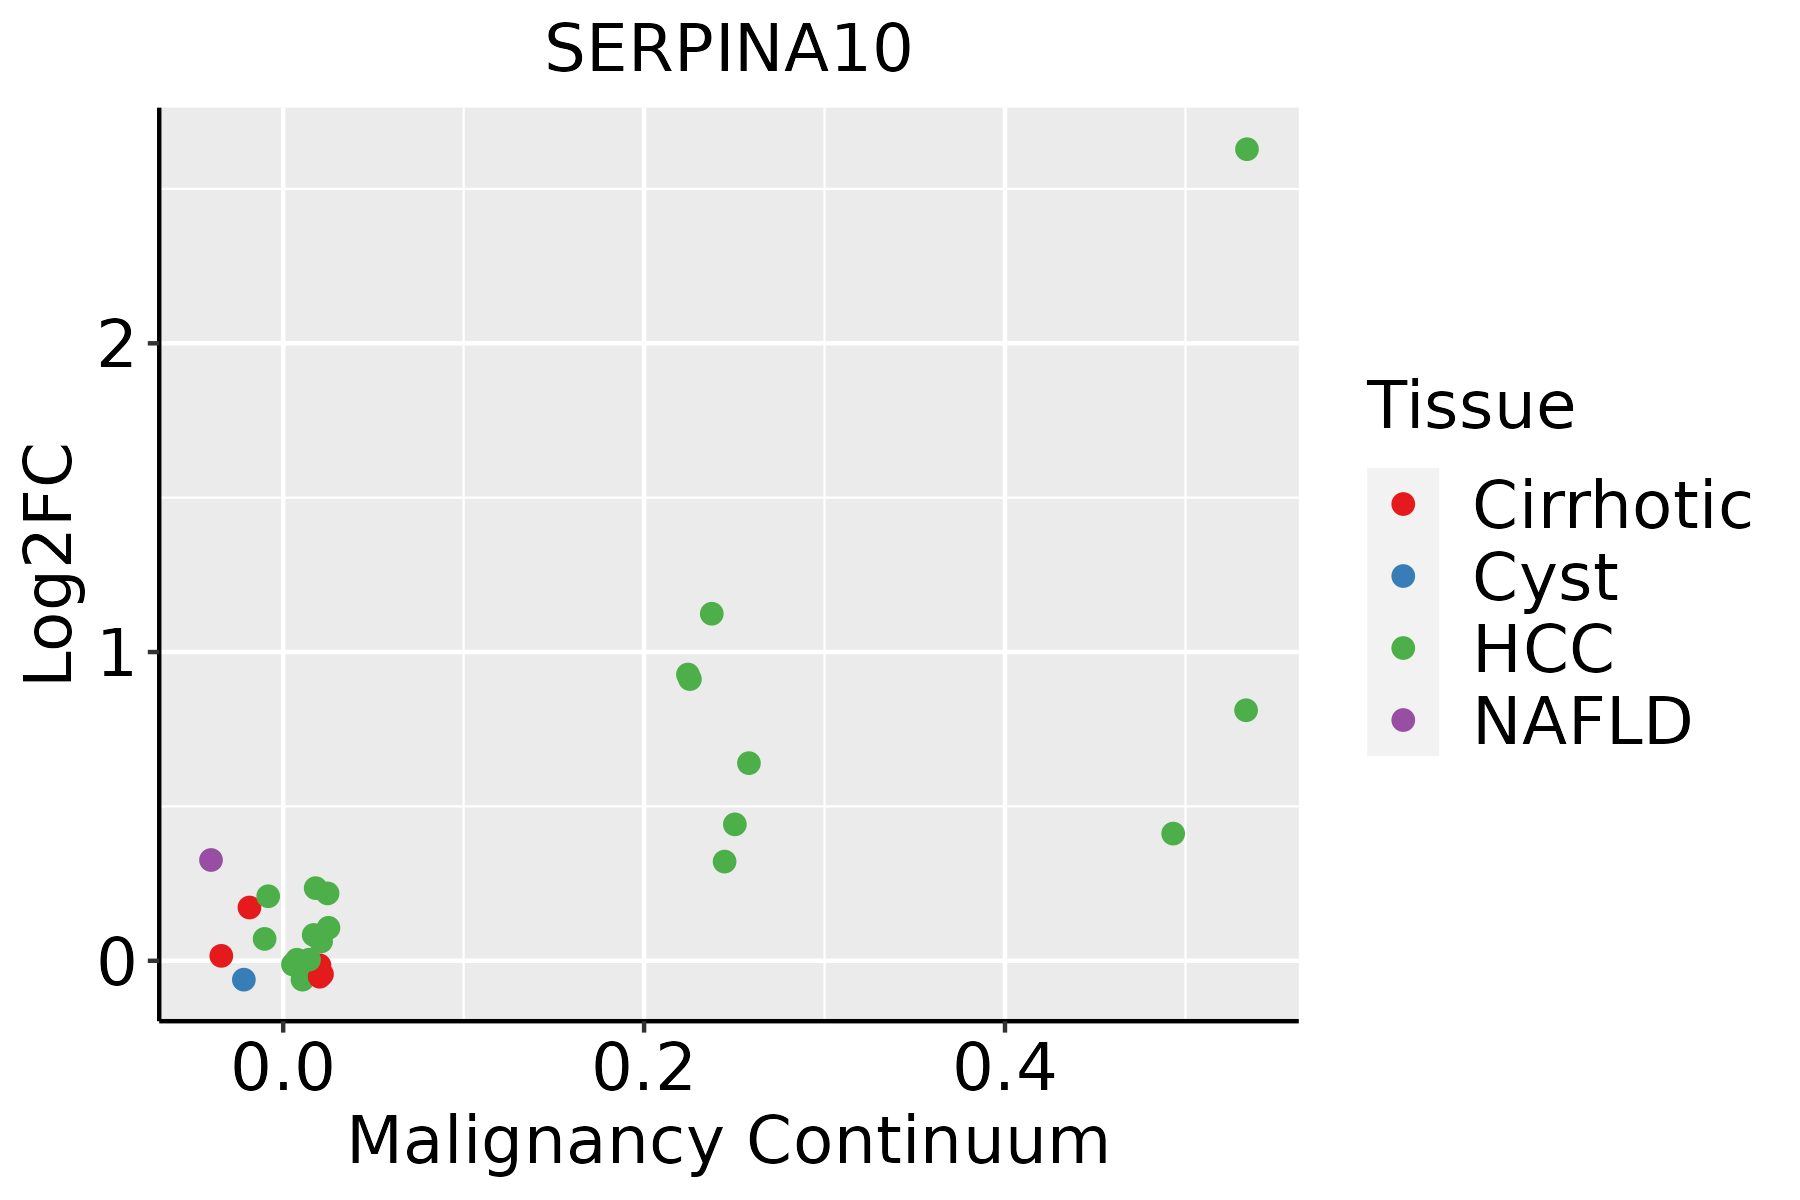 | HCC: Hepatocellular carcinoma |
| NAFLD: Non-alcoholic fatty liver disease |
| ∗log2FC in expression of this searched gene in stem-like cells from each diseased tissue sample relative to stem-like cells in normal samples in each tissue plotted against the malignancy continuum. Samples are colored based on if they are from different disease stage. |
Top |
Malignant transformation related pathway analysis |
| Find out the enriched GO biological processes and KEGG pathways involved in transition from healthy to precancer to cancer |
| Tissue | Disease Stage | Enriched GO biological Processes |
| Colorectum | AD |  |
| Colorectum | SER |  |
| Colorectum | MSS |  |
| Colorectum | MSI-H |  |
| Colorectum | FAP |  |
| ∗Top 15 enriched GO BP terms are showed in the bar plot of each disease state in each tissue. Each row represents a significant GO biological process which is colored according to the -log10(p.adjust). |
| Page: 1 2 3 4 5 6 7 8 9 |
| GO ID | Tissue | Disease Stage | Description | Gene Ratio | Bg Ratio | pvalue | p.adjust | Count |
| GO:00420607 | Liver | NAFLD | wound healing | 84/1882 | 422/18723 | 6.56e-10 | 1.37e-07 | 84 |
| GO:00075994 | Liver | NAFLD | hemostasis | 49/1882 | 222/18723 | 9.23e-08 | 7.59e-06 | 49 |
| GO:00075964 | Liver | NAFLD | blood coagulation | 48/1882 | 217/18723 | 1.16e-07 | 8.81e-06 | 48 |
| GO:00508174 | Liver | NAFLD | coagulation | 48/1882 | 222/18723 | 2.40e-07 | 1.61e-05 | 48 |
| GO:00458617 | Liver | NAFLD | negative regulation of proteolysis | 66/1882 | 351/18723 | 4.02e-07 | 2.58e-05 | 66 |
| GO:00513467 | Liver | NAFLD | negative regulation of hydrolase activity | 62/1882 | 379/18723 | 8.11e-05 | 1.66e-03 | 62 |
| GO:00525477 | Liver | NAFLD | regulation of peptidase activity | 72/1882 | 461/18723 | 1.03e-04 | 2.03e-03 | 72 |
| GO:00525487 | Liver | NAFLD | regulation of endopeptidase activity | 67/1882 | 432/18723 | 2.17e-04 | 3.70e-03 | 67 |
| GO:00508787 | Liver | NAFLD | regulation of body fluid levels | 60/1882 | 379/18723 | 2.61e-04 | 4.23e-03 | 60 |
| GO:00109517 | Liver | NAFLD | negative regulation of endopeptidase activity | 42/1882 | 252/18723 | 7.29e-04 | 9.29e-03 | 42 |
| GO:00104667 | Liver | NAFLD | negative regulation of peptidase activity | 43/1882 | 262/18723 | 8.76e-04 | 1.07e-02 | 43 |
| GO:005254722 | Liver | HCC | regulation of peptidase activity | 247/7958 | 461/18723 | 8.28e-07 | 1.27e-05 | 247 |
| GO:005254822 | Liver | HCC | regulation of endopeptidase activity | 230/7958 | 432/18723 | 3.58e-06 | 4.68e-05 | 230 |
| GO:004586122 | Liver | HCC | negative regulation of proteolysis | 186/7958 | 351/18723 | 4.19e-05 | 4.11e-04 | 186 |
| GO:004206022 | Liver | HCC | wound healing | 219/7958 | 422/18723 | 5.34e-05 | 5.04e-04 | 219 |
| GO:005134622 | Liver | HCC | negative regulation of hydrolase activity | 195/7958 | 379/18723 | 2.44e-04 | 1.82e-03 | 195 |
| GO:00075962 | Liver | HCC | blood coagulation | 118/7958 | 217/18723 | 2.63e-04 | 1.94e-03 | 118 |
| GO:00075992 | Liver | HCC | hemostasis | 119/7958 | 222/18723 | 5.25e-04 | 3.41e-03 | 119 |
| GO:00508172 | Liver | HCC | coagulation | 118/7958 | 222/18723 | 8.41e-04 | 5.03e-03 | 118 |
| GO:005087822 | Liver | HCC | regulation of body fluid levels | 191/7958 | 379/18723 | 1.06e-03 | 6.11e-03 | 191 |
| Page: 1 2 |
| Pathway ID | Tissue | Disease Stage | Description | Gene Ratio | Bg Ratio | pvalue | p.adjust | qvalue | Count |
| Page: 1 |
Top |
Cell-cell communication analysis |
| Identification of potential cell-cell interactions between two cell types and their ligand-receptor pairs for different disease states |
| Ligand | Receptor | LRpair | Pathway | Tissue | Disease Stage |
| Page: 1 |
Top |
Single-cell gene regulatory network inference analysis |
| Find out the significant the regulons (TFs) and the target genes of each regulon across cell types for different disease states |
| TF | Cell Type | Tissue | Disease Stage | Target Gene | RSS | Regulon Activity |
| ∗The dot plots of a searched regulon are shown for all cell subpopulations in each disease state of each tissue based on the regulon specific score inferred using pySCENIC and by calculating the average expression. |
| Page: 1 |
Top |
Somatic mutation of malignant transformation related genes |
| Annotation of somatic variants for genes involved in malignant transformation |
| Hugo Symbol | Variant Class | Variant Classification | dbSNP RS | HGVSc | HGVSp | HGVSp Short | SWISSPROT | BIOTYPE | SIFT | PolyPhen | Tumor Sample Barcode | Tissue | Histology | Sex | Age | Stage | Therapy Types | Drugs | Outcome |
| SERPINA10 | SNV | Missense_Mutation | c.804N>T | p.Met268Ile | p.M268I | Q9UK55 | protein_coding | deleterious(0.01) | possibly_damaging(0.846) | TCGA-B6-A0IK-01 | Breast | breast invasive carcinoma | Female | <65 | III/IV | Unknown | Unknown | PD | |
| SERPINA10 | SNV | Missense_Mutation | c.1250N>T | p.Asp417Val | p.D417V | Q9UK55 | protein_coding | deleterious(0) | benign(0.358) | TCGA-C8-A12V-01 | Breast | breast invasive carcinoma | Female | <65 | I/II | Unknown | Unknown | SD | |
| SERPINA10 | SNV | Missense_Mutation | novel | c.1135N>C | p.Val379Leu | p.V379L | Q9UK55 | protein_coding | deleterious(0.05) | benign(0.029) | TCGA-LL-A7T0-01 | Breast | breast invasive carcinoma | Female | >=65 | I/II | Unknown | Unknown | SD |
| SERPINA10 | SNV | Missense_Mutation | c.579N>A | p.Met193Ile | p.M193I | Q9UK55 | protein_coding | tolerated(0.21) | benign(0.005) | TCGA-DG-A2KH-01 | Cervix | cervical & endocervical cancer | Female | <65 | I/II | Unknown | Unknown | SD | |
| SERPINA10 | SNV | Missense_Mutation | c.838G>C | p.Asp280His | p.D280H | Q9UK55 | protein_coding | deleterious(0) | probably_damaging(1) | TCGA-FU-A3HY-01 | Cervix | cervical & endocervical cancer | Female | <65 | I/II | Chemotherapy | cisplatin | CR | |
| SERPINA10 | SNV | Missense_Mutation | c.565N>C | p.Glu189Gln | p.E189Q | Q9UK55 | protein_coding | deleterious(0.04) | benign(0.251) | TCGA-IR-A3LA-01 | Cervix | cervical & endocervical cancer | Female | <65 | I/II | Chemotherapy | cisplatin | CR | |
| SERPINA10 | SNV | Missense_Mutation | novel | c.815N>A | p.Ala272Glu | p.A272E | Q9UK55 | protein_coding | tolerated(0.82) | benign(0) | TCGA-5M-AAT6-01 | Colorectum | colon adenocarcinoma | Female | <65 | III/IV | Unknown | Unknown | PD |
| SERPINA10 | SNV | Missense_Mutation | rs142013081 | c.1156N>G | p.Thr386Ala | p.T386A | Q9UK55 | protein_coding | tolerated(1) | benign(0) | TCGA-AA-3510-01 | Colorectum | colon adenocarcinoma | Male | >=65 | I/II | Unknown | Unknown | SD |
| SERPINA10 | SNV | Missense_Mutation | rs533103231 | c.571N>A | p.Val191Met | p.V191M | Q9UK55 | protein_coding | tolerated(0.07) | possibly_damaging(0.907) | TCGA-AD-5900-01 | Colorectum | colon adenocarcinoma | Male | >=65 | I/II | Unknown | Unknown | SD |
| SERPINA10 | SNV | Missense_Mutation | novel | c.1230N>A | p.Met410Ile | p.M410I | Q9UK55 | protein_coding | deleterious(0.04) | benign(0.019) | TCGA-AZ-4315-01 | Colorectum | colon adenocarcinoma | Male | <65 | I/II | Unknown | Unknown | SD |
| Page: 1 2 3 4 5 6 |
Top |
Related drugs of malignant transformation related genes |
| Identification of chemicals and drugs interact with genes involved in malignant transfromation |
| (DGIdb 4.0) |
| Entrez ID | Symbol | Category | Interaction Types | Drug Claim Name | Drug Name | PMIDs |
| Page: 1 |

Copyright 2023-Present -The University of Texas Health Science Center at Houston |