
|
|||||
|
 | |
| |
| |
| |
| |
| |
|
Gene: SERPINA1 |
Gene summary for SERPINA1 |
| Gene information | Species | Human | Gene symbol | SERPINA1 | Gene ID | 5265 |
| Gene name | serpin family A member 1 | |
| Gene Alias | A1A | |
| Cytomap | 14q32.13 | |
| Gene Type | protein-coding | GO ID | GO:0002526 | UniProtAcc | E9KL23 |
Top |
Malignant transformation analysis |
| Identification of the aberrant gene expression in precancerous and cancerous lesions by comparing the gene expression of stem-like cells in diseased tissues with normal stem cells |
| Entrez ID | Symbol | Replicates | Species | Organ | Tissue | Adj P-value | Log2FC | Malignancy |
| 5265 | SERPINA1 | GSM4909286 | Human | Breast | IDC | 3.11e-02 | -1.91e-01 | 0.1081 |
| 5265 | SERPINA1 | GSM4909290 | Human | Breast | IDC | 8.79e-03 | -1.91e-01 | 0.2096 |
| 5265 | SERPINA1 | GSM4909301 | Human | Breast | IDC | 3.68e-04 | 2.40e-01 | 0.1577 |
| 5265 | SERPINA1 | GSM4909302 | Human | Breast | IDC | 6.44e-15 | 6.36e-01 | 0.1545 |
| 5265 | SERPINA1 | GSM4909304 | Human | Breast | IDC | 4.32e-16 | 2.50e-01 | 0.1636 |
| 5265 | SERPINA1 | GSM4909307 | Human | Breast | IDC | 4.05e-03 | 1.04e-01 | 0.1569 |
| 5265 | SERPINA1 | brca2 | Human | Breast | Precancer | 5.14e-12 | 4.66e-01 | -0.024 |
| 5265 | SERPINA1 | brca10 | Human | Breast | Precancer | 4.11e-19 | 8.21e-01 | -0.0029 |
| 5265 | SERPINA1 | NCCBC3 | Human | Breast | DCIS | 6.64e-04 | 2.31e-01 | 0.1198 |
| 5265 | SERPINA1 | P3 | Human | Breast | IDC | 1.52e-02 | 6.29e-01 | 0.1542 |
| 5265 | SERPINA1 | DCIS2 | Human | Breast | DCIS | 1.16e-03 | -8.83e-02 | 0.0085 |
| 5265 | SERPINA1 | CA_HPV_3 | Human | Cervix | CC | 2.80e-05 | -3.99e-01 | 0.0414 |
| 5265 | SERPINA1 | HSIL_HPV_2 | Human | Cervix | HSIL_HPV | 5.36e-03 | 2.94e-01 | 0.0208 |
| 5265 | SERPINA1 | CCI_1 | Human | Cervix | CC | 1.44e-06 | -5.63e-01 | 0.528 |
| 5265 | SERPINA1 | CCI_2 | Human | Cervix | CC | 9.89e-04 | -5.41e-01 | 0.5249 |
| 5265 | SERPINA1 | CCI_3 | Human | Cervix | CC | 3.97e-09 | -5.63e-01 | 0.516 |
| 5265 | SERPINA1 | CCII_1 | Human | Cervix | CC | 4.76e-13 | -5.63e-01 | 0.3249 |
| 5265 | SERPINA1 | Tumor | Human | Cervix | CC | 4.68e-22 | -5.61e-01 | 0.1241 |
| 5265 | SERPINA1 | sample1 | Human | Cervix | CC | 2.63e-07 | -5.37e-01 | 0.0959 |
| 5265 | SERPINA1 | sample3 | Human | Cervix | CC | 4.99e-20 | -5.56e-01 | 0.1387 |
| Page: 1 2 3 4 5 6 7 |
| Tissue | Expression Dynamics | Abbreviation |
| Breast |  | IDC: Invasive ductal carcinoma |
| DCIS: Ductal carcinoma in situ | ||
| Precancer(BRCA1-mut): Precancerous lesion from BRCA1 mutation carriers | ||
| Cervix | 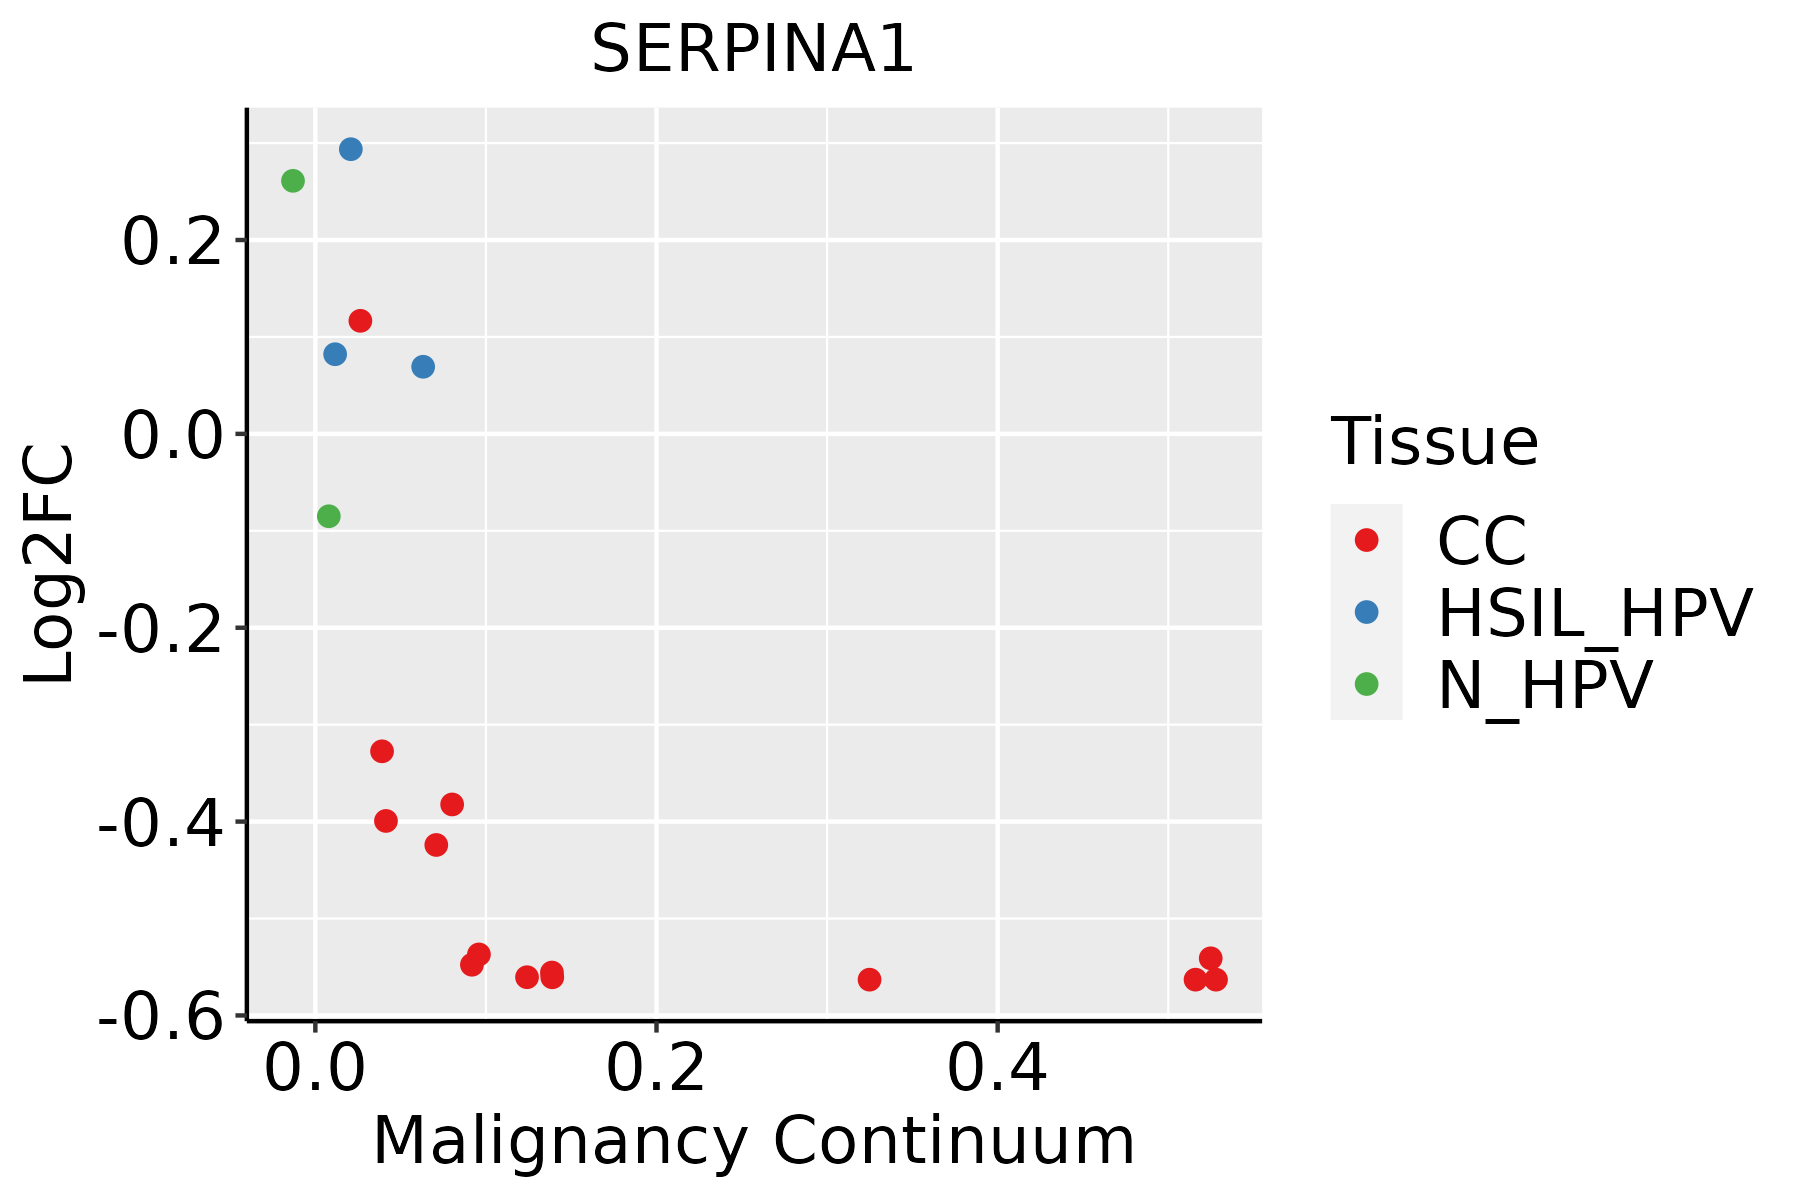 | CC: Cervix cancer |
| HSIL_HPV: HPV-infected high-grade squamous intraepithelial lesions | ||
| N_HPV: HPV-infected normal cervix | ||
| Colorectum (GSE201348) |  | FAP: Familial adenomatous polyposis |
| CRC: Colorectal cancer | ||
| Colorectum (HTA11) | 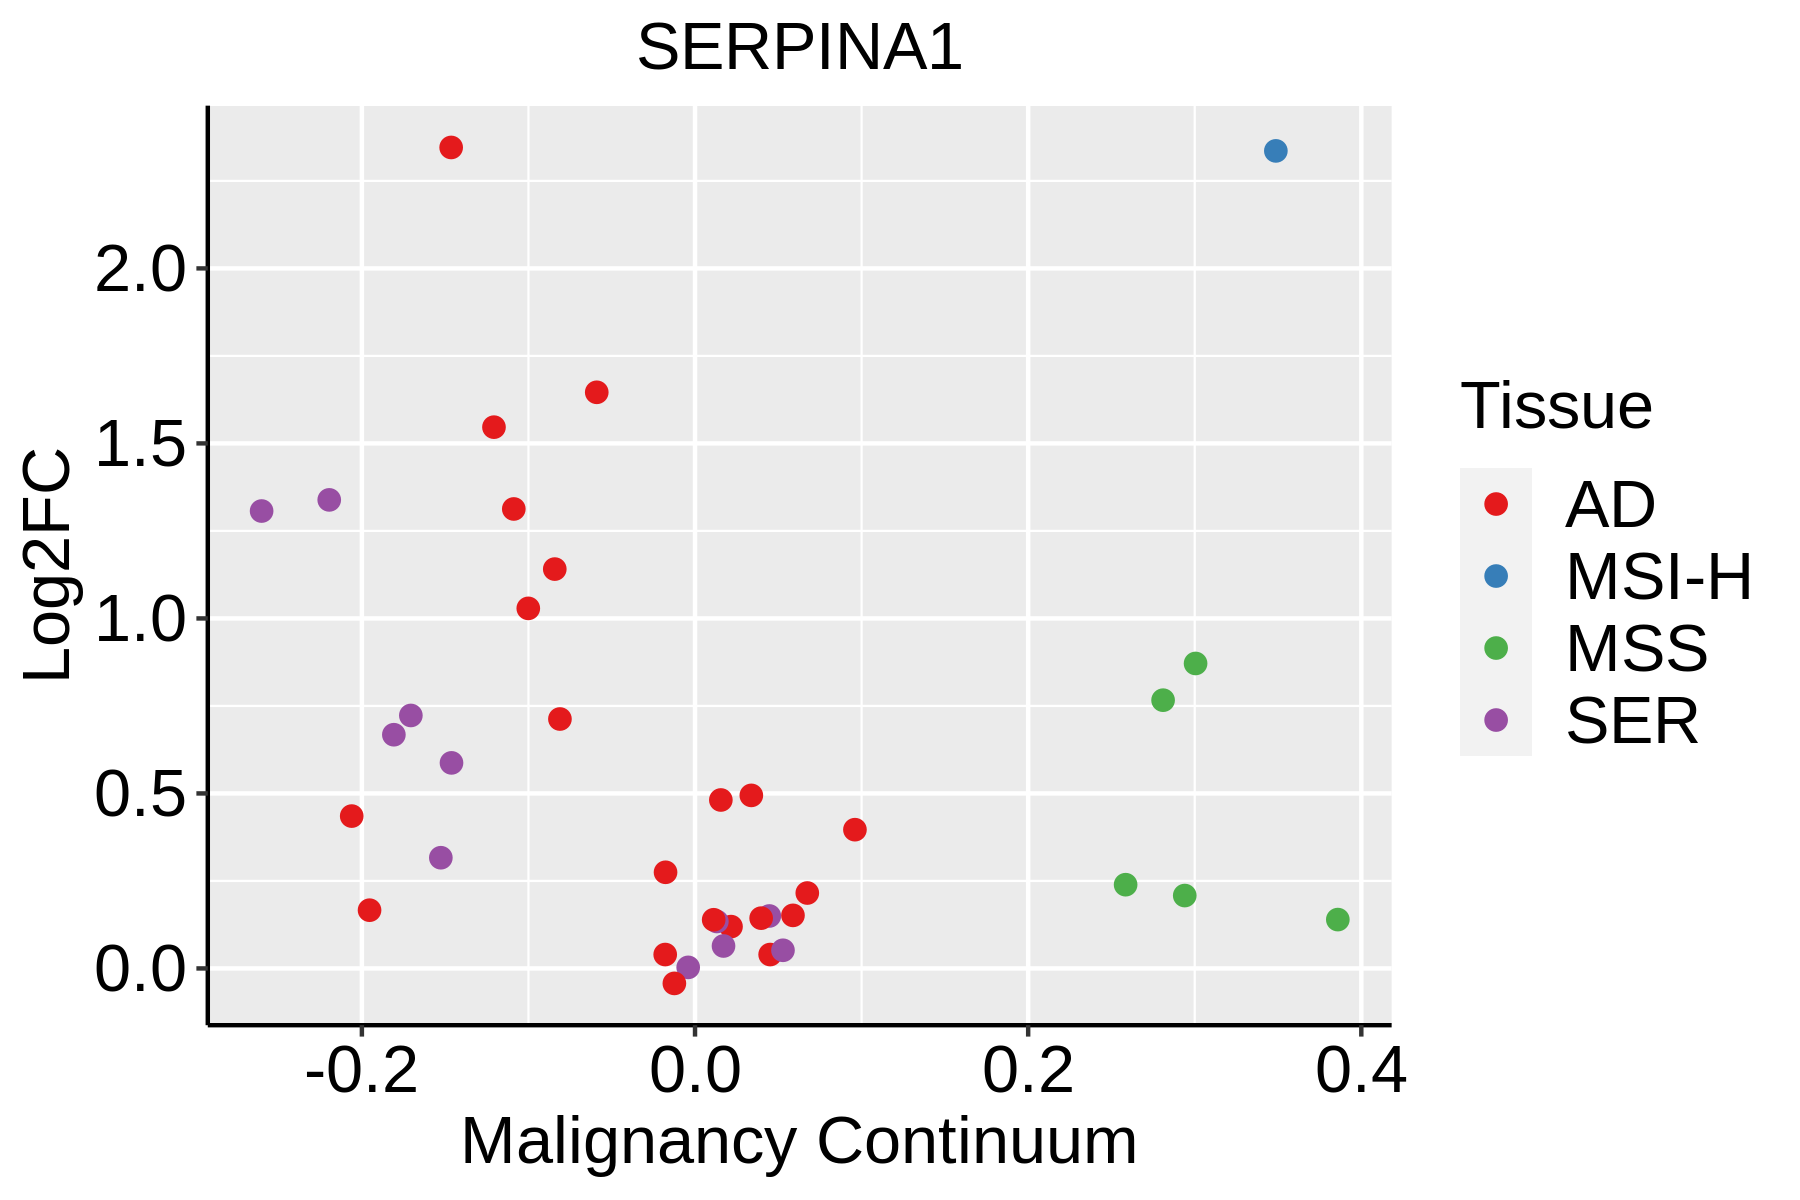 | AD: Adenomas |
| SER: Sessile serrated lesions | ||
| MSI-H: Microsatellite-high colorectal cancer | ||
| MSS: Microsatellite stable colorectal cancer | ||
| Endometrium | 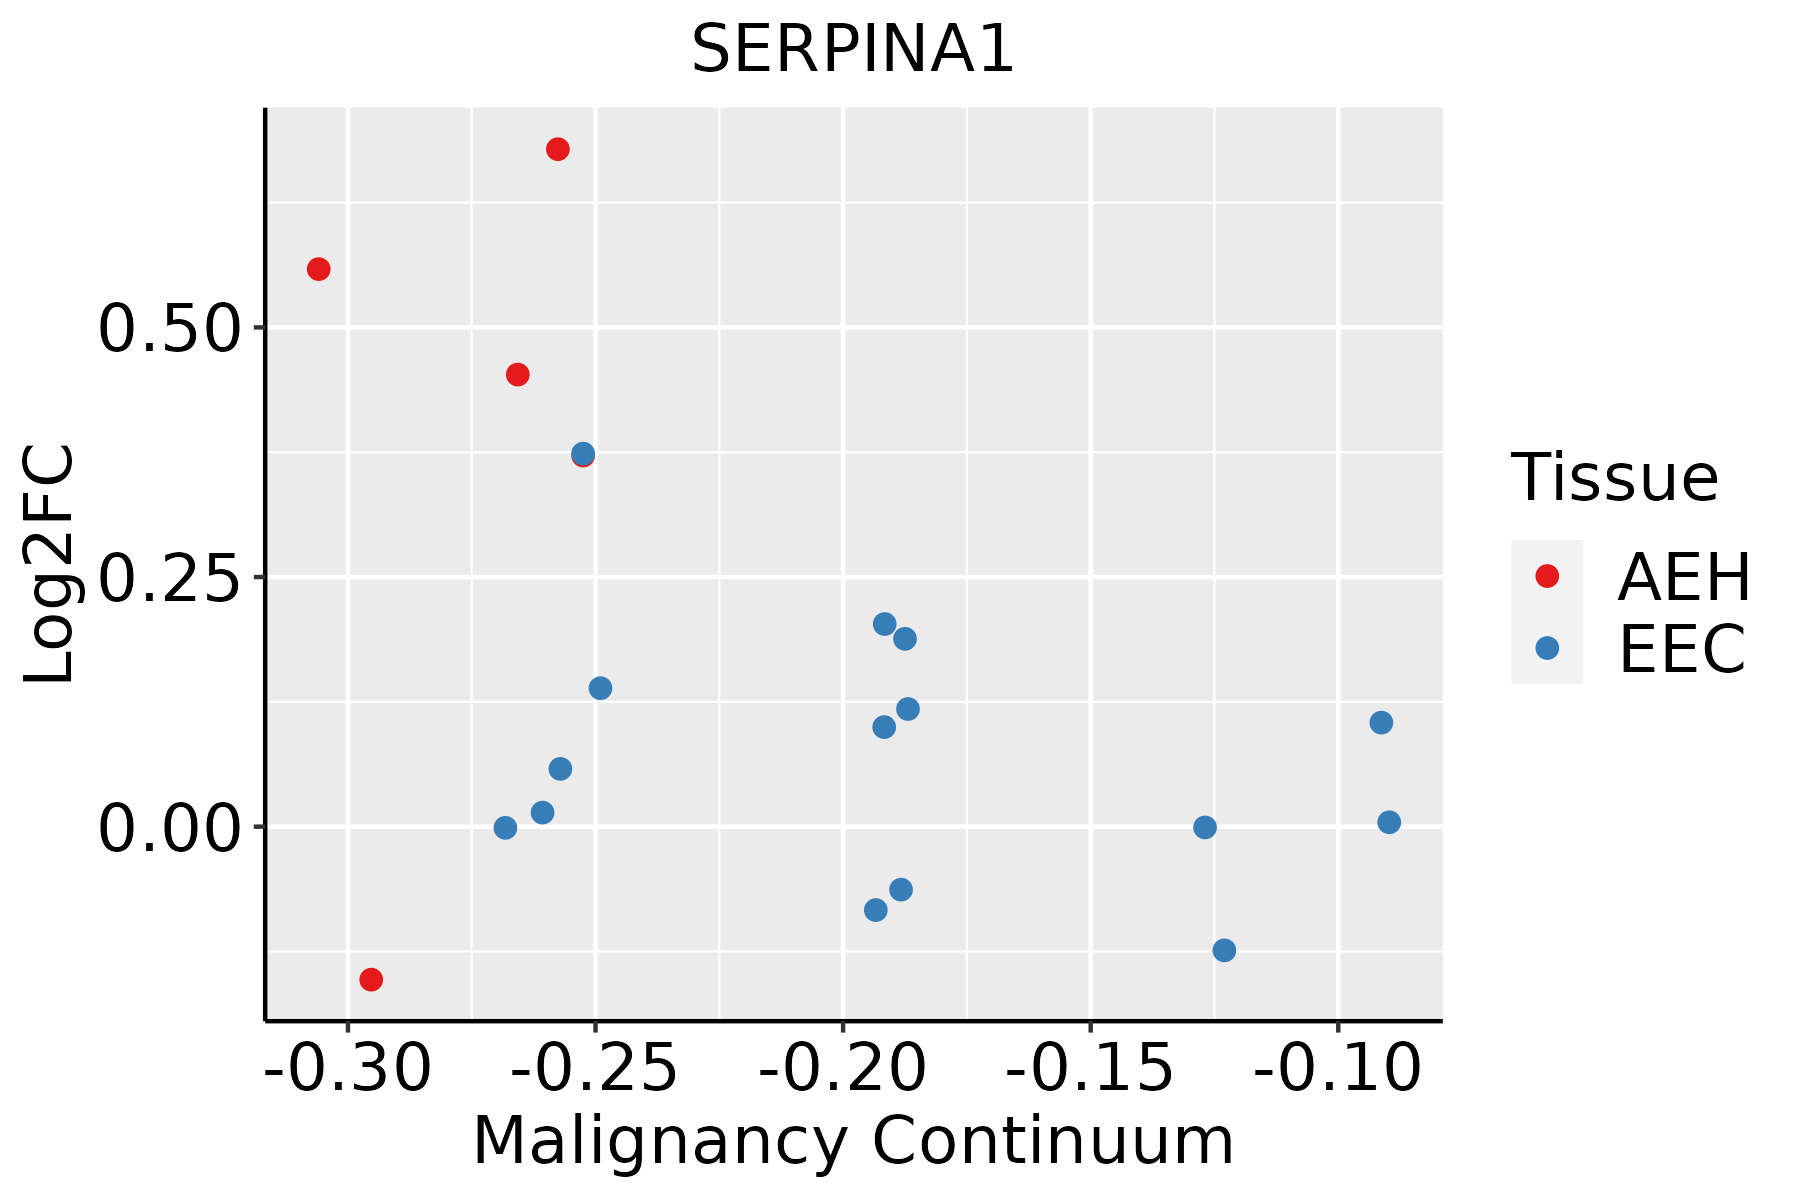 | AEH: Atypical endometrial hyperplasia |
| EEC: Endometrioid Cancer | ||
| Esophagus |  | ESCC: Esophageal squamous cell carcinoma |
| HGIN: High-grade intraepithelial neoplasias | ||
| LGIN: Low-grade intraepithelial neoplasias | ||
| GC | 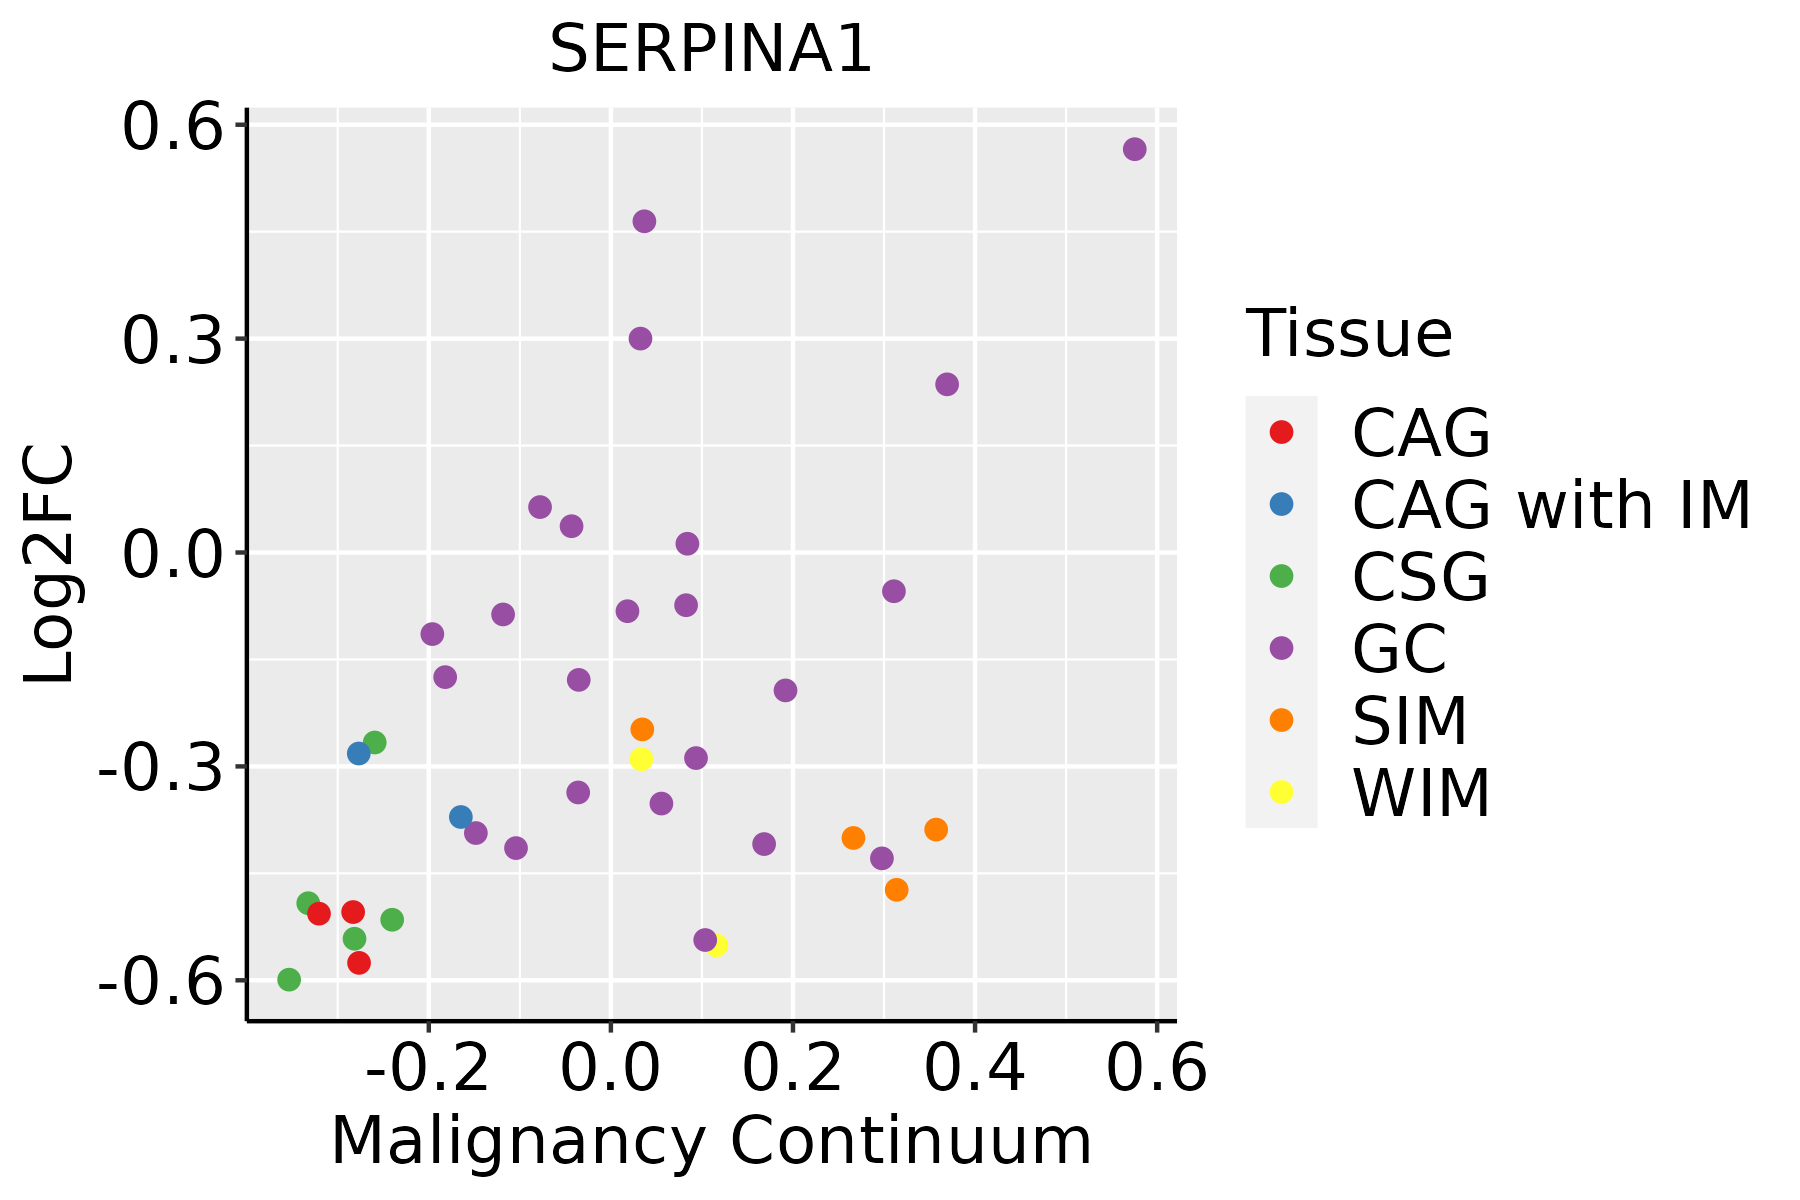 | CAG: Chronic atrophic gastritis |
| CAG with IM: Chronic atrophic gastritis with intestinal metaplasia | ||
| CSG: Chronic superficial gastritis | ||
| GC: Gastric cancer | ||
| SIM: Severe intestinal metaplasia | ||
| WIM: Wild intestinal metaplasia | ||
| Liver |  | HCC: Hepatocellular carcinoma |
| NAFLD: Non-alcoholic fatty liver disease | ||
| Lung |  | AAH: Atypical adenomatous hyperplasia |
| AIS: Adenocarcinoma in situ | ||
| IAC: Invasive lung adenocarcinoma | ||
| MIA: Minimally invasive adenocarcinoma | ||
| Thyroid | 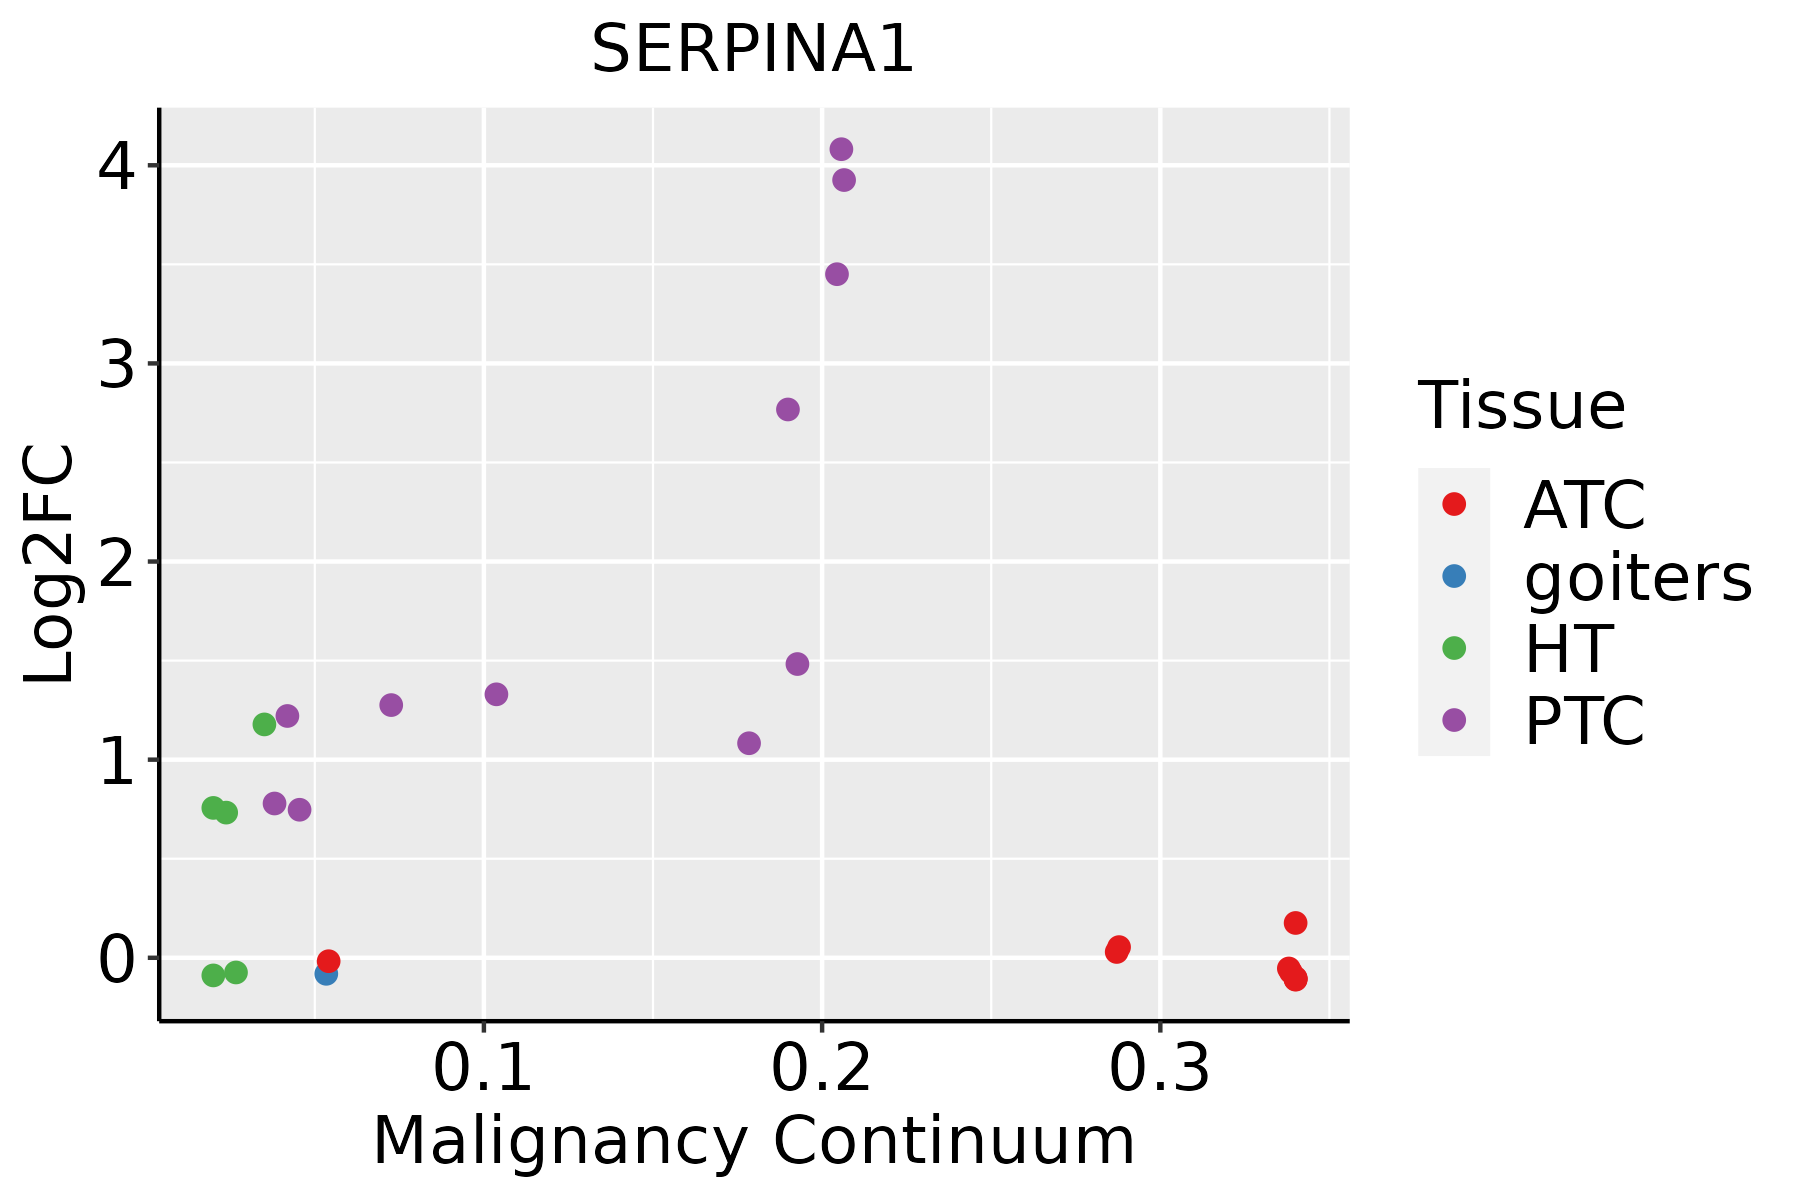 | ATC: Anaplastic thyroid cancer |
| HT: Hashimoto's thyroiditis | ||
| PTC: Papillary thyroid cancer |
| ∗log2FC in expression of this searched gene in stem-like cells from each diseased tissue sample relative to stem-like cells in normal samples in each tissue plotted against the malignancy continuum. Samples are colored based on if they are from different disease stage. |
Top |
Malignant transformation related pathway analysis |
| Find out the enriched GO biological processes and KEGG pathways involved in transition from healthy to precancer to cancer |
| Tissue | Disease Stage | Enriched GO biological Processes |
| Colorectum | AD |  |
| Colorectum | SER |  |
| Colorectum | MSS |  |
| Colorectum | MSI-H |  |
| Colorectum | FAP |  |
| ∗Top 15 enriched GO BP terms are showed in the bar plot of each disease state in each tissue. Each row represents a significant GO biological process which is colored according to the -log10(p.adjust). |
| Page: 1 2 3 4 5 6 7 8 9 |
| GO ID | Tissue | Disease Stage | Description | Gene Ratio | Bg Ratio | pvalue | p.adjust | Count |
| GO:00525479 | Breast | Precancer | regulation of peptidase activity | 71/1080 | 461/18723 | 2.72e-14 | 6.94e-12 | 71 |
| GO:00525489 | Breast | Precancer | regulation of endopeptidase activity | 67/1080 | 432/18723 | 1.06e-13 | 2.36e-11 | 67 |
| GO:00458619 | Breast | Precancer | negative regulation of proteolysis | 50/1080 | 351/18723 | 2.99e-09 | 2.39e-07 | 50 |
| GO:00513468 | Breast | Precancer | negative regulation of hydrolase activity | 50/1080 | 379/18723 | 3.85e-08 | 2.34e-06 | 50 |
| GO:00104668 | Breast | Precancer | negative regulation of peptidase activity | 38/1080 | 262/18723 | 1.46e-07 | 7.82e-06 | 38 |
| GO:00109519 | Breast | Precancer | negative regulation of endopeptidase activity | 37/1080 | 252/18723 | 1.55e-07 | 8.05e-06 | 37 |
| GO:00420609 | Breast | Precancer | wound healing | 48/1080 | 422/18723 | 5.48e-06 | 1.63e-04 | 48 |
| GO:00508789 | Breast | Precancer | regulation of body fluid levels | 40/1080 | 379/18723 | 1.68e-04 | 2.77e-03 | 40 |
| GO:00025263 | Breast | Precancer | acute inflammatory response | 16/1080 | 112/18723 | 6.87e-04 | 8.36e-03 | 16 |
| GO:00075995 | Breast | Precancer | hemostasis | 24/1080 | 222/18723 | 2.31e-03 | 2.15e-02 | 24 |
| GO:00075965 | Breast | Precancer | blood coagulation | 23/1080 | 217/18723 | 3.61e-03 | 2.98e-02 | 23 |
| GO:00508175 | Breast | Precancer | coagulation | 23/1080 | 222/18723 | 4.78e-03 | 3.64e-02 | 23 |
| GO:005254714 | Breast | IDC | regulation of peptidase activity | 96/1434 | 461/18723 | 7.58e-20 | 6.15e-17 | 96 |
| GO:005254814 | Breast | IDC | regulation of endopeptidase activity | 88/1434 | 432/18723 | 1.20e-17 | 4.85e-15 | 88 |
| GO:004586114 | Breast | IDC | negative regulation of proteolysis | 70/1434 | 351/18723 | 8.21e-14 | 2.22e-11 | 70 |
| GO:005134613 | Breast | IDC | negative regulation of hydrolase activity | 71/1434 | 379/18723 | 1.33e-12 | 2.90e-10 | 71 |
| GO:001046613 | Breast | IDC | negative regulation of peptidase activity | 56/1434 | 262/18723 | 1.39e-12 | 2.92e-10 | 56 |
| GO:001095112 | Breast | IDC | negative regulation of endopeptidase activity | 52/1434 | 252/18723 | 3.53e-11 | 5.57e-09 | 52 |
| GO:004206014 | Breast | IDC | wound healing | 55/1434 | 422/18723 | 7.27e-05 | 1.45e-03 | 55 |
| GO:005087813 | Breast | IDC | regulation of body fluid levels | 50/1434 | 379/18723 | 1.12e-04 | 2.10e-03 | 50 |
| Page: 1 2 3 4 5 6 7 8 9 10 11 12 |
| Pathway ID | Tissue | Disease Stage | Description | Gene Ratio | Bg Ratio | pvalue | p.adjust | qvalue | Count |
| hsa046102 | Liver | Cirrhotic | Complement and coagulation cascades | 48/2530 | 86/8465 | 4.41e-07 | 5.44e-06 | 3.35e-06 | 48 |
| hsa046103 | Liver | Cirrhotic | Complement and coagulation cascades | 48/2530 | 86/8465 | 4.41e-07 | 5.44e-06 | 3.35e-06 | 48 |
| hsa046104 | Liver | HCC | Complement and coagulation cascades | 57/4020 | 86/8465 | 3.19e-04 | 1.45e-03 | 8.04e-04 | 57 |
| hsa046105 | Liver | HCC | Complement and coagulation cascades | 57/4020 | 86/8465 | 3.19e-04 | 1.45e-03 | 8.04e-04 | 57 |
| Page: 1 |
Top |
Cell-cell communication analysis |
| Identification of potential cell-cell interactions between two cell types and their ligand-receptor pairs for different disease states |
| Ligand | Receptor | LRpair | Pathway | Tissue | Disease Stage |
| Page: 1 |
Top |
Single-cell gene regulatory network inference analysis |
| Find out the significant the regulons (TFs) and the target genes of each regulon across cell types for different disease states |
| TF | Cell Type | Tissue | Disease Stage | Target Gene | RSS | Regulon Activity |
| ∗The dot plots of a searched regulon are shown for all cell subpopulations in each disease state of each tissue based on the regulon specific score inferred using pySCENIC and by calculating the average expression. |
| Page: 1 |
Top |
Somatic mutation of malignant transformation related genes |
| Annotation of somatic variants for genes involved in malignant transformation |
| Hugo Symbol | Variant Class | Variant Classification | dbSNP RS | HGVSc | HGVSp | HGVSp Short | SWISSPROT | BIOTYPE | SIFT | PolyPhen | Tumor Sample Barcode | Tissue | Histology | Sex | Age | Stage | Therapy Types | Drugs | Outcome |
| SERPINA1 | SNV | Missense_Mutation | rs758293405 | c.134N>T | p.Pro45Leu | p.P45L | P01009 | protein_coding | tolerated(0.45) | benign(0) | TCGA-A8-A06U-01 | Breast | breast invasive carcinoma | Female | >=65 | I/II | Unknown | Unknown | SD |
| SERPINA1 | SNV | Missense_Mutation | c.4N>G | p.Pro2Ala | p.P2A | P01009 | protein_coding | tolerated(0.23) | benign(0.071) | TCGA-A8-A097-01 | Breast | breast invasive carcinoma | Female | >=65 | I/II | Hormone Therapy | tamoxiphen | SD | |
| SERPINA1 | SNV | Missense_Mutation | rs758293405 | c.134N>T | p.Pro45Leu | p.P45L | P01009 | protein_coding | tolerated(0.45) | benign(0) | TCGA-A8-A09G-01 | Breast | breast invasive carcinoma | Female | >=65 | III/IV | Unknown | Unknown | SD |
| SERPINA1 | SNV | Missense_Mutation | rs139964603 | c.976N>A | p.Val326Ile | p.V326I | P01009 | protein_coding | tolerated(1) | benign(0.009) | TCGA-D8-A1JF-01 | Breast | breast invasive carcinoma | Female | >=65 | III/IV | Unknown | Unknown | SD |
| SERPINA1 | SNV | Missense_Mutation | novel | c.331N>G | p.Ile111Val | p.I111V | P01009 | protein_coding | tolerated(0.71) | benign(0.012) | TCGA-E2-A572-01 | Breast | breast invasive carcinoma | Female | >=65 | III/IV | Chemotherapy | doxorubicin | SD |
| SERPINA1 | insertion | Frame_Shift_Ins | novel | c.488_489insTGTTCGCAGAAGGCTTGCGTTTCTCTGTCACTTTATCGGTG | p.Ser164ValfsTer60 | p.S164Vfs*60 | P01009 | protein_coding | TCGA-BH-A0AY-01 | Breast | breast invasive carcinoma | Female | <65 | I/II | Chemotherapy | SD | |||
| SERPINA1 | SNV | Missense_Mutation | c.458A>C | p.Lys153Thr | p.K153T | P01009 | protein_coding | tolerated(0.07) | benign(0.175) | TCGA-A6-6653-01 | Colorectum | colon adenocarcinoma | Male | >=65 | I/II | Unknown | Unknown | SD | |
| SERPINA1 | SNV | Missense_Mutation | rs11558261 | c.415N>A | p.Gly139Ser | p.G139S | P01009 | protein_coding | tolerated(0.1) | probably_damaging(0.964) | TCGA-CA-5254-01 | Colorectum | colon adenocarcinoma | Female | <65 | I/II | Chemotherapy | oxaliplatin | CR |
| SERPINA1 | SNV | Missense_Mutation | rs544632177 | c.740G>A | p.Arg247His | p.R247H | P01009 | protein_coding | tolerated(0.09) | benign(0.132) | TCGA-CM-4746-01 | Colorectum | colon adenocarcinoma | Male | <65 | I/II | Unknown | Unknown | SD |
| SERPINA1 | SNV | Missense_Mutation | c.225N>A | p.Phe75Leu | p.F75L | P01009 | protein_coding | tolerated(0.33) | benign(0.248) | TCGA-AG-3892-01 | Colorectum | rectum adenocarcinoma | Female | <65 | I/II | Unknown | Unknown | SD |
| Page: 1 2 3 4 5 6 |
Top |
Related drugs of malignant transformation related genes |
| Identification of chemicals and drugs interact with genes involved in malignant transfromation |
| (DGIdb 4.0) |
| Entrez ID | Symbol | Category | Interaction Types | Drug Claim Name | Drug Name | PMIDs |
| 5265 | SERPINA1 | DRUGGABLE GENOME, PROTEASE INHIBITOR | Alpha1-proteinase inhibitor (human) modified process | |||
| 5265 | SERPINA1 | DRUGGABLE GENOME, PROTEASE INHIBITOR | Igmesine | IGMESINE | ||
| 5265 | SERPINA1 | DRUGGABLE GENOME, PROTEASE INHIBITOR | Glassia | .ALPHA.1-PROTEINASE INHIBITOR HUMAN | ||
| 5265 | SERPINA1 | DRUGGABLE GENOME, PROTEASE INHIBITOR | AGTC-0106 |
| Page: 1 |

Copyright 2023-Present -The University of Texas Health Science Center at Houston |