
|
|||||
|
 | |
| |
| |
| |
| |
| |
|
Gene: SERP1 |
Gene summary for SERP1 |
| Gene information | Species | Human | Gene symbol | SERP1 | Gene ID | 27230 |
| Gene name | stress associated endoplasmic reticulum protein 1 | |
| Gene Alias | RAMP4 | |
| Cytomap | 3q25.1 | |
| Gene Type | protein-coding | GO ID | GO:0001501 | UniProtAcc | Q9Y6X1 |
Top |
Malignant transformation analysis |
| Identification of the aberrant gene expression in precancerous and cancerous lesions by comparing the gene expression of stem-like cells in diseased tissues with normal stem cells |
| Entrez ID | Symbol | Replicates | Species | Organ | Tissue | Adj P-value | Log2FC | Malignancy |
| 27230 | SERP1 | GSM4909281 | Human | Breast | IDC | 3.49e-04 | 2.62e-01 | 0.21 |
| 27230 | SERP1 | GSM4909285 | Human | Breast | IDC | 5.11e-21 | 4.36e-01 | 0.21 |
| 27230 | SERP1 | GSM4909286 | Human | Breast | IDC | 4.51e-15 | -3.11e-01 | 0.1081 |
| 27230 | SERP1 | GSM4909287 | Human | Breast | IDC | 1.17e-08 | 1.53e-01 | 0.2057 |
| 27230 | SERP1 | GSM4909288 | Human | Breast | IDC | 4.54e-03 | 4.86e-03 | 0.0988 |
| 27230 | SERP1 | GSM4909290 | Human | Breast | IDC | 5.16e-05 | 2.61e-01 | 0.2096 |
| 27230 | SERP1 | GSM4909293 | Human | Breast | IDC | 6.85e-04 | 2.32e-01 | 0.1581 |
| 27230 | SERP1 | GSM4909294 | Human | Breast | IDC | 9.66e-11 | 2.60e-02 | 0.2022 |
| 27230 | SERP1 | GSM4909296 | Human | Breast | IDC | 1.56e-10 | -1.48e-01 | 0.1524 |
| 27230 | SERP1 | GSM4909297 | Human | Breast | IDC | 8.28e-26 | -4.94e-01 | 0.1517 |
| 27230 | SERP1 | GSM4909298 | Human | Breast | IDC | 1.68e-06 | -2.35e-01 | 0.1551 |
| 27230 | SERP1 | GSM4909301 | Human | Breast | IDC | 4.11e-14 | 2.70e-01 | 0.1577 |
| 27230 | SERP1 | GSM4909304 | Human | Breast | IDC | 2.08e-05 | 2.24e-01 | 0.1636 |
| 27230 | SERP1 | GSM4909308 | Human | Breast | IDC | 8.64e-05 | 2.63e-01 | 0.158 |
| 27230 | SERP1 | GSM4909309 | Human | Breast | IDC | 3.73e-04 | -2.85e-01 | 0.0483 |
| 27230 | SERP1 | GSM4909311 | Human | Breast | IDC | 7.39e-54 | -5.82e-01 | 0.1534 |
| 27230 | SERP1 | GSM4909312 | Human | Breast | IDC | 1.95e-13 | -1.30e-01 | 0.1552 |
| 27230 | SERP1 | GSM4909313 | Human | Breast | IDC | 1.52e-10 | -4.29e-02 | 0.0391 |
| 27230 | SERP1 | GSM4909315 | Human | Breast | IDC | 3.98e-26 | 4.12e-01 | 0.21 |
| 27230 | SERP1 | GSM4909316 | Human | Breast | IDC | 8.28e-19 | 3.57e-01 | 0.21 |
| Page: 1 2 3 4 5 6 7 8 9 10 11 12 13 14 |
| Tissue | Expression Dynamics | Abbreviation |
| Breast | 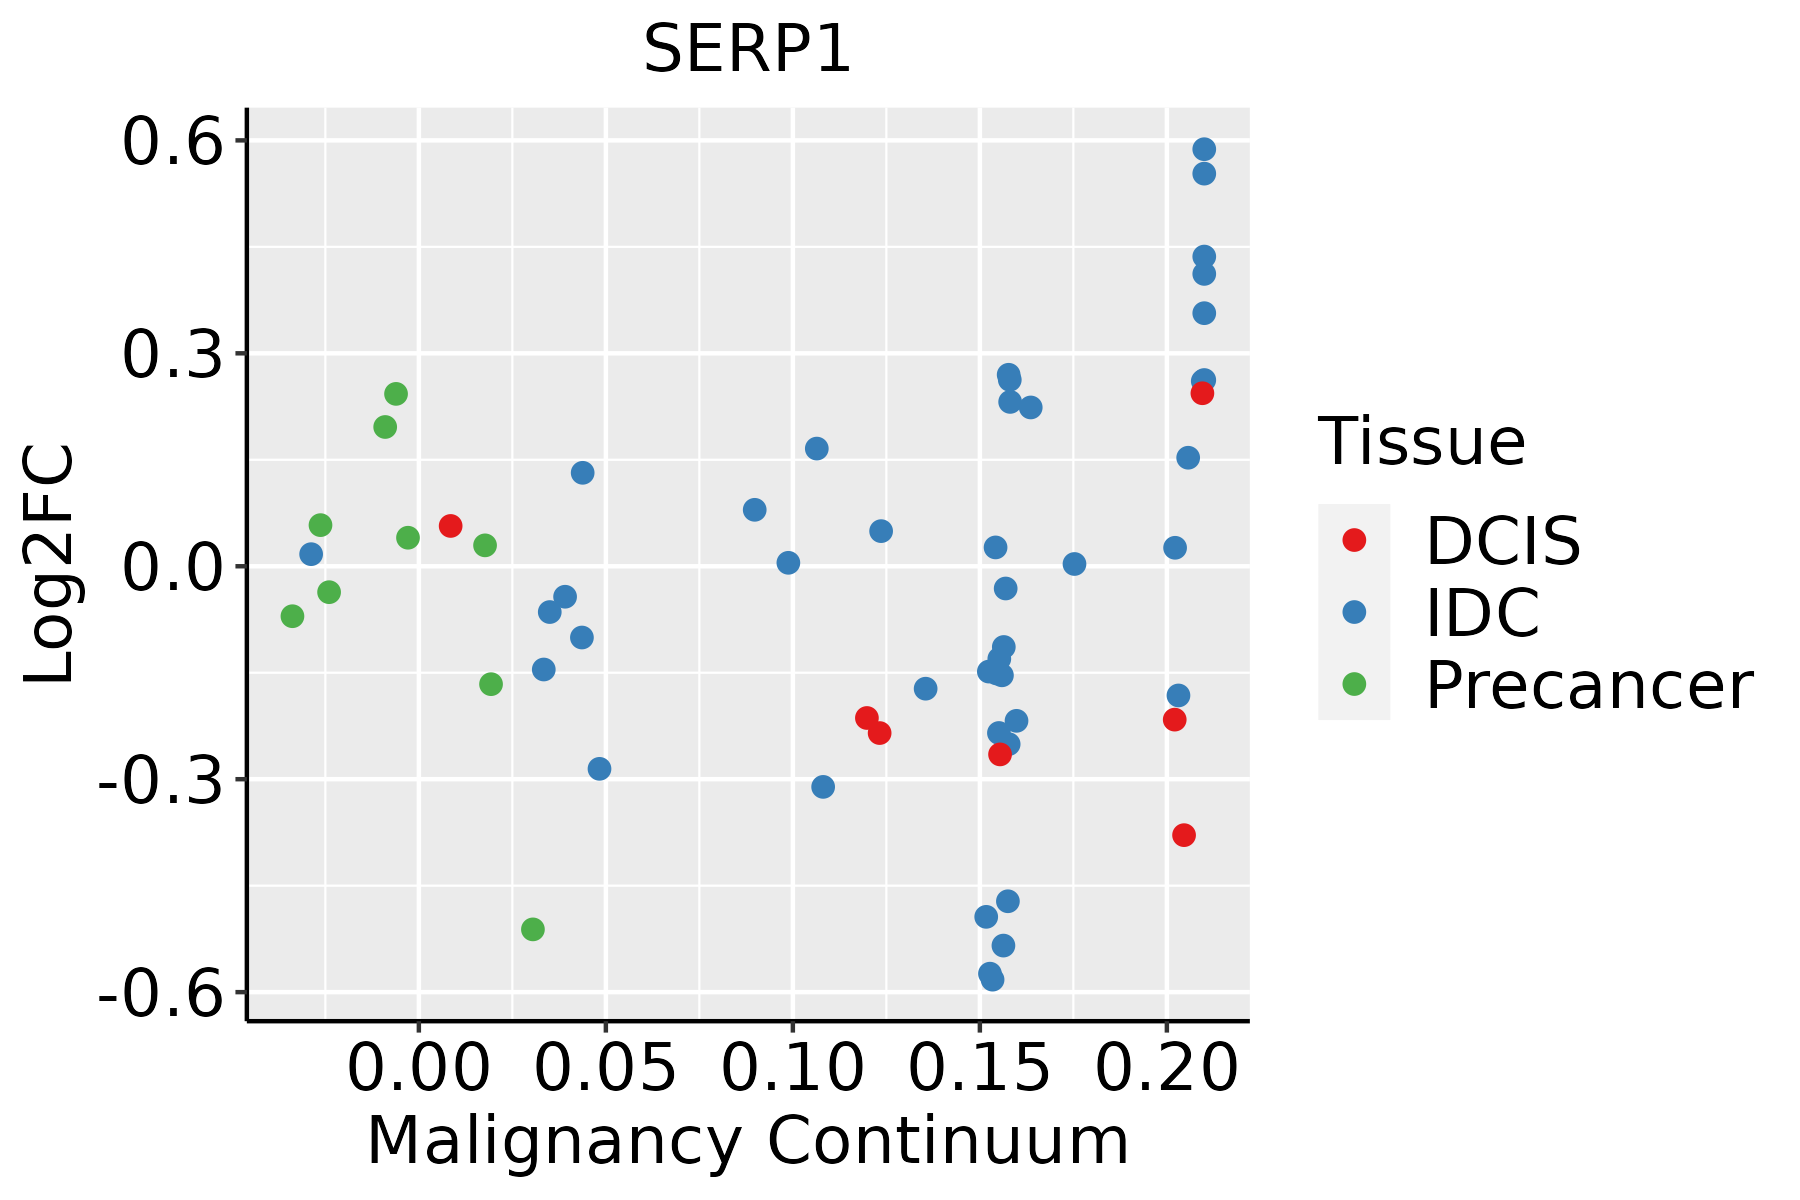 | IDC: Invasive ductal carcinoma |
| DCIS: Ductal carcinoma in situ | ||
| Precancer(BRCA1-mut): Precancerous lesion from BRCA1 mutation carriers | ||
| Cervix | 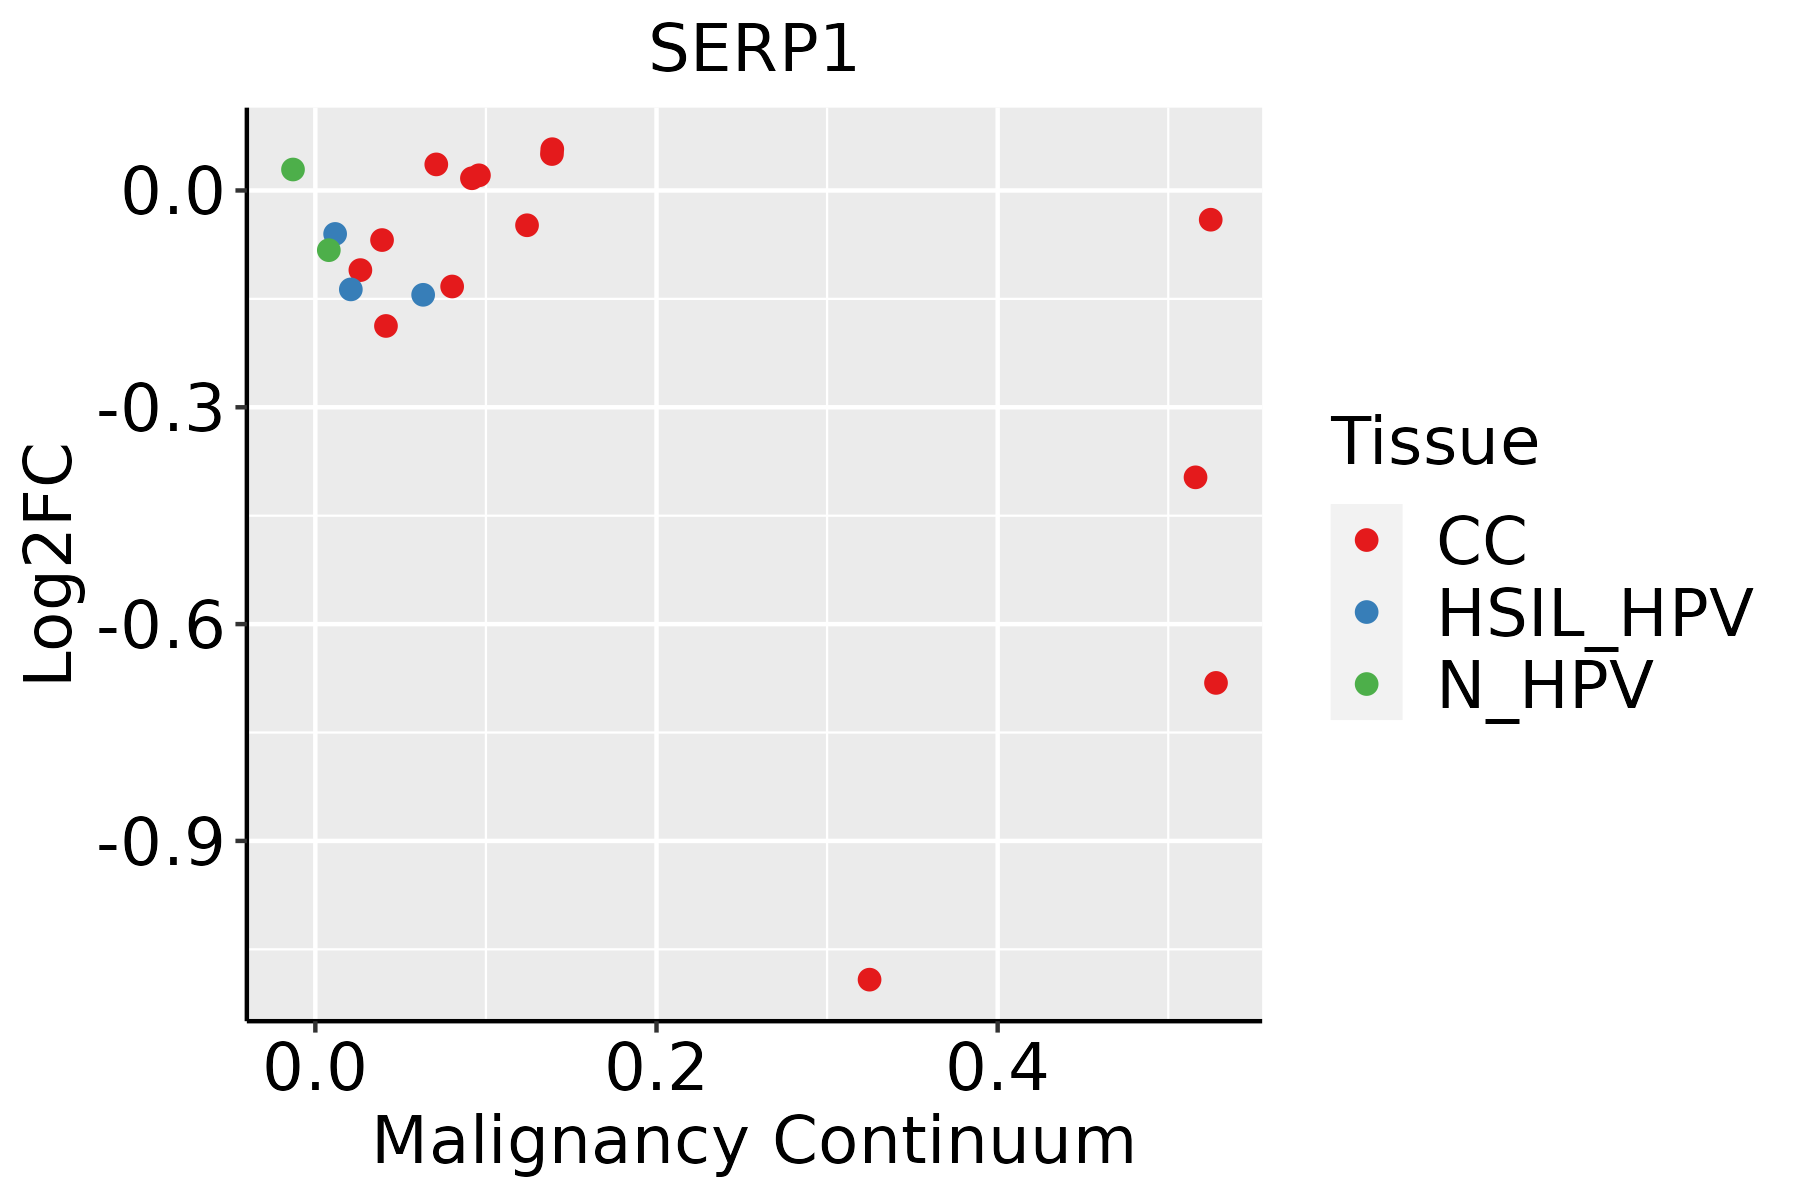 | CC: Cervix cancer |
| HSIL_HPV: HPV-infected high-grade squamous intraepithelial lesions | ||
| N_HPV: HPV-infected normal cervix | ||
| Colorectum (GSE201348) |  | FAP: Familial adenomatous polyposis |
| CRC: Colorectal cancer | ||
| Colorectum (HTA11) |  | AD: Adenomas |
| SER: Sessile serrated lesions | ||
| MSI-H: Microsatellite-high colorectal cancer | ||
| MSS: Microsatellite stable colorectal cancer | ||
| Endometrium |  | AEH: Atypical endometrial hyperplasia |
| EEC: Endometrioid Cancer | ||
| Esophagus | 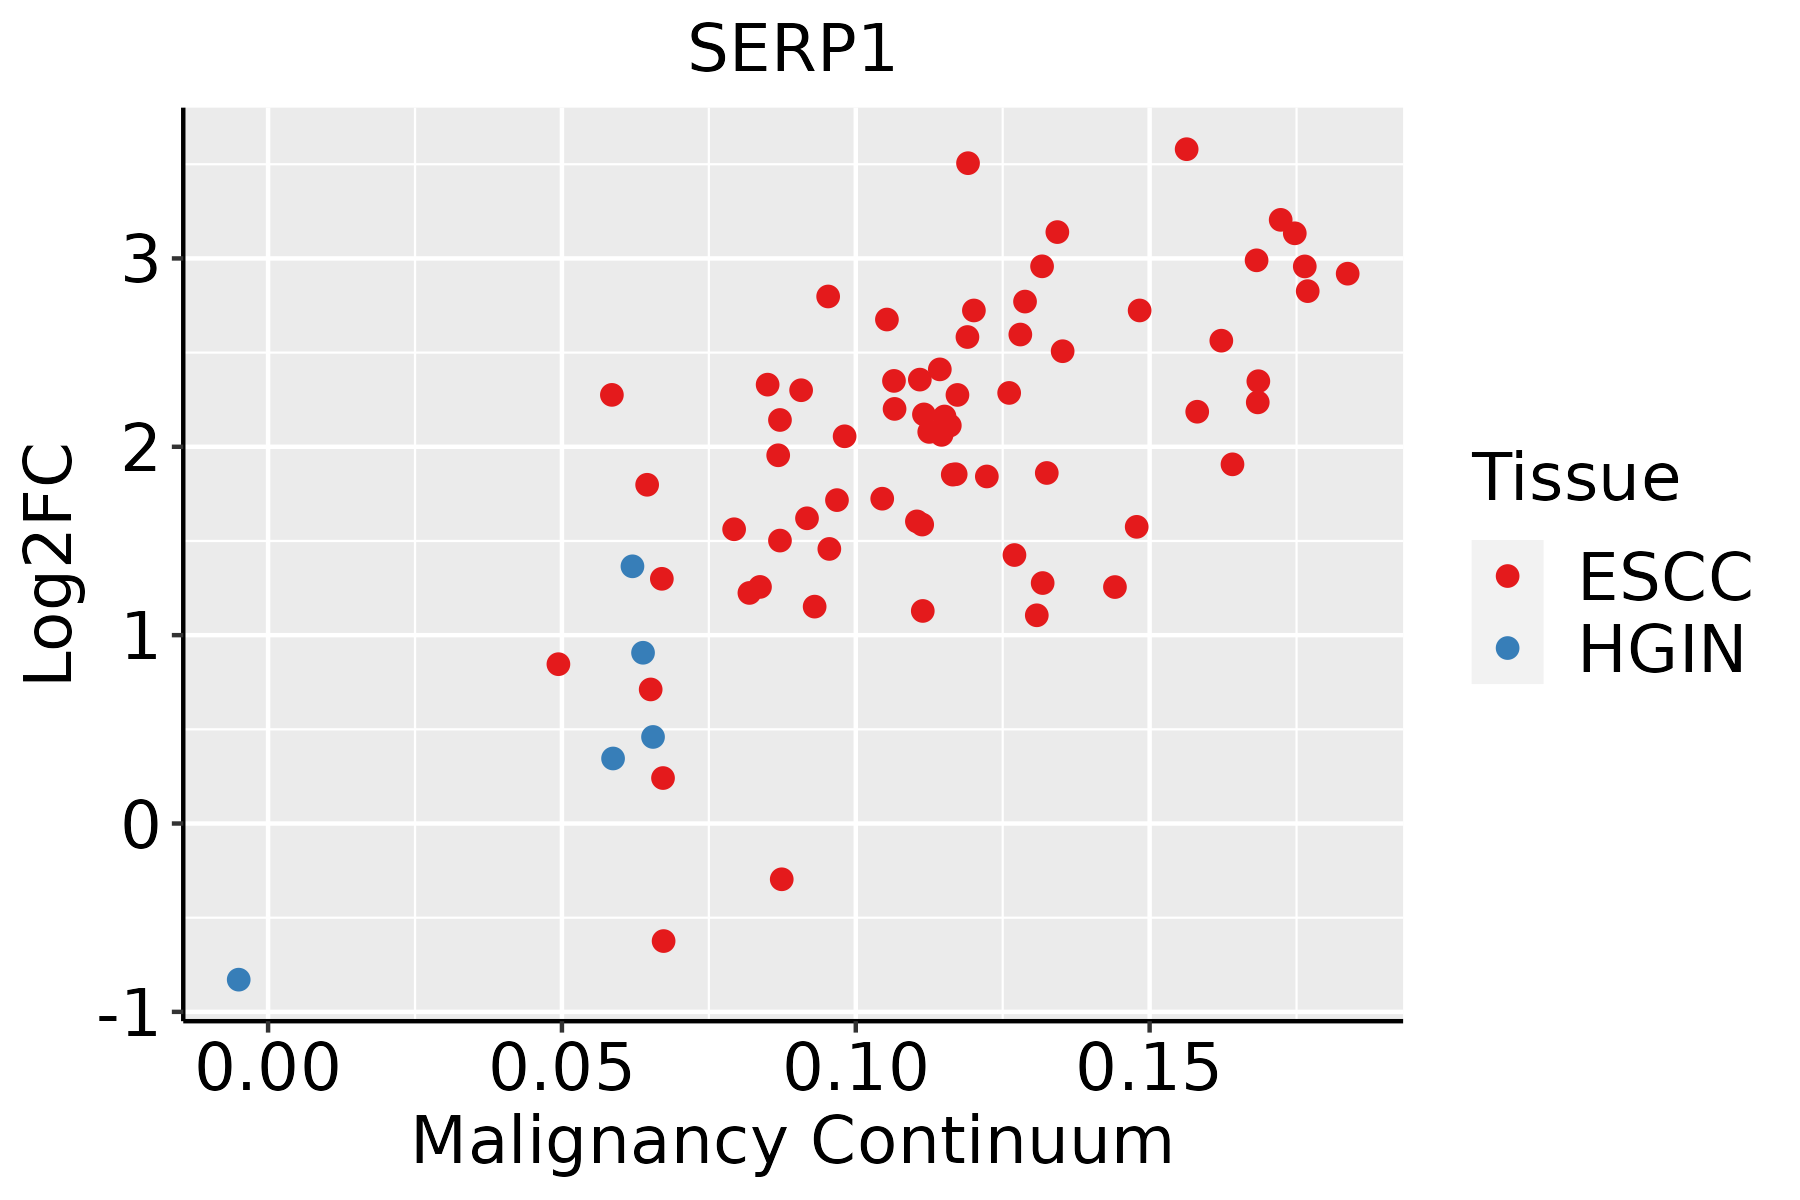 | ESCC: Esophageal squamous cell carcinoma |
| HGIN: High-grade intraepithelial neoplasias | ||
| LGIN: Low-grade intraepithelial neoplasias | ||
| Liver |  | HCC: Hepatocellular carcinoma |
| NAFLD: Non-alcoholic fatty liver disease | ||
| Oral Cavity | 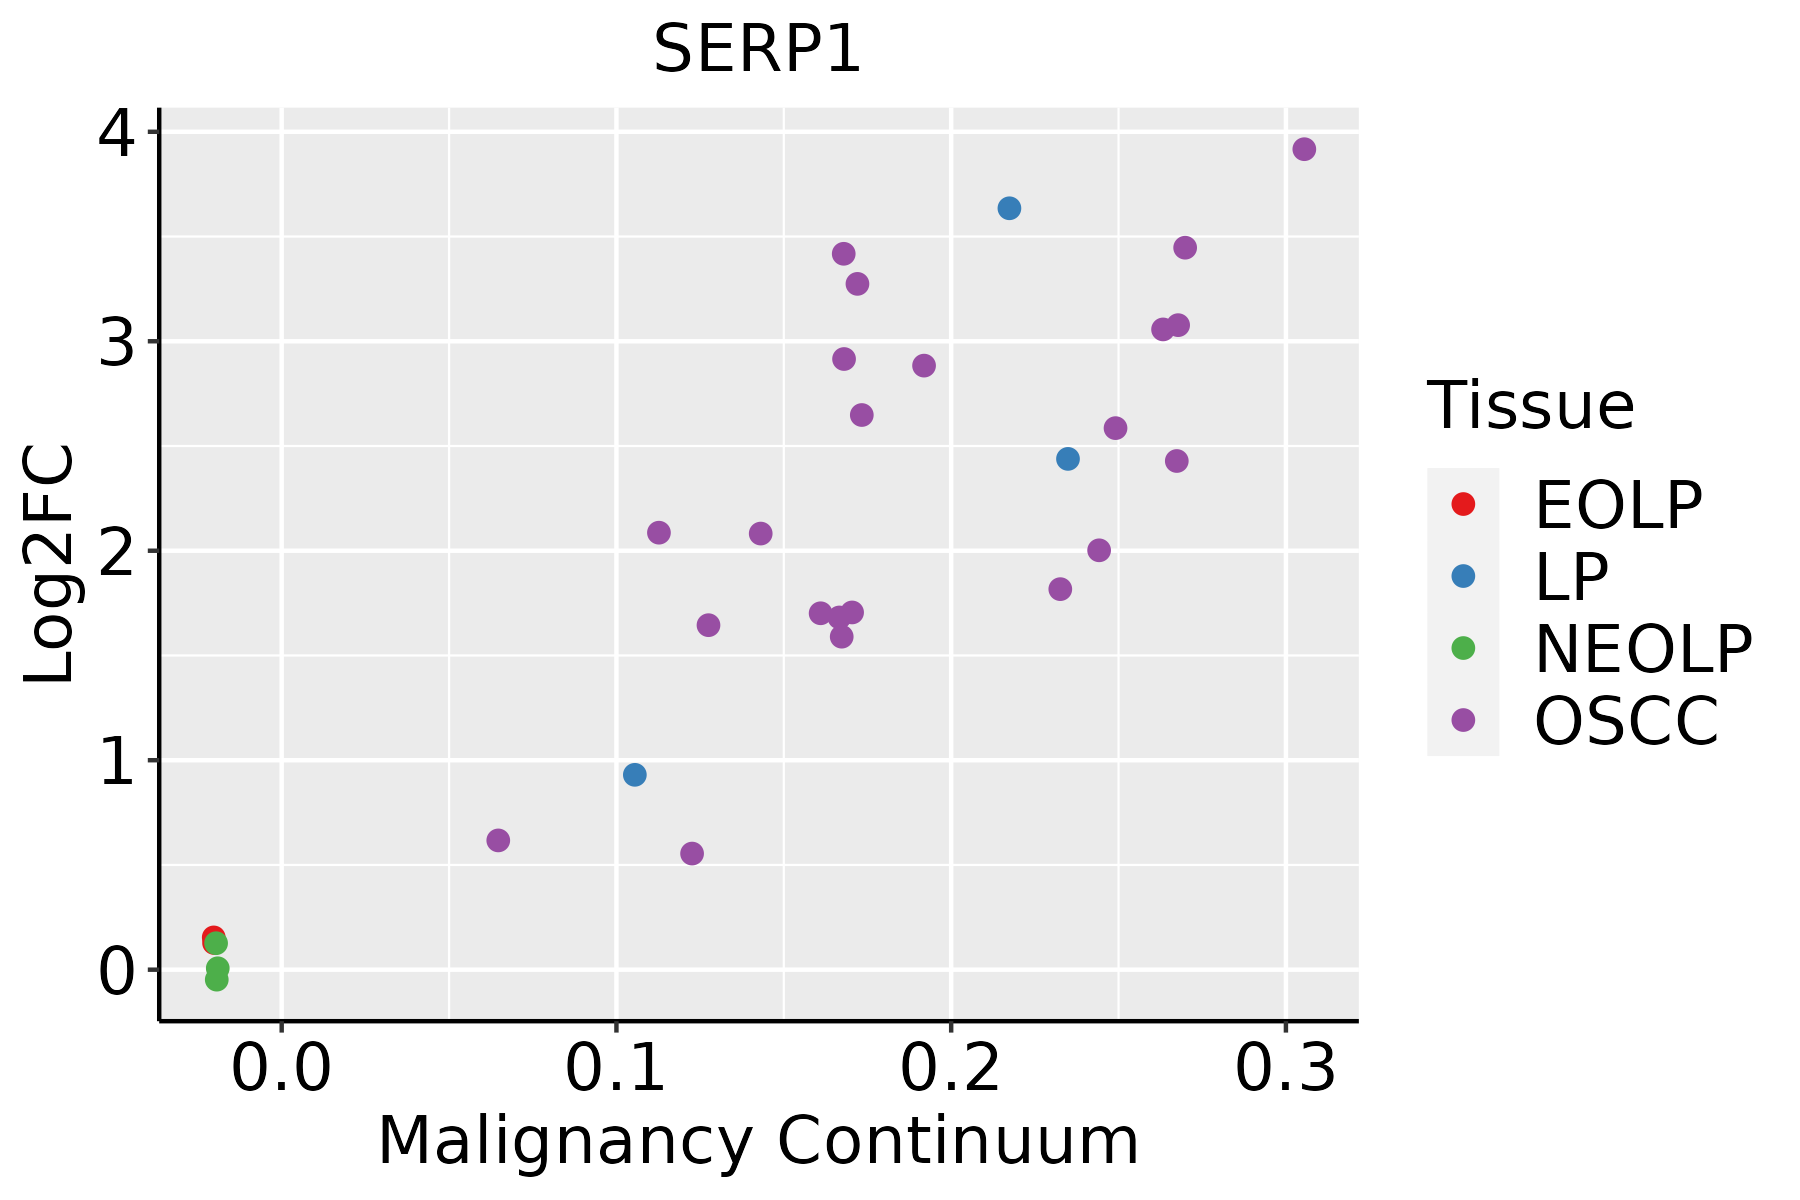 | EOLP: Erosive Oral lichen planus |
| LP: leukoplakia | ||
| NEOLP: Non-erosive oral lichen planus | ||
| OSCC: Oral squamous cell carcinoma | ||
| Prostate | 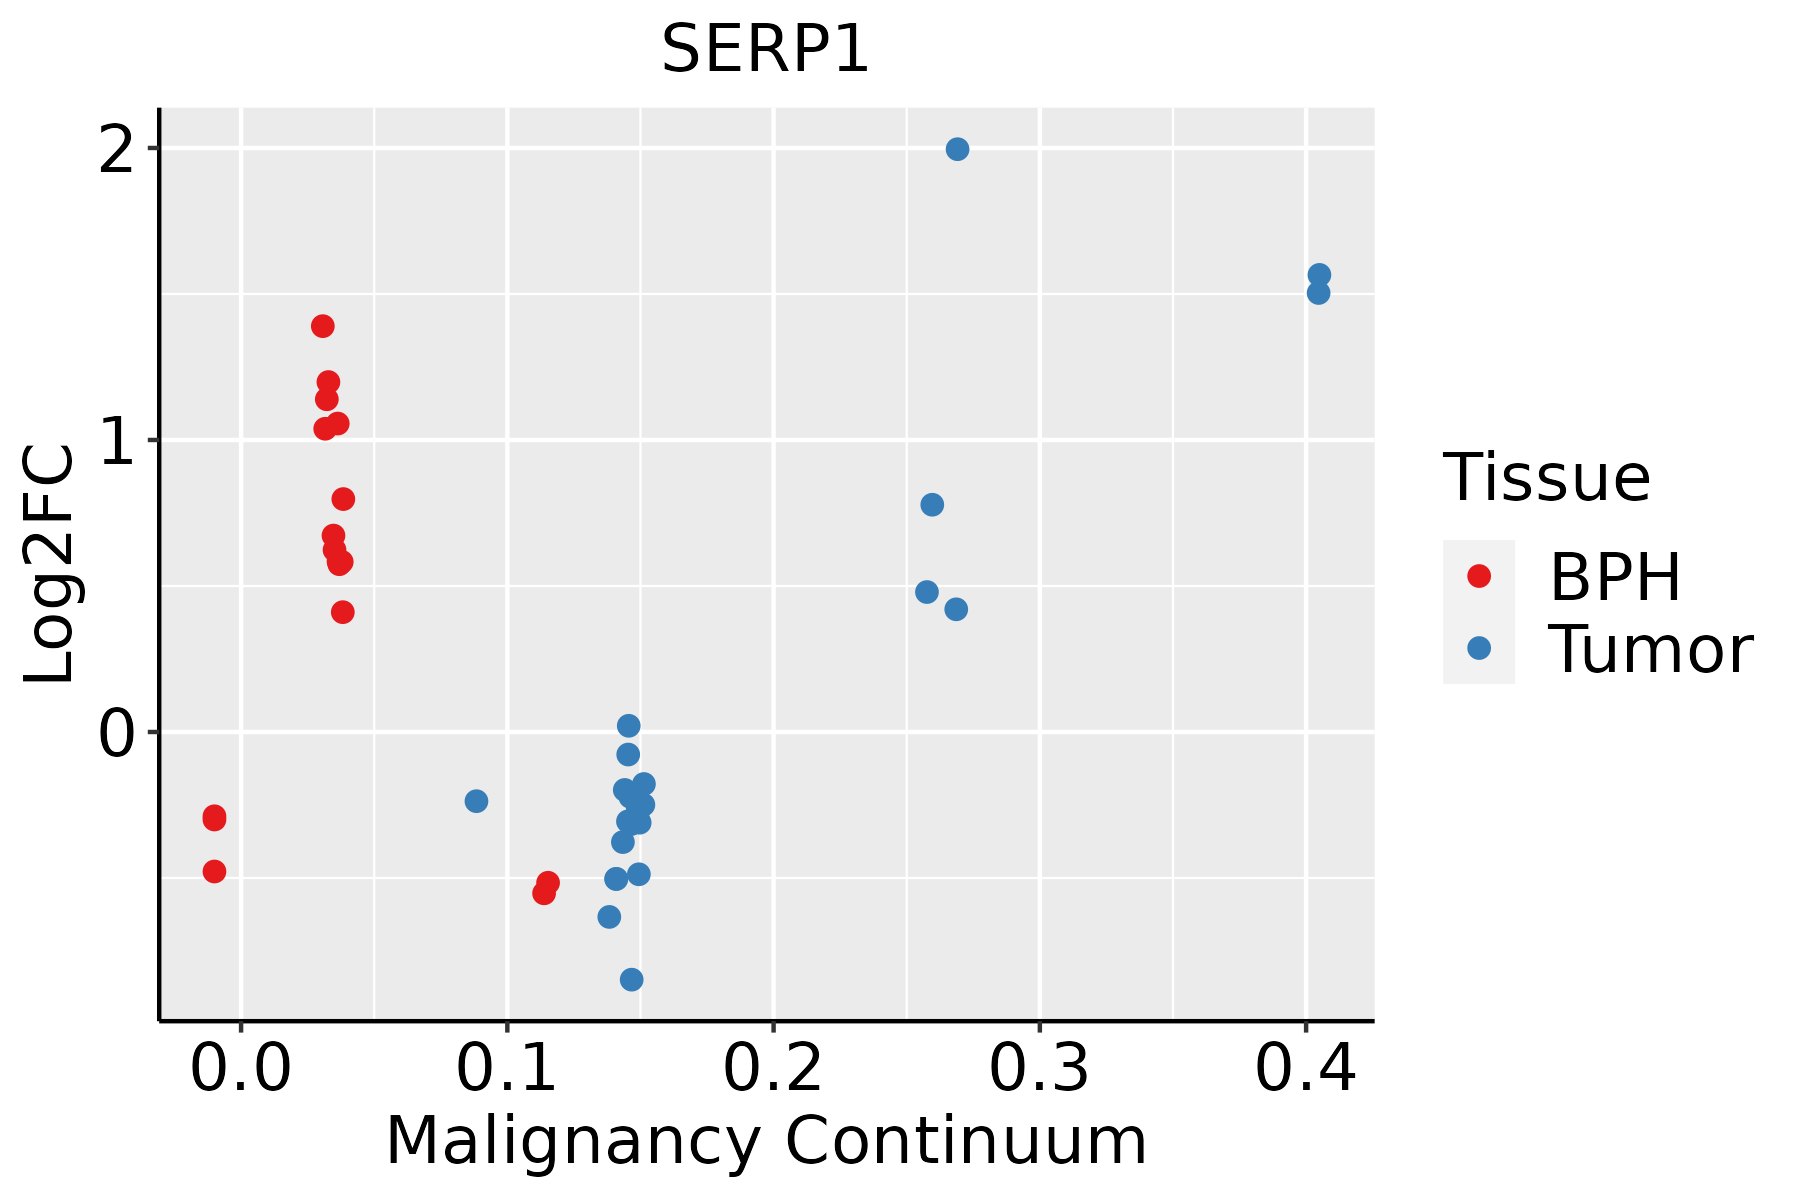 | BPH: Benign Prostatic Hyperplasia |
| Skin | 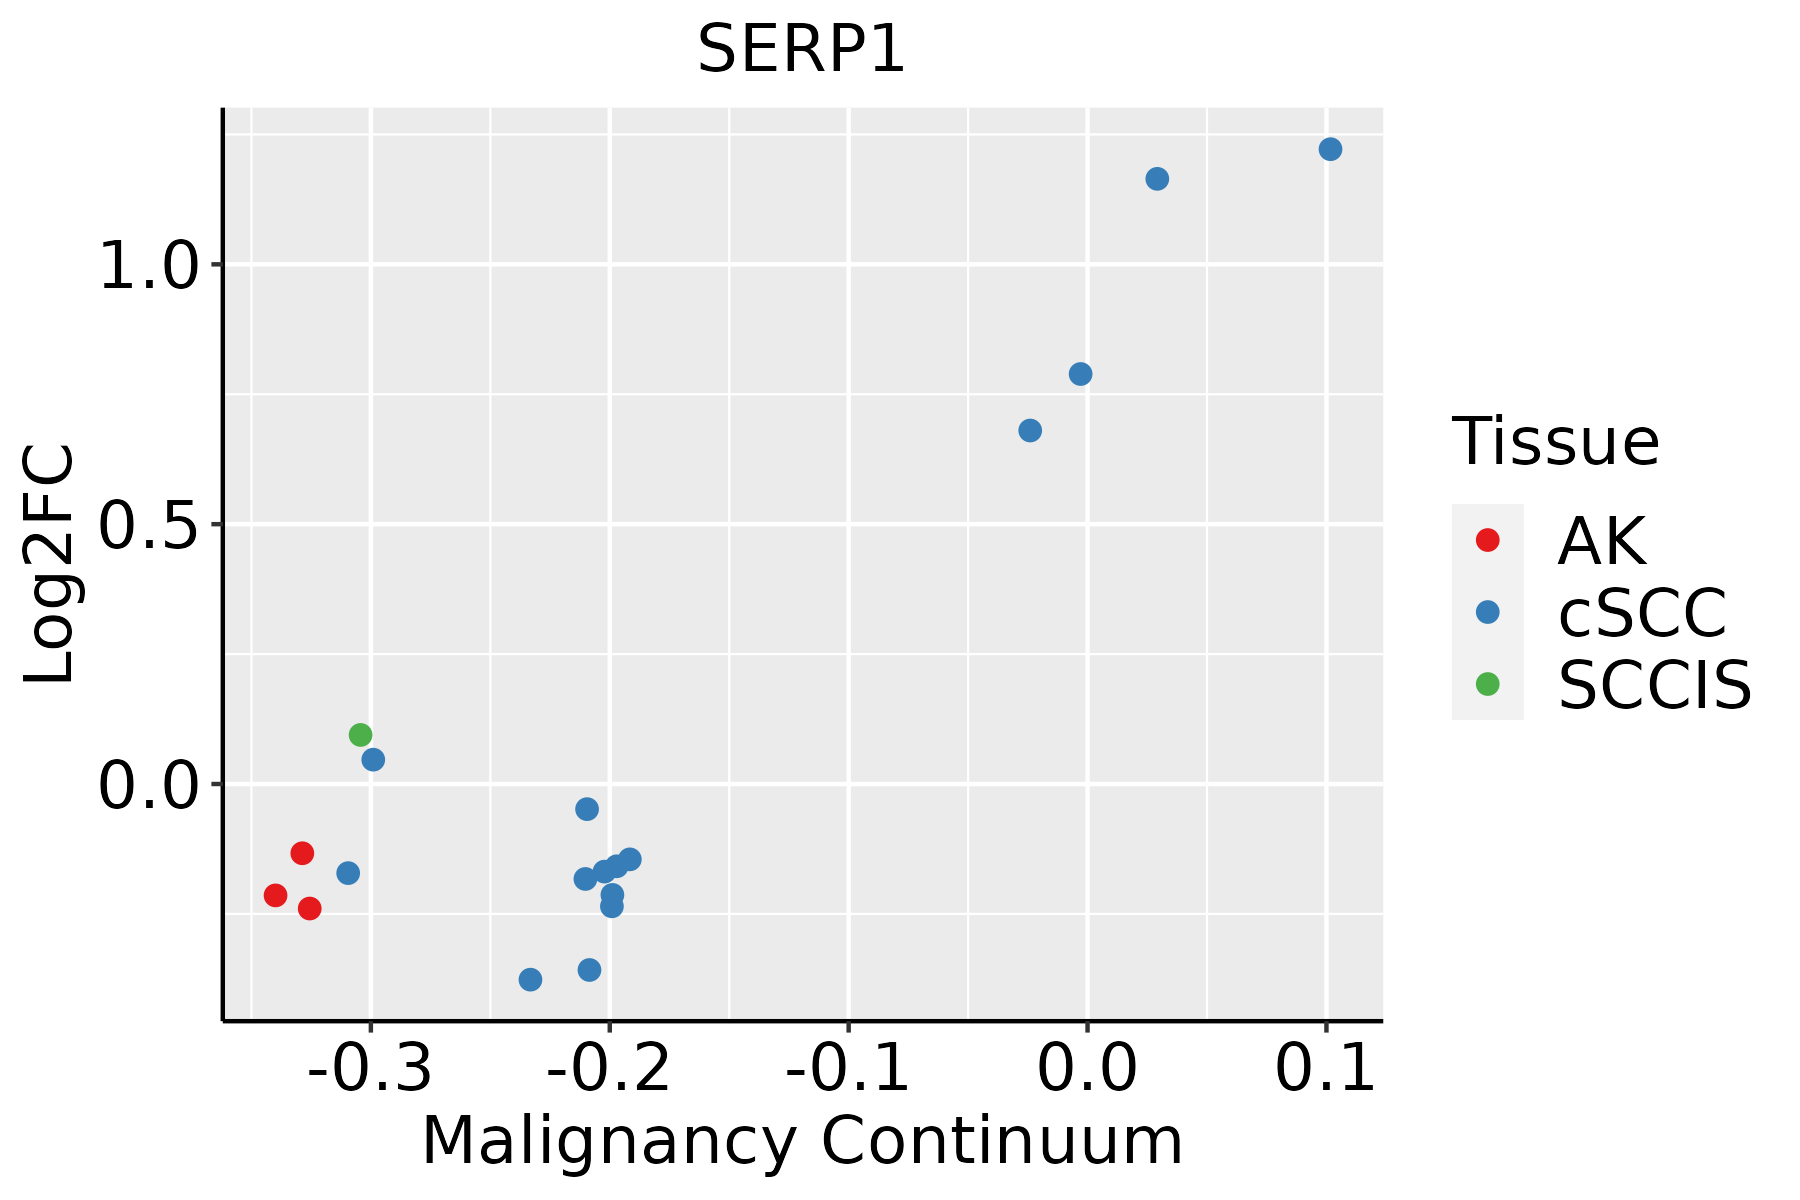 | AK: Actinic keratosis |
| cSCC: Cutaneous squamous cell carcinoma | ||
| SCCIS:squamous cell carcinoma in situ | ||
| Thyroid | 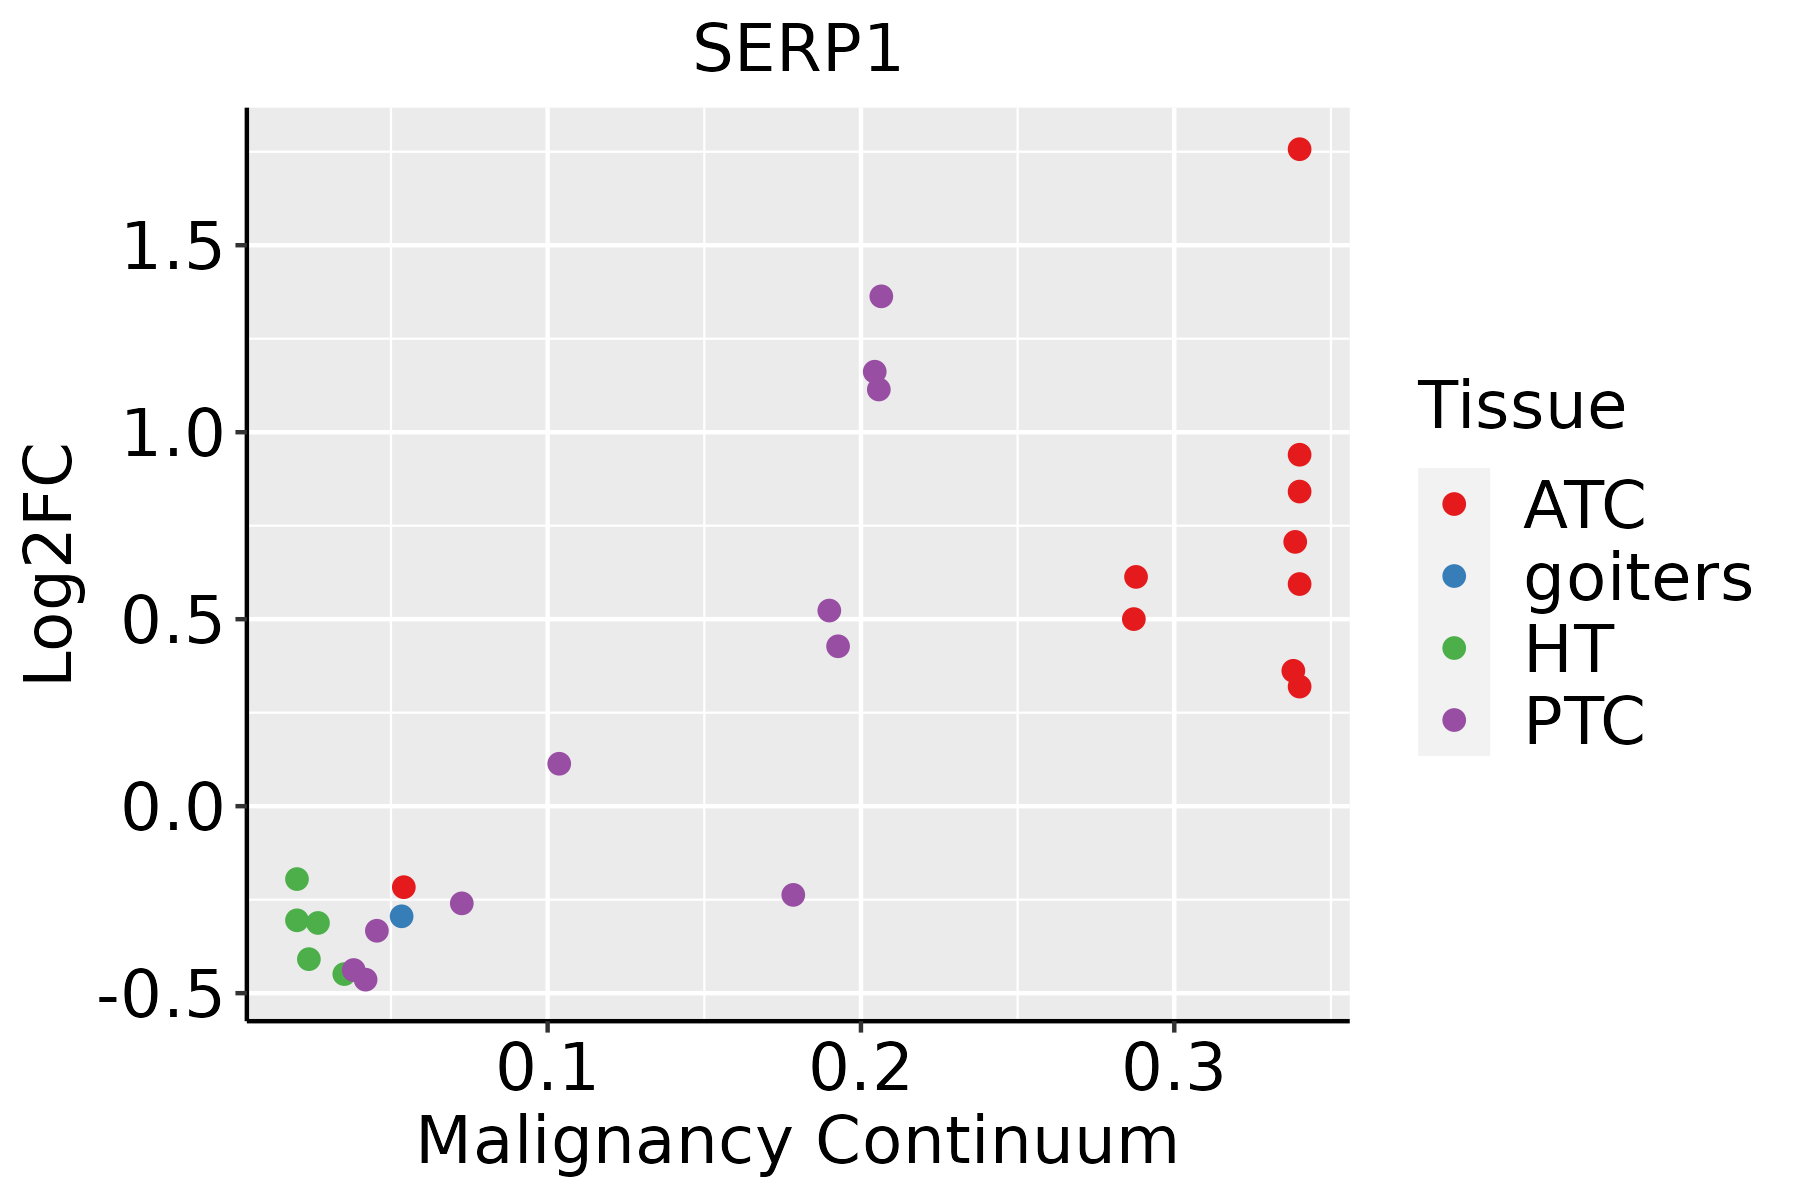 | ATC: Anaplastic thyroid cancer |
| HT: Hashimoto's thyroiditis | ||
| PTC: Papillary thyroid cancer |
| ∗log2FC in expression of this searched gene in stem-like cells from each diseased tissue sample relative to stem-like cells in normal samples in each tissue plotted against the malignancy continuum. Samples are colored based on if they are from different disease stage. |
Top |
Malignant transformation related pathway analysis |
| Find out the enriched GO biological processes and KEGG pathways involved in transition from healthy to precancer to cancer |
| Tissue | Disease Stage | Enriched GO biological Processes |
| Colorectum | AD |  |
| Colorectum | SER |  |
| Colorectum | MSS |  |
| Colorectum | MSI-H |  |
| Colorectum | FAP |  |
| ∗Top 15 enriched GO BP terms are showed in the bar plot of each disease state in each tissue. Each row represents a significant GO biological process which is colored according to the -log10(p.adjust). |
| Page: 1 2 3 4 5 6 7 8 9 |
| GO ID | Tissue | Disease Stage | Description | Gene Ratio | Bg Ratio | pvalue | p.adjust | Count |
| GO:00064179 | Breast | Precancer | regulation of translation | 67/1080 | 468/18723 | 4.71e-12 | 7.64e-10 | 67 |
| GO:00457279 | Breast | Precancer | positive regulation of translation | 32/1080 | 136/18723 | 5.89e-12 | 9.27e-10 | 32 |
| GO:00342509 | Breast | Precancer | positive regulation of cellular amide metabolic process | 33/1080 | 162/18723 | 1.72e-10 | 1.77e-08 | 33 |
| GO:00069869 | Breast | Precancer | response to unfolded protein | 28/1080 | 137/18723 | 3.81e-09 | 3.00e-07 | 28 |
| GO:00359669 | Breast | Precancer | response to topologically incorrect protein | 29/1080 | 159/18723 | 3.00e-08 | 1.89e-06 | 29 |
| GO:00349769 | Breast | Precancer | response to endoplasmic reticulum stress | 38/1080 | 256/18723 | 7.89e-08 | 4.60e-06 | 38 |
| GO:00346209 | Breast | Precancer | cellular response to unfolded protein | 21/1080 | 96/18723 | 9.80e-08 | 5.46e-06 | 21 |
| GO:00359679 | Breast | Precancer | cellular response to topologically incorrect protein | 22/1080 | 116/18723 | 6.84e-07 | 2.80e-05 | 22 |
| GO:00075688 | Breast | Precancer | aging | 41/1080 | 339/18723 | 5.95e-06 | 1.71e-04 | 41 |
| GO:00309687 | Breast | Precancer | endoplasmic reticulum unfolded protein response | 15/1080 | 74/18723 | 1.74e-05 | 4.17e-04 | 15 |
| GO:19049519 | Breast | Precancer | positive regulation of establishment of protein localization | 36/1080 | 319/18723 | 9.30e-05 | 1.75e-03 | 36 |
| GO:00060066 | Breast | Precancer | glucose metabolic process | 23/1080 | 196/18723 | 9.54e-04 | 1.07e-02 | 23 |
| GO:00512229 | Breast | Precancer | positive regulation of protein transport | 31/1080 | 303/18723 | 1.44e-03 | 1.50e-02 | 31 |
| GO:00507086 | Breast | Precancer | regulation of protein secretion | 28/1080 | 268/18723 | 1.76e-03 | 1.74e-02 | 28 |
| GO:00059966 | Breast | Precancer | monosaccharide metabolic process | 27/1080 | 257/18723 | 1.94e-03 | 1.88e-02 | 27 |
| GO:00193186 | Breast | Precancer | hexose metabolic process | 25/1080 | 237/18723 | 2.64e-03 | 2.36e-02 | 25 |
| GO:00158336 | Breast | Precancer | peptide transport | 27/1080 | 264/18723 | 2.84e-03 | 2.49e-02 | 27 |
| GO:00900875 | Breast | Precancer | regulation of peptide transport | 22/1080 | 202/18723 | 3.14e-03 | 2.65e-02 | 22 |
| GO:00300736 | Breast | Precancer | insulin secretion | 21/1080 | 195/18723 | 4.38e-03 | 3.42e-02 | 21 |
| GO:00716926 | Breast | Precancer | protein localization to extracellular region | 34/1080 | 368/18723 | 4.65e-03 | 3.58e-02 | 34 |
| Page: 1 2 3 4 5 6 7 8 9 10 11 12 13 14 15 16 17 18 19 20 21 22 23 24 25 26 27 28 29 |
| Pathway ID | Tissue | Disease Stage | Description | Gene Ratio | Bg Ratio | pvalue | p.adjust | qvalue | Count |
| Page: 1 |
Top |
Cell-cell communication analysis |
| Identification of potential cell-cell interactions between two cell types and their ligand-receptor pairs for different disease states |
| Ligand | Receptor | LRpair | Pathway | Tissue | Disease Stage |
| Page: 1 |
Top |
Single-cell gene regulatory network inference analysis |
| Find out the significant the regulons (TFs) and the target genes of each regulon across cell types for different disease states |
| TF | Cell Type | Tissue | Disease Stage | Target Gene | RSS | Regulon Activity |
| ∗The dot plots of a searched regulon are shown for all cell subpopulations in each disease state of each tissue based on the regulon specific score inferred using pySCENIC and by calculating the average expression. |
| Page: 1 |
Top |
Somatic mutation of malignant transformation related genes |
| Annotation of somatic variants for genes involved in malignant transformation |
| Hugo Symbol | Variant Class | Variant Classification | dbSNP RS | HGVSc | HGVSp | HGVSp Short | SWISSPROT | BIOTYPE | SIFT | PolyPhen | Tumor Sample Barcode | Tissue | Histology | Sex | Age | Stage | Therapy Types | Drugs | Outcome |
| SERP1 | SNV | Missense_Mutation | c.194N>T | p.Gly65Val | p.G65V | Q9Y6X1 | protein_coding | deleterious(0) | probably_damaging(0.998) | TCGA-AA-3877-01 | Colorectum | colon adenocarcinoma | Female | >=65 | I/II | Unknown | Unknown | SD | |
| SERP1 | SNV | Missense_Mutation | c.86G>T | p.Arg29Ile | p.R29I | Q9Y6X1 | protein_coding | deleterious(0.03) | benign(0.017) | TCGA-D1-A16X-01 | Endometrium | uterine corpus endometrioid carcinoma | Female | <65 | I/II | Unknown | Unknown | SD | |
| SERP1 | SNV | Missense_Mutation | novel | c.130N>A | p.Ala44Thr | p.A44T | Q9Y6X1 | protein_coding | deleterious(0) | probably_damaging(0.999) | TCGA-EO-A22R-01 | Endometrium | uterine corpus endometrioid carcinoma | Female | <65 | I/II | Unknown | Unknown | SD |
| SERP1 | SNV | Missense_Mutation | novel | c.50N>G | p.Asn17Ser | p.N17S | Q9Y6X1 | protein_coding | deleterious(0.03) | possibly_damaging(0.484) | TCGA-EO-A22X-01 | Endometrium | uterine corpus endometrioid carcinoma | Female | <65 | III/IV | Unspecific | Carboplatin | Complete Response |
| SERP1 | SNV | Missense_Mutation | novel | c.143N>C | p.Phe48Ser | p.F48S | Q9Y6X1 | protein_coding | deleterious(0) | probably_damaging(0.999) | TCGA-EY-A1GI-01 | Endometrium | uterine corpus endometrioid carcinoma | Female | <65 | I/II | Unknown | Unknown | SD |
| SERP1 | SNV | Missense_Mutation | novel | c.163N>G | p.Ile55Val | p.I55V | Q9Y6X1 | protein_coding | tolerated(0.54) | benign(0.011) | TCGA-DD-AAE7-01 | Liver | liver hepatocellular carcinoma | Male | >=65 | I/II | Unknown | Unknown | SD |
| SERP1 | SNV | Missense_Mutation | c.39G>T | p.Lys13Asn | p.K13N | Q9Y6X1 | protein_coding | deleterious(0.01) | probably_damaging(0.911) | TCGA-85-6560-01 | Lung | lung squamous cell carcinoma | Male | <65 | I/II | Chemotherapy | cisplatin | SD |
| Page: 1 |
Top |
Related drugs of malignant transformation related genes |
| Identification of chemicals and drugs interact with genes involved in malignant transfromation |
| (DGIdb 4.0) |
| Entrez ID | Symbol | Category | Interaction Types | Drug Claim Name | Drug Name | PMIDs |
| Page: 1 |

Copyright 2023-Present -The University of Texas Health Science Center at Houston |