
|
|||||
|
 | |
| |
| |
| |
| |
| |
|
Gene: SERINC5 |
Gene summary for SERINC5 |
| Gene information | Species | Human | Gene symbol | SERINC5 | Gene ID | 256987 |
| Gene name | serine incorporator 5 | |
| Gene Alias | C5orf12 | |
| Cytomap | 5q14.1 | |
| Gene Type | protein-coding | GO ID | GO:0002376 | UniProtAcc | Q86VE9 |
Top |
Malignant transformation analysis |
| Identification of the aberrant gene expression in precancerous and cancerous lesions by comparing the gene expression of stem-like cells in diseased tissues with normal stem cells |
| Entrez ID | Symbol | Replicates | Species | Organ | Tissue | Adj P-value | Log2FC | Malignancy |
| 256987 | SERINC5 | CCI_1 | Human | Cervix | CC | 4.05e-05 | 8.22e-01 | 0.528 |
| 256987 | SERINC5 | CCI_2 | Human | Cervix | CC | 6.50e-18 | 1.79e+00 | 0.5249 |
| 256987 | SERINC5 | CCI_3 | Human | Cervix | CC | 4.68e-14 | 1.13e+00 | 0.516 |
| 256987 | SERINC5 | HTA11_1938_2000001011 | Human | Colorectum | AD | 3.04e-06 | 5.59e-01 | -0.0811 |
| 256987 | SERINC5 | HTA11_78_2000001011 | Human | Colorectum | AD | 8.35e-04 | 5.44e-01 | -0.1088 |
| 256987 | SERINC5 | HTA11_347_2000001011 | Human | Colorectum | AD | 8.12e-24 | 8.79e-01 | -0.1954 |
| 256987 | SERINC5 | HTA11_9341_2000001011 | Human | Colorectum | SER | 2.67e-03 | -5.49e-01 | -0.00410000000000005 |
| 256987 | SERINC5 | HTA11_866_3004761011 | Human | Colorectum | AD | 1.02e-02 | 4.38e-01 | 0.096 |
| 256987 | SERINC5 | HTA11_99999965062_69753 | Human | Colorectum | MSI-H | 1.23e-06 | 8.65e-01 | 0.3487 |
| 256987 | SERINC5 | HTA11_99999965104_69814 | Human | Colorectum | MSS | 6.71e-08 | 6.48e-01 | 0.281 |
| 256987 | SERINC5 | HTA11_99999971662_82457 | Human | Colorectum | MSS | 1.77e-06 | 8.09e-01 | 0.3859 |
| 256987 | SERINC5 | A002-C-010 | Human | Colorectum | FAP | 2.69e-03 | 1.43e-01 | 0.242 |
| 256987 | SERINC5 | A015-C-203 | Human | Colorectum | FAP | 3.42e-36 | -4.53e-01 | -0.1294 |
| 256987 | SERINC5 | A015-C-204 | Human | Colorectum | FAP | 2.54e-06 | -4.23e-01 | -0.0228 |
| 256987 | SERINC5 | A014-C-040 | Human | Colorectum | FAP | 3.71e-03 | -1.08e-01 | -0.1184 |
| 256987 | SERINC5 | A002-C-201 | Human | Colorectum | FAP | 1.46e-12 | -2.52e-01 | 0.0324 |
| 256987 | SERINC5 | A001-C-119 | Human | Colorectum | FAP | 2.96e-08 | -3.49e-01 | -0.1557 |
| 256987 | SERINC5 | A001-C-108 | Human | Colorectum | FAP | 4.08e-20 | -3.76e-01 | -0.0272 |
| 256987 | SERINC5 | A002-C-021 | Human | Colorectum | FAP | 4.72e-09 | 3.62e-01 | 0.1171 |
| 256987 | SERINC5 | A002-C-205 | Human | Colorectum | FAP | 6.80e-29 | -5.24e-01 | -0.1236 |
| Page: 1 2 3 4 5 6 7 8 9 |
| Tissue | Expression Dynamics | Abbreviation |
| Cervix |  | CC: Cervix cancer |
| HSIL_HPV: HPV-infected high-grade squamous intraepithelial lesions | ||
| N_HPV: HPV-infected normal cervix | ||
| Colorectum (GSE201348) |  | FAP: Familial adenomatous polyposis |
| CRC: Colorectal cancer | ||
| Colorectum (HTA11) |  | AD: Adenomas |
| SER: Sessile serrated lesions | ||
| MSI-H: Microsatellite-high colorectal cancer | ||
| MSS: Microsatellite stable colorectal cancer | ||
| Endometrium | 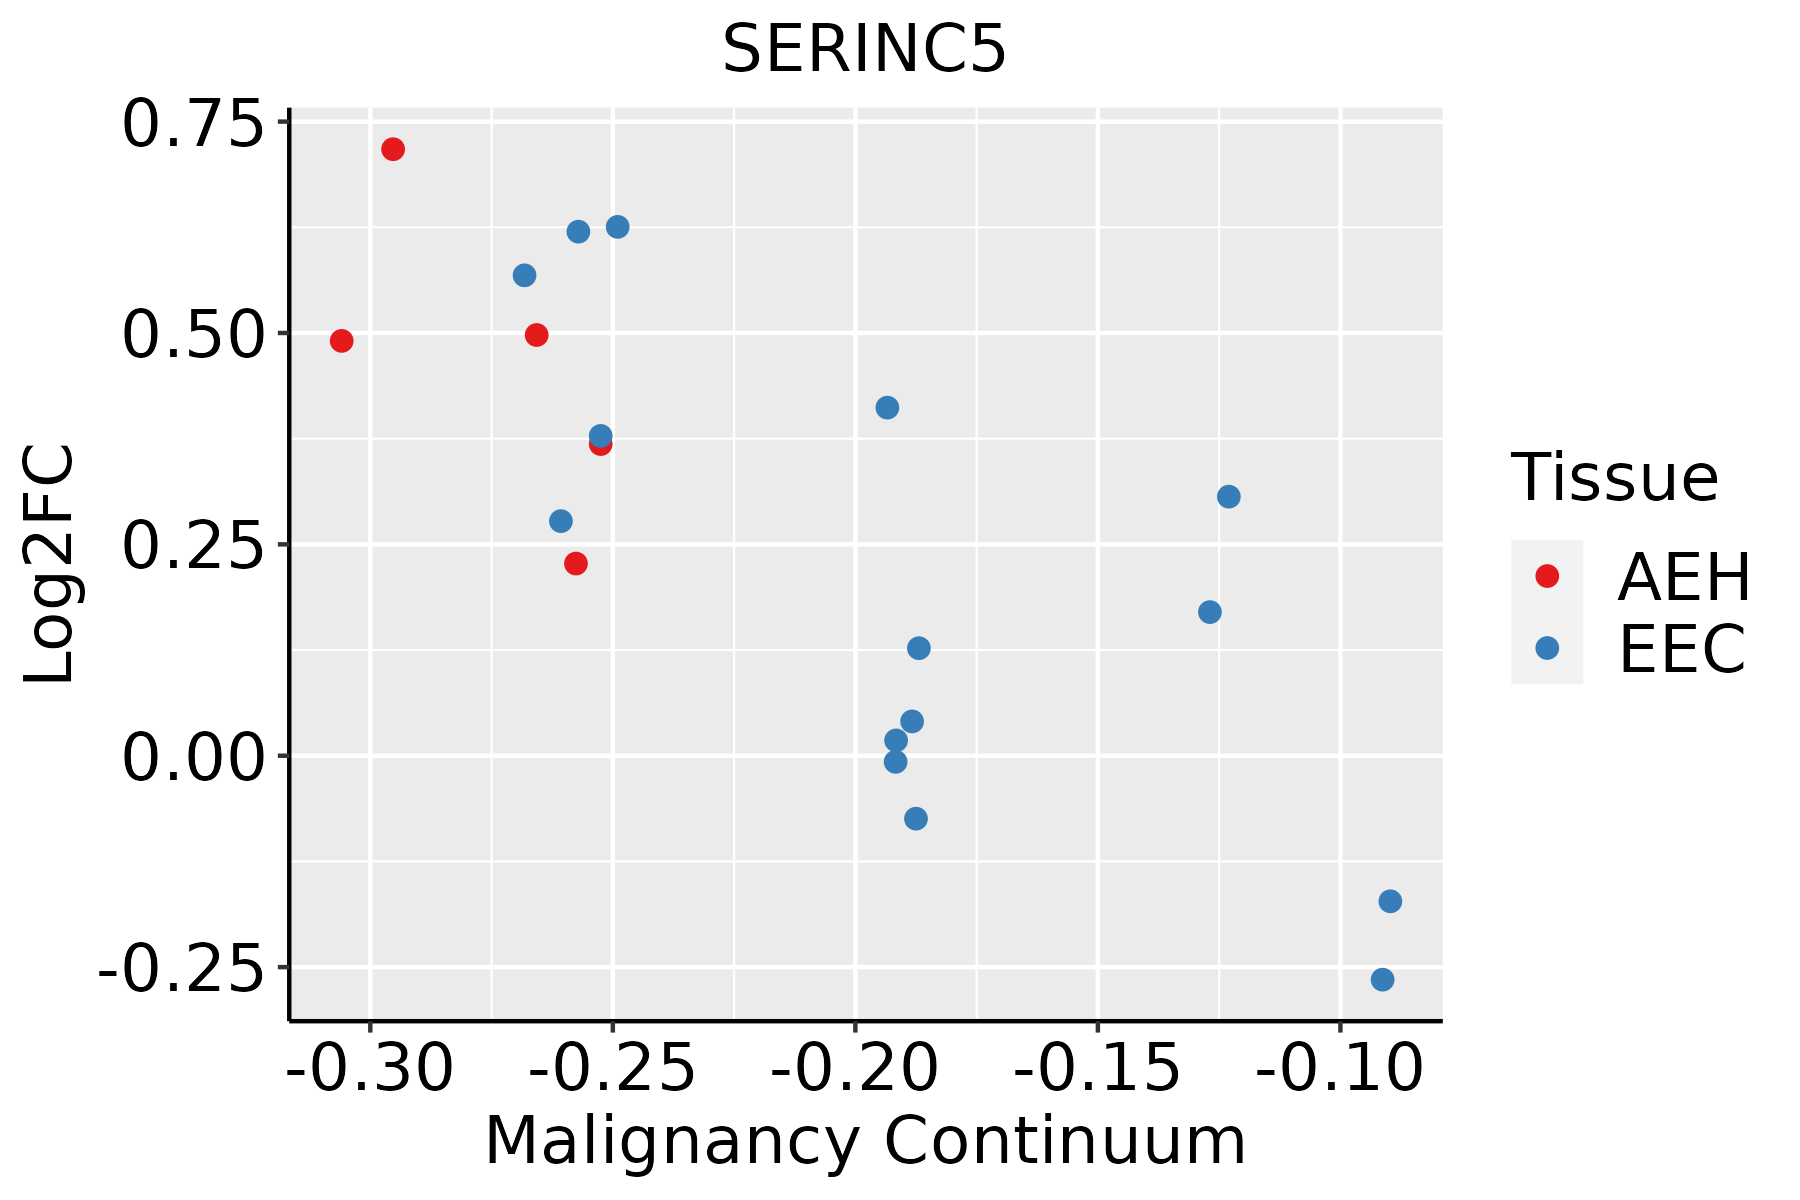 | AEH: Atypical endometrial hyperplasia |
| EEC: Endometrioid Cancer | ||
| Esophagus | 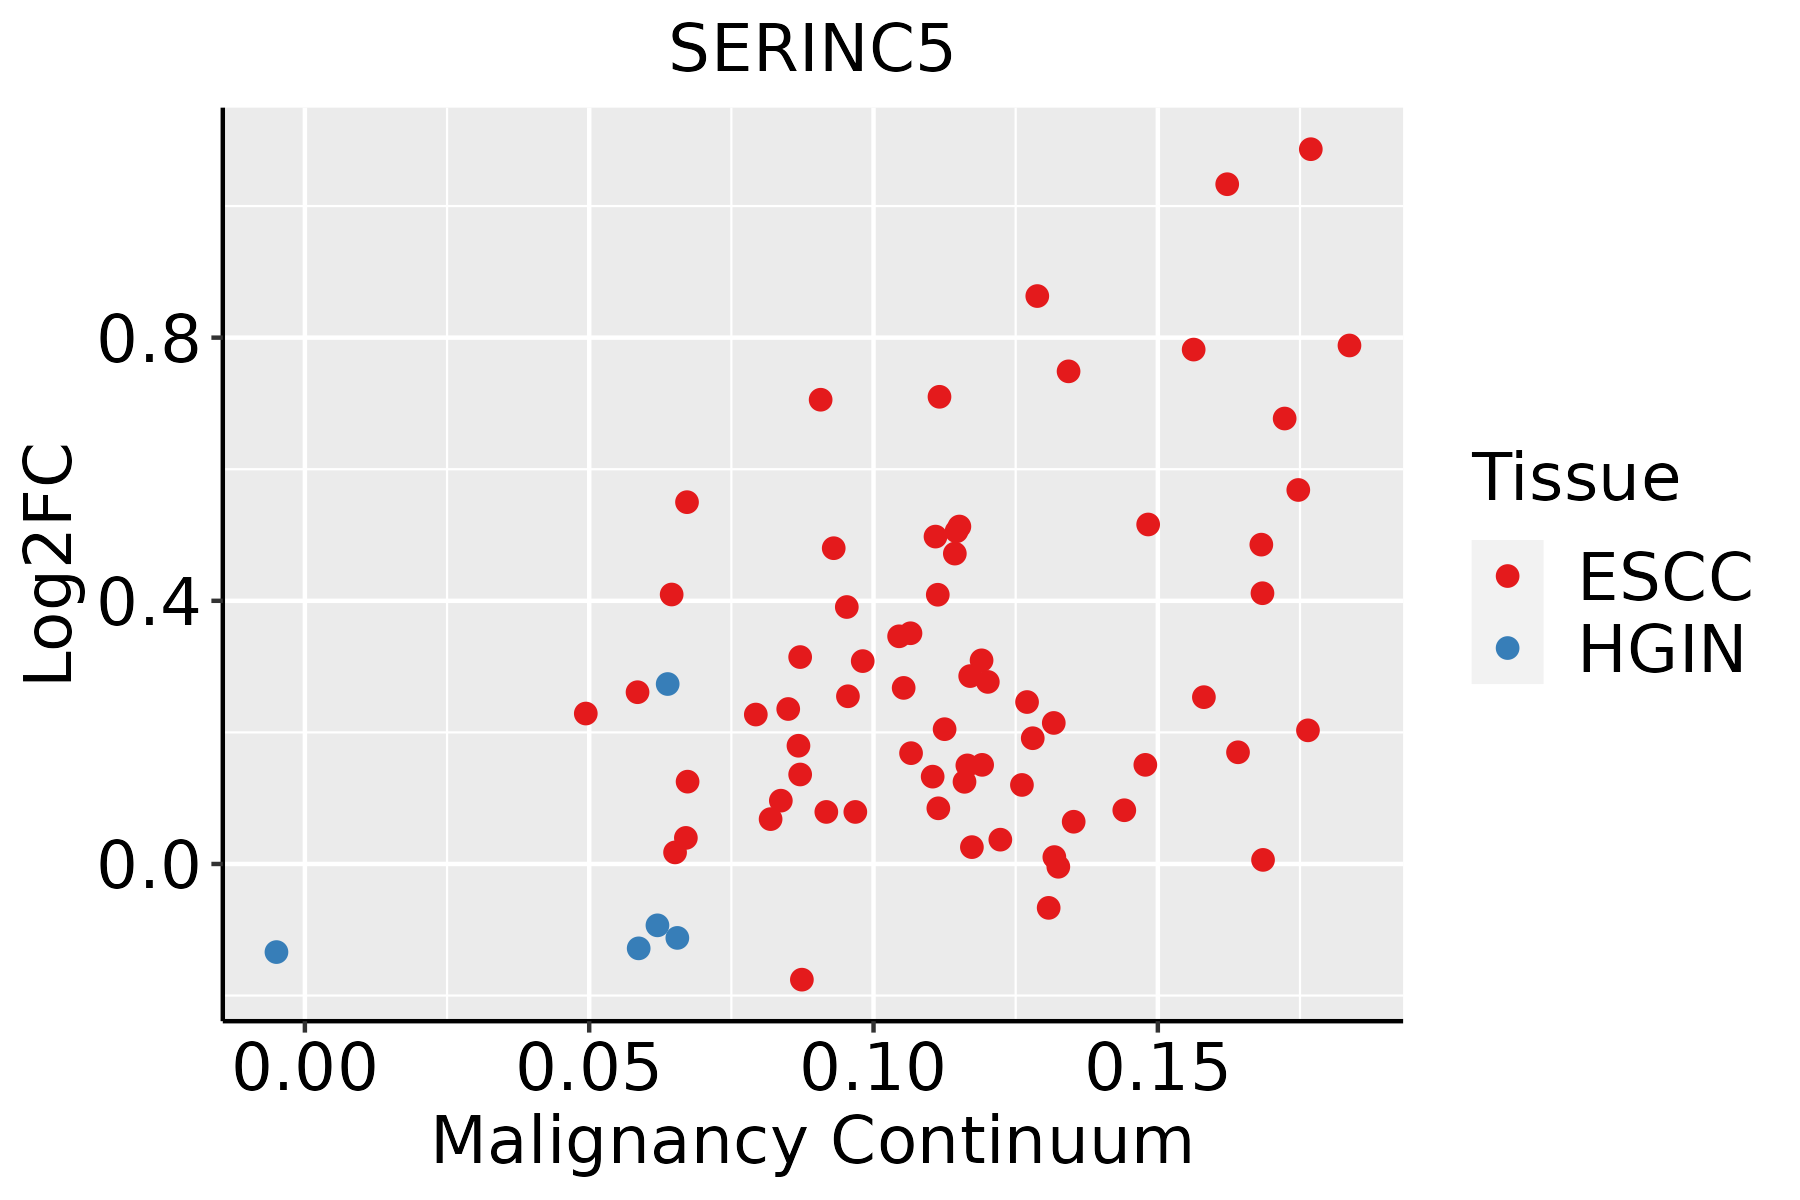 | ESCC: Esophageal squamous cell carcinoma |
| HGIN: High-grade intraepithelial neoplasias | ||
| LGIN: Low-grade intraepithelial neoplasias | ||
| Liver |  | HCC: Hepatocellular carcinoma |
| NAFLD: Non-alcoholic fatty liver disease | ||
| Lung |  | AAH: Atypical adenomatous hyperplasia |
| AIS: Adenocarcinoma in situ | ||
| IAC: Invasive lung adenocarcinoma | ||
| MIA: Minimally invasive adenocarcinoma | ||
| Oral Cavity | 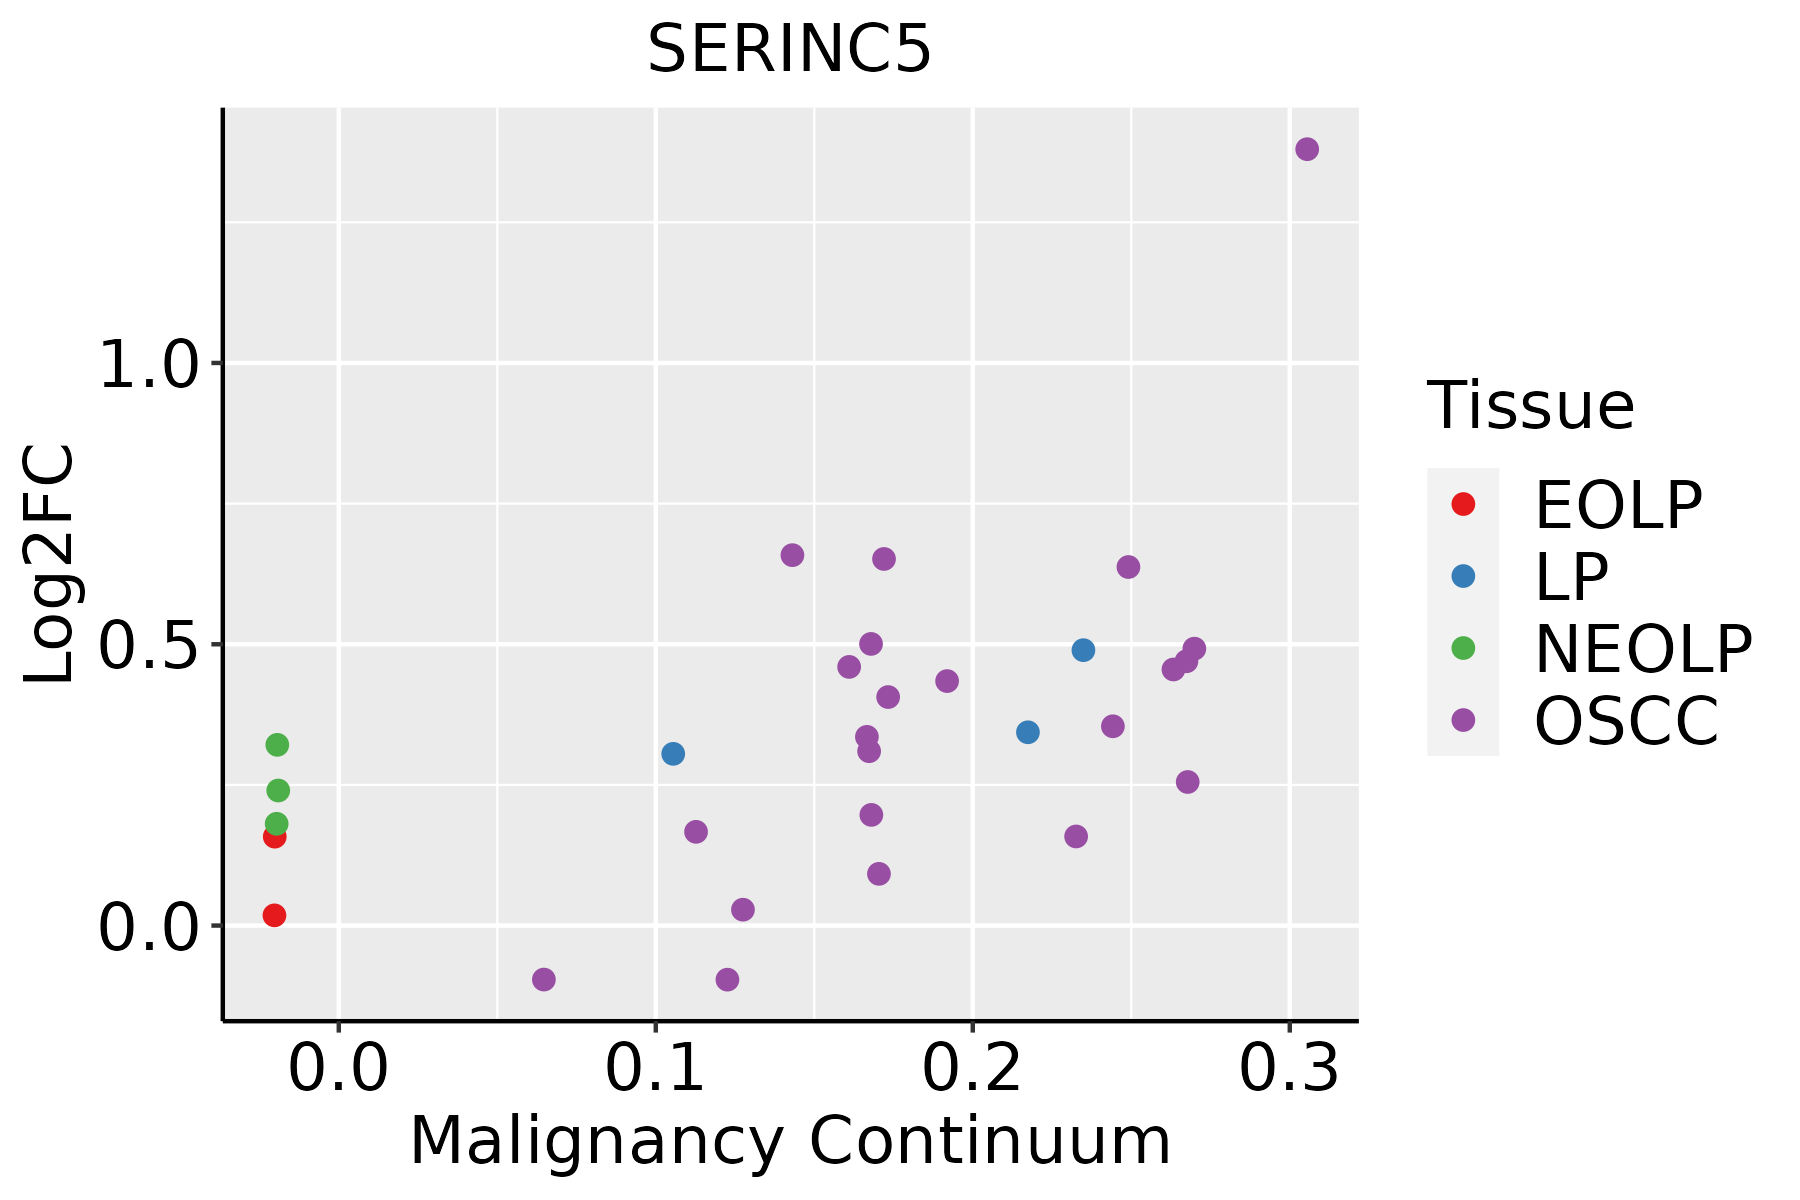 | EOLP: Erosive Oral lichen planus |
| LP: leukoplakia | ||
| NEOLP: Non-erosive oral lichen planus | ||
| OSCC: Oral squamous cell carcinoma | ||
| Prostate |  | BPH: Benign Prostatic Hyperplasia |
| Thyroid | 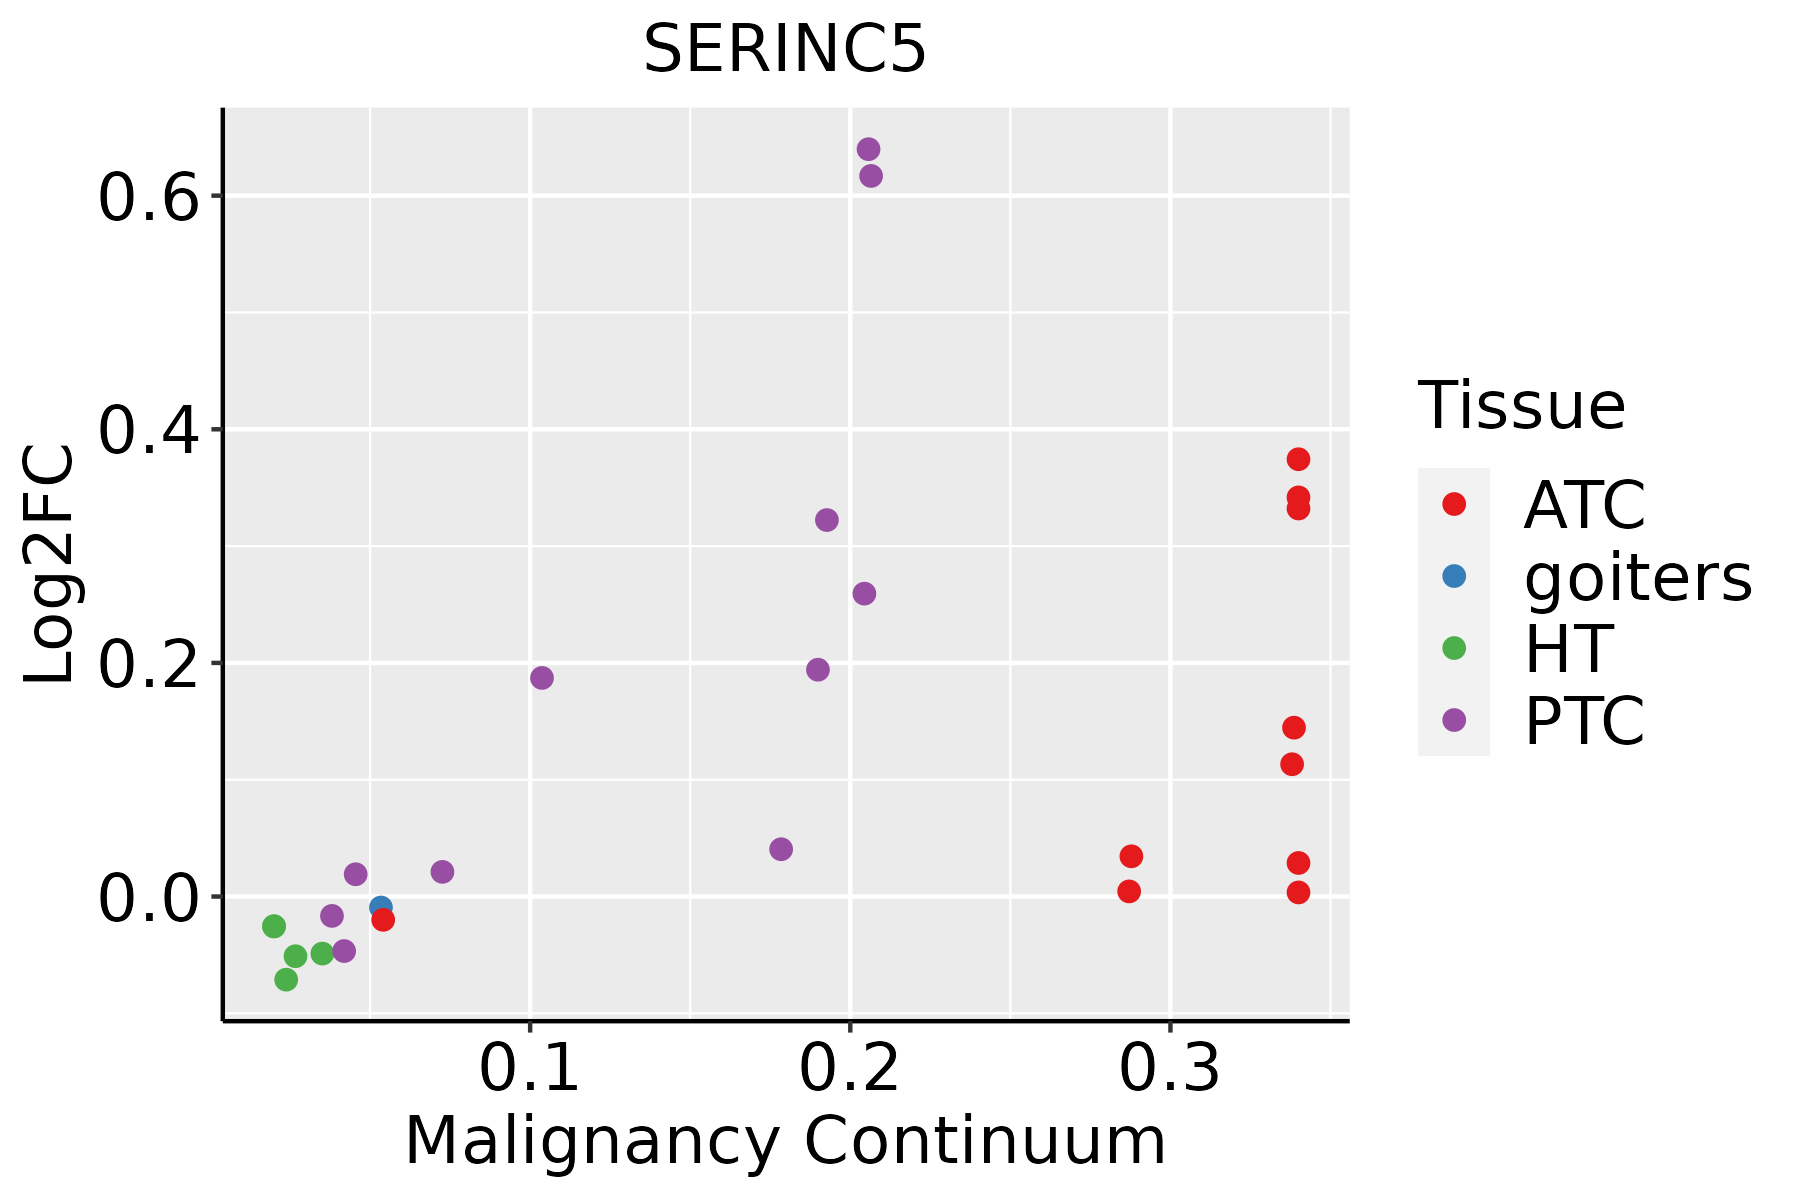 | ATC: Anaplastic thyroid cancer |
| HT: Hashimoto's thyroiditis | ||
| PTC: Papillary thyroid cancer |
| ∗log2FC in expression of this searched gene in stem-like cells from each diseased tissue sample relative to stem-like cells in normal samples in each tissue plotted against the malignancy continuum. Samples are colored based on if they are from different disease stage. |
Top |
Malignant transformation related pathway analysis |
| Find out the enriched GO biological processes and KEGG pathways involved in transition from healthy to precancer to cancer |
| Tissue | Disease Stage | Enriched GO biological Processes |
| Colorectum | AD |  |
| Colorectum | SER |  |
| Colorectum | MSS |  |
| Colorectum | MSI-H |  |
| Colorectum | FAP |  |
| ∗Top 15 enriched GO BP terms are showed in the bar plot of each disease state in each tissue. Each row represents a significant GO biological process which is colored according to the -log10(p.adjust). |
| Page: 1 2 3 4 5 6 7 8 9 |
| GO ID | Tissue | Disease Stage | Description | Gene Ratio | Bg Ratio | pvalue | p.adjust | Count |
| GO:00096158 | Cervix | CC | response to virus | 73/2311 | 367/18723 | 2.22e-05 | 3.95e-04 | 73 |
| GO:00516072 | Cervix | CC | defense response to virus | 46/2311 | 265/18723 | 1.04e-02 | 4.97e-02 | 46 |
| GO:01405462 | Cervix | CC | defense response to symbiont | 46/2311 | 265/18723 | 1.04e-02 | 4.97e-02 | 46 |
| GO:0006575 | Colorectum | AD | cellular modified amino acid metabolic process | 59/3918 | 188/18723 | 4.80e-04 | 5.27e-03 | 59 |
| GO:0006520 | Colorectum | AD | cellular amino acid metabolic process | 81/3918 | 284/18723 | 1.37e-03 | 1.19e-02 | 81 |
| GO:0006650 | Colorectum | AD | glycerophospholipid metabolic process | 83/3918 | 306/18723 | 5.40e-03 | 3.55e-02 | 83 |
| GO:0006644 | Colorectum | AD | phospholipid metabolic process | 101/3918 | 383/18723 | 5.80e-03 | 3.67e-02 | 101 |
| GO:0046486 | Colorectum | SER | glycerolipid metabolic process | 82/2897 | 392/18723 | 2.26e-03 | 2.17e-02 | 82 |
| GO:00066441 | Colorectum | SER | phospholipid metabolic process | 79/2897 | 383/18723 | 3.94e-03 | 3.24e-02 | 79 |
| GO:00065201 | Colorectum | SER | cellular amino acid metabolic process | 61/2897 | 284/18723 | 4.20e-03 | 3.41e-02 | 61 |
| GO:00066501 | Colorectum | SER | glycerophospholipid metabolic process | 64/2897 | 306/18723 | 6.41e-03 | 4.60e-02 | 64 |
| GO:00065751 | Colorectum | MSS | cellular modified amino acid metabolic process | 55/3467 | 188/18723 | 2.16e-04 | 3.01e-03 | 55 |
| GO:0046394 | Colorectum | MSS | carboxylic acid biosynthetic process | 76/3467 | 314/18723 | 6.71e-03 | 4.38e-02 | 76 |
| GO:0016053 | Colorectum | MSS | organic acid biosynthetic process | 76/3467 | 316/18723 | 7.88e-03 | 4.84e-02 | 76 |
| GO:1901605 | Colorectum | MSI-H | alpha-amino acid metabolic process | 26/1319 | 195/18723 | 1.26e-03 | 2.02e-02 | 26 |
| GO:00065752 | Colorectum | MSI-H | cellular modified amino acid metabolic process | 25/1319 | 188/18723 | 1.61e-03 | 2.39e-02 | 25 |
| GO:0008652 | Colorectum | MSI-H | cellular amino acid biosynthetic process | 13/1319 | 76/18723 | 2.35e-03 | 3.12e-02 | 13 |
| GO:1901607 | Colorectum | MSI-H | alpha-amino acid biosynthetic process | 12/1319 | 68/18723 | 2.60e-03 | 3.41e-02 | 12 |
| GO:00463941 | Colorectum | MSI-H | carboxylic acid biosynthetic process | 36/1319 | 314/18723 | 2.68e-03 | 3.48e-02 | 36 |
| GO:00160531 | Colorectum | MSI-H | organic acid biosynthetic process | 36/1319 | 316/18723 | 2.98e-03 | 3.78e-02 | 36 |
| Page: 1 2 3 4 5 6 7 |
| Pathway ID | Tissue | Disease Stage | Description | Gene Ratio | Bg Ratio | pvalue | p.adjust | qvalue | Count |
| hsa03250 | Colorectum | MSS | Viral life cycle - HIV-1 | 23/1875 | 63/8465 | 6.55e-03 | 2.64e-02 | 1.62e-02 | 23 |
| hsa032501 | Colorectum | MSS | Viral life cycle - HIV-1 | 23/1875 | 63/8465 | 6.55e-03 | 2.64e-02 | 1.62e-02 | 23 |
| hsa032509 | Esophagus | ESCC | Viral life cycle - HIV-1 | 54/4205 | 63/8465 | 2.01e-09 | 2.17e-08 | 1.11e-08 | 54 |
| hsa0325014 | Esophagus | ESCC | Viral life cycle - HIV-1 | 54/4205 | 63/8465 | 2.01e-09 | 2.17e-08 | 1.11e-08 | 54 |
| hsa032502 | Liver | HCC | Viral life cycle - HIV-1 | 46/4020 | 63/8465 | 3.25e-05 | 1.88e-04 | 1.04e-04 | 46 |
| hsa0325011 | Liver | HCC | Viral life cycle - HIV-1 | 46/4020 | 63/8465 | 3.25e-05 | 1.88e-04 | 1.04e-04 | 46 |
| hsa032508 | Oral cavity | OSCC | Viral life cycle - HIV-1 | 45/3704 | 63/8465 | 7.62e-06 | 3.59e-05 | 1.83e-05 | 45 |
| hsa0325013 | Oral cavity | OSCC | Viral life cycle - HIV-1 | 45/3704 | 63/8465 | 7.62e-06 | 3.59e-05 | 1.83e-05 | 45 |
| hsa032506 | Oral cavity | NEOLP | Viral life cycle - HIV-1 | 16/1112 | 63/8465 | 6.21e-03 | 2.33e-02 | 1.46e-02 | 16 |
| hsa032507 | Oral cavity | NEOLP | Viral life cycle - HIV-1 | 16/1112 | 63/8465 | 6.21e-03 | 2.33e-02 | 1.46e-02 | 16 |
| hsa032504 | Prostate | BPH | Viral life cycle - HIV-1 | 24/1718 | 63/8465 | 8.32e-04 | 3.98e-03 | 2.46e-03 | 24 |
| hsa0325012 | Prostate | BPH | Viral life cycle - HIV-1 | 24/1718 | 63/8465 | 8.32e-04 | 3.98e-03 | 2.46e-03 | 24 |
| hsa0325021 | Prostate | Tumor | Viral life cycle - HIV-1 | 25/1791 | 63/8465 | 6.13e-04 | 3.07e-03 | 1.91e-03 | 25 |
| hsa032503 | Prostate | Tumor | Viral life cycle - HIV-1 | 25/1791 | 63/8465 | 6.13e-04 | 3.07e-03 | 1.91e-03 | 25 |
| Page: 1 |
Top |
Cell-cell communication analysis |
| Identification of potential cell-cell interactions between two cell types and their ligand-receptor pairs for different disease states |
| Ligand | Receptor | LRpair | Pathway | Tissue | Disease Stage |
| Page: 1 |
Top |
Single-cell gene regulatory network inference analysis |
| Find out the significant the regulons (TFs) and the target genes of each regulon across cell types for different disease states |
| TF | Cell Type | Tissue | Disease Stage | Target Gene | RSS | Regulon Activity |
| ∗The dot plots of a searched regulon are shown for all cell subpopulations in each disease state of each tissue based on the regulon specific score inferred using pySCENIC and by calculating the average expression. |
| Page: 1 |
Top |
Somatic mutation of malignant transformation related genes |
| Annotation of somatic variants for genes involved in malignant transformation |
| Hugo Symbol | Variant Class | Variant Classification | dbSNP RS | HGVSc | HGVSp | HGVSp Short | SWISSPROT | BIOTYPE | SIFT | PolyPhen | Tumor Sample Barcode | Tissue | Histology | Sex | Age | Stage | Therapy Types | Drugs | Outcome |
| SERINC5 | SNV | Missense_Mutation | c.419N>C | p.Gly140Ala | p.G140A | Q86VE9 | protein_coding | tolerated(0.94) | probably_damaging(1) | TCGA-A7-A26H-01 | Breast | breast invasive carcinoma | Female | >=65 | I/II | Hormone Therapy | anastrozole | PD | |
| SERINC5 | SNV | Missense_Mutation | c.178N>A | p.His60Asn | p.H60N | Q86VE9 | protein_coding | tolerated(0.32) | benign(0) | TCGA-AC-A23H-01 | Breast | breast invasive carcinoma | Female | >=65 | I/II | Unknown | Unknown | PD | |
| SERINC5 | SNV | Missense_Mutation | novel | c.290N>T | p.Gly97Val | p.G97V | Q86VE9 | protein_coding | deleterious(0.01) | probably_damaging(1) | TCGA-AN-A046-01 | Breast | breast invasive carcinoma | Female | >=65 | I/II | Unknown | Unknown | SD |
| SERINC5 | SNV | Missense_Mutation | c.317N>C | p.Cys106Ser | p.C106S | Q86VE9 | protein_coding | tolerated(0.32) | benign(0.197) | TCGA-C8-A1HN-01 | Breast | breast invasive carcinoma | Female | <65 | I/II | Unknown | Unknown | SD | |
| SERINC5 | SNV | Missense_Mutation | novel | c.682N>A | p.Glu228Lys | p.E228K | Q86VE9 | protein_coding | tolerated(0.11) | benign(0.173) | TCGA-LD-A74U-01 | Breast | breast invasive carcinoma | Female | >=65 | III/IV | Chemotherapy | taxotere | SD |
| SERINC5 | SNV | Missense_Mutation | novel | c.481G>A | p.Gly161Arg | p.G161R | Q86VE9 | protein_coding | deleterious(0.02) | probably_damaging(0.99) | TCGA-2W-A8YY-01 | Cervix | cervical & endocervical cancer | Female | <65 | I/II | Chemotherapy | cisplatin | CR |
| SERINC5 | insertion | Frame_Shift_Ins | novel | c.45_46insG | p.Ser16ValfsTer9 | p.S16Vfs*9 | Q86VE9 | protein_coding | TCGA-AA-3949-01 | Colorectum | colon adenocarcinoma | Female | >=65 | III/IV | Unknown | Unknown | SD | ||
| SERINC5 | SNV | Missense_Mutation | rs768554900 | c.1007N>T | p.Ser336Leu | p.S336L | Q86VE9 | protein_coding | tolerated(0.12) | benign(0.012) | TCGA-A5-A0G2-01 | Endometrium | uterine corpus endometrioid carcinoma | Female | <65 | III/IV | Unknown | Unknown | SD |
| SERINC5 | SNV | Missense_Mutation | rs765631759 | c.271N>A | p.Val91Met | p.V91M | Q86VE9 | protein_coding | deleterious(0) | probably_damaging(1) | TCGA-A5-A0GP-01 | Endometrium | uterine corpus endometrioid carcinoma | Female | <65 | I/II | Unknown | Unknown | SD |
| SERINC5 | SNV | Missense_Mutation | novel | c.401T>C | p.Leu134Ser | p.L134S | Q86VE9 | protein_coding | deleterious(0) | probably_damaging(1) | TCGA-AJ-A3EK-01 | Endometrium | uterine corpus endometrioid carcinoma | Female | <65 | I/II | Chemotherapy | carboplatin | CR |
| Page: 1 2 3 4 |
Top |
Related drugs of malignant transformation related genes |
| Identification of chemicals and drugs interact with genes involved in malignant transfromation |
| (DGIdb 4.0) |
| Entrez ID | Symbol | Category | Interaction Types | Drug Claim Name | Drug Name | PMIDs |
| Page: 1 |

Copyright 2023-Present -The University of Texas Health Science Center at Houston |