
|
|||||
|
 | |
| |
| |
| |
| |
| |
|
Gene: SERINC3 |
Gene summary for SERINC3 |
| Gene information | Species | Human | Gene symbol | SERINC3 | Gene ID | 10955 |
| Gene name | serine incorporator 3 | |
| Gene Alias | AIGP1 | |
| Cytomap | 20q13.12 | |
| Gene Type | protein-coding | GO ID | GO:0002376 | UniProtAcc | Q13530 |
Top |
Malignant transformation analysis |
| Identification of the aberrant gene expression in precancerous and cancerous lesions by comparing the gene expression of stem-like cells in diseased tissues with normal stem cells |
| Entrez ID | Symbol | Replicates | Species | Organ | Tissue | Adj P-value | Log2FC | Malignancy |
| 10955 | SERINC3 | HTA11_347_2000001011 | Human | Colorectum | AD | 6.30e-12 | 5.15e-01 | -0.1954 |
| 10955 | SERINC3 | HTA11_1391_2000001011 | Human | Colorectum | AD | 1.22e-02 | 2.85e-01 | -0.059 |
| 10955 | SERINC3 | HTA11_99999970781_79442 | Human | Colorectum | MSS | 6.55e-04 | 3.29e-01 | 0.294 |
| 10955 | SERINC3 | HTA11_99999971662_82457 | Human | Colorectum | MSS | 8.01e-25 | 8.90e-01 | 0.3859 |
| 10955 | SERINC3 | HTA11_99999974143_84620 | Human | Colorectum | MSS | 1.33e-07 | 4.77e-01 | 0.3005 |
| 10955 | SERINC3 | A015-C-203 | Human | Colorectum | FAP | 1.94e-03 | -9.76e-02 | -0.1294 |
| 10955 | SERINC3 | A015-C-006 | Human | Colorectum | FAP | 2.83e-02 | -2.04e-01 | -0.0994 |
| 10955 | SERINC3 | A002-C-114 | Human | Colorectum | FAP | 1.19e-02 | -1.62e-01 | -0.1561 |
| 10955 | SERINC3 | A015-C-104 | Human | Colorectum | FAP | 3.30e-05 | -1.63e-01 | -0.1899 |
| 10955 | SERINC3 | A002-C-116 | Human | Colorectum | FAP | 9.81e-04 | -5.51e-02 | -0.0452 |
| 10955 | SERINC3 | A018-E-020 | Human | Colorectum | FAP | 2.09e-02 | -1.43e-01 | -0.2034 |
| 10955 | SERINC3 | F034 | Human | Colorectum | FAP | 4.87e-02 | -1.23e-01 | -0.0665 |
| 10955 | SERINC3 | CRC-1-8810 | Human | Colorectum | CRC | 2.03e-02 | 2.56e-01 | 0.6257 |
| 10955 | SERINC3 | CRC-3-11773 | Human | Colorectum | CRC | 1.50e-02 | 2.93e-01 | 0.2564 |
| 10955 | SERINC3 | LZE2T | Human | Esophagus | ESCC | 3.30e-03 | 4.55e-01 | 0.082 |
| 10955 | SERINC3 | LZE4T | Human | Esophagus | ESCC | 3.53e-31 | 1.07e+00 | 0.0811 |
| 10955 | SERINC3 | LZE7T | Human | Esophagus | ESCC | 5.30e-11 | 6.67e-01 | 0.0667 |
| 10955 | SERINC3 | LZE8T | Human | Esophagus | ESCC | 1.09e-12 | 4.07e-01 | 0.067 |
| 10955 | SERINC3 | LZE20T | Human | Esophagus | ESCC | 4.56e-10 | 4.92e-01 | 0.0662 |
| 10955 | SERINC3 | LZE22T | Human | Esophagus | ESCC | 7.10e-07 | 3.72e-01 | 0.068 |
| Page: 1 2 3 4 5 6 7 8 9 |
| Tissue | Expression Dynamics | Abbreviation |
| Colorectum (GSE201348) |  | FAP: Familial adenomatous polyposis |
| CRC: Colorectal cancer | ||
| Colorectum (HTA11) |  | AD: Adenomas |
| SER: Sessile serrated lesions | ||
| MSI-H: Microsatellite-high colorectal cancer | ||
| MSS: Microsatellite stable colorectal cancer | ||
| Esophagus |  | ESCC: Esophageal squamous cell carcinoma |
| HGIN: High-grade intraepithelial neoplasias | ||
| LGIN: Low-grade intraepithelial neoplasias | ||
| Liver | 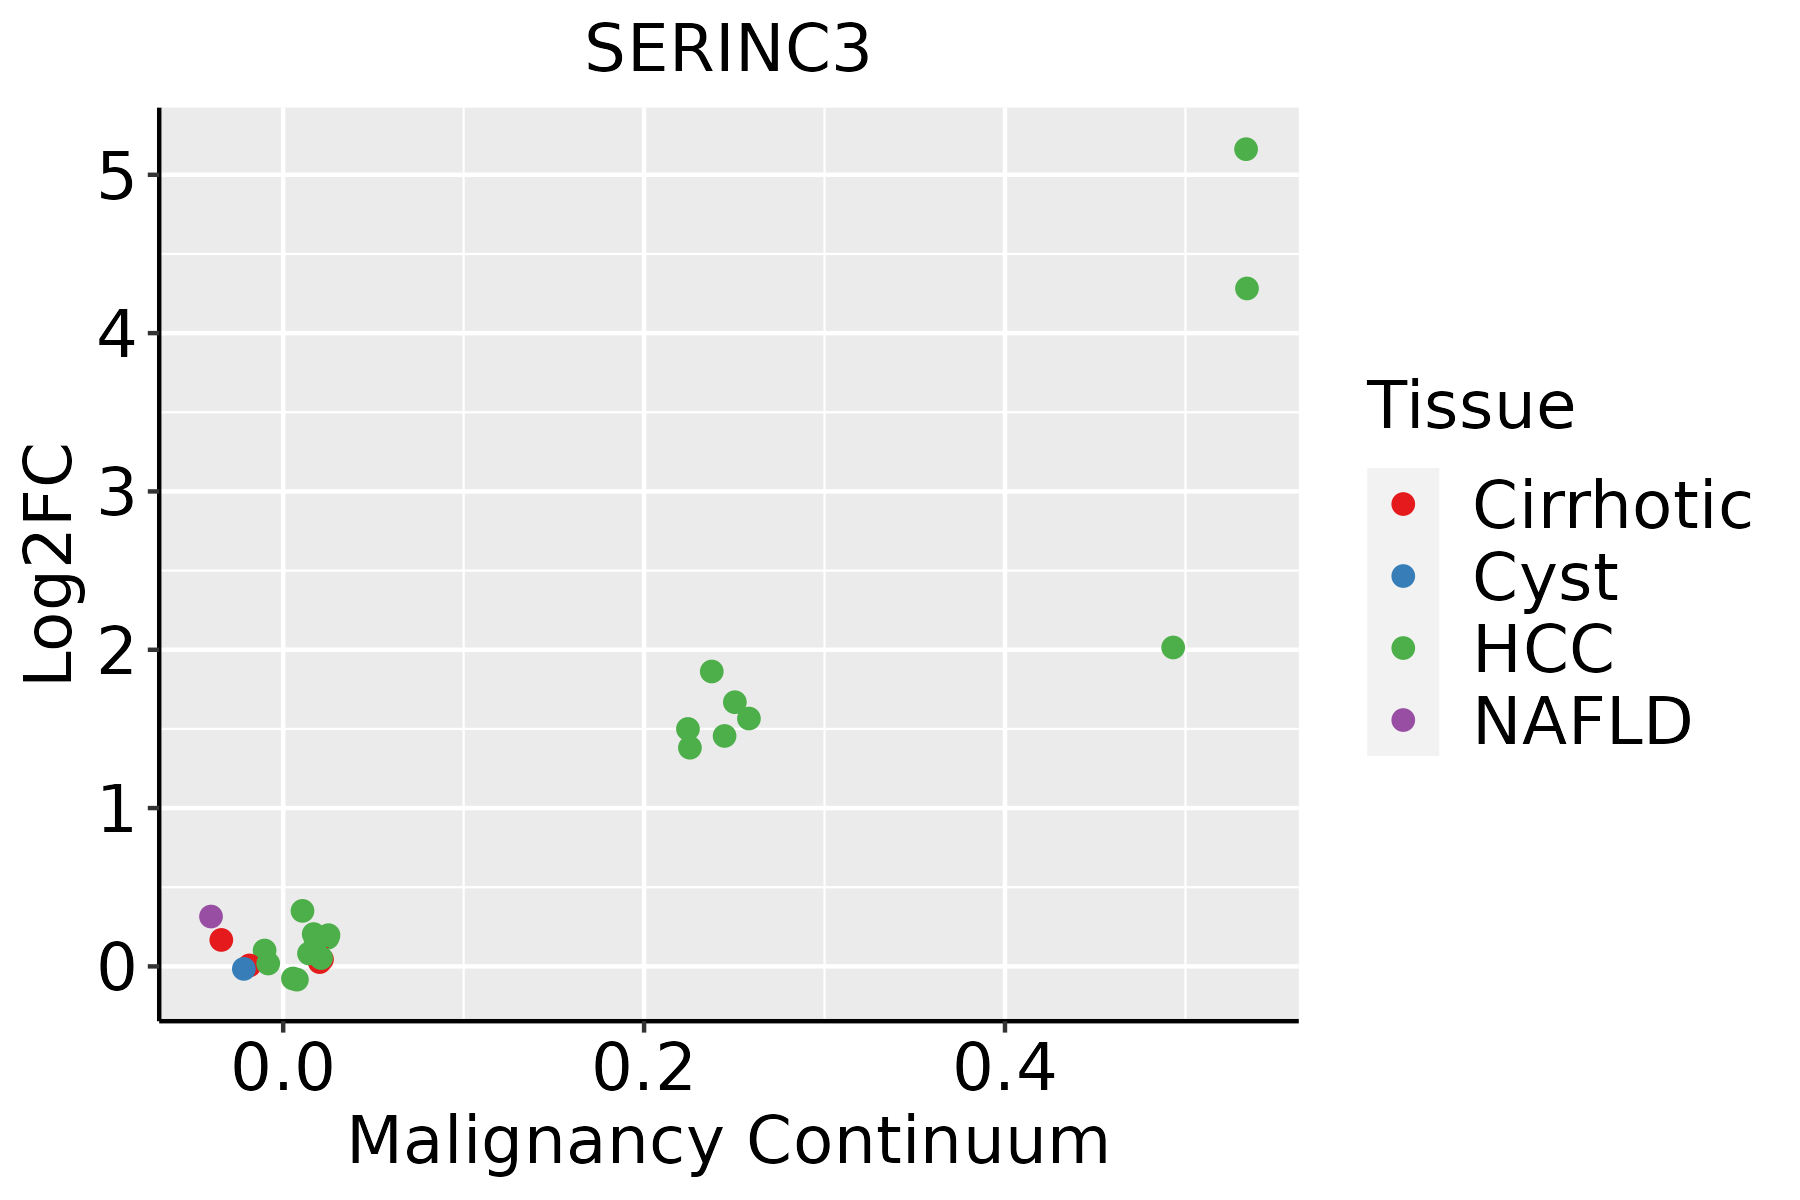 | HCC: Hepatocellular carcinoma |
| NAFLD: Non-alcoholic fatty liver disease | ||
| Oral Cavity | 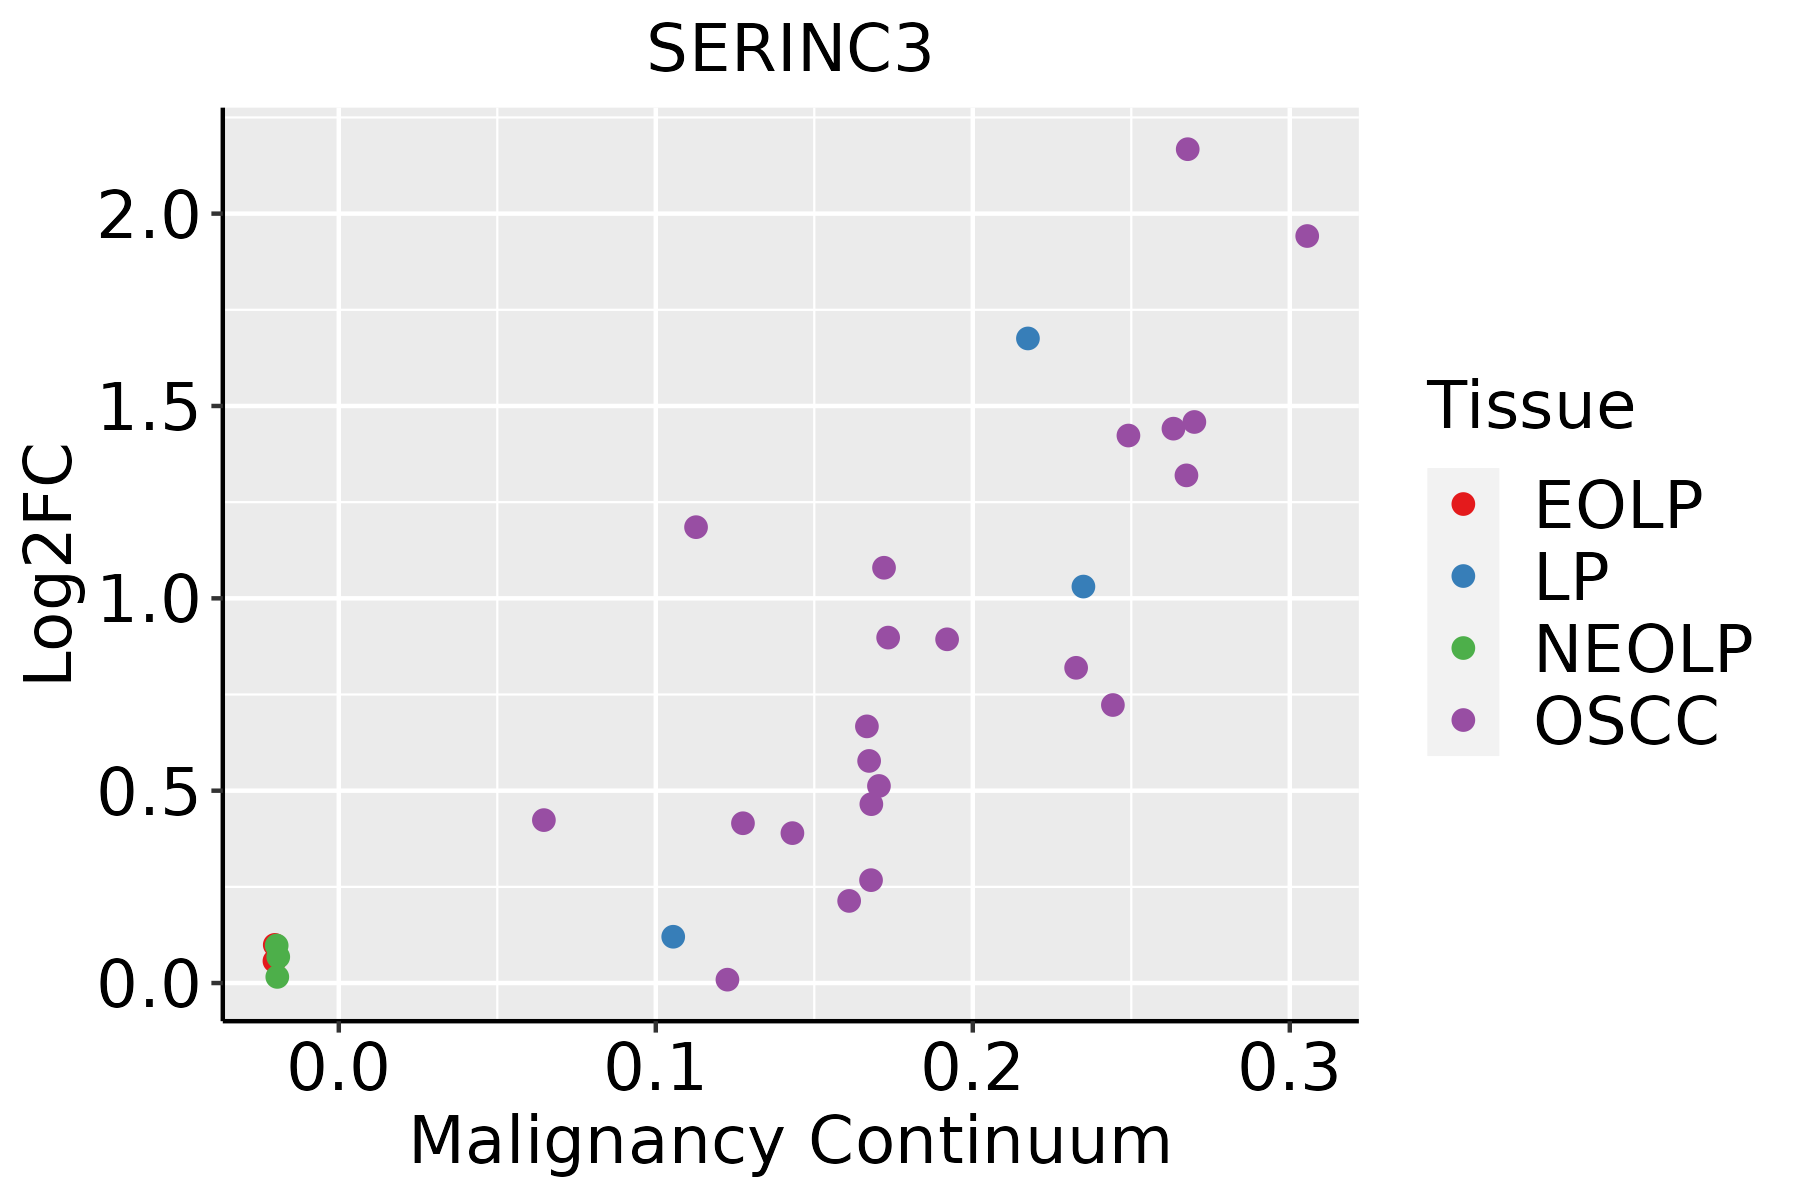 | EOLP: Erosive Oral lichen planus |
| LP: leukoplakia | ||
| NEOLP: Non-erosive oral lichen planus | ||
| OSCC: Oral squamous cell carcinoma | ||
| Prostate | 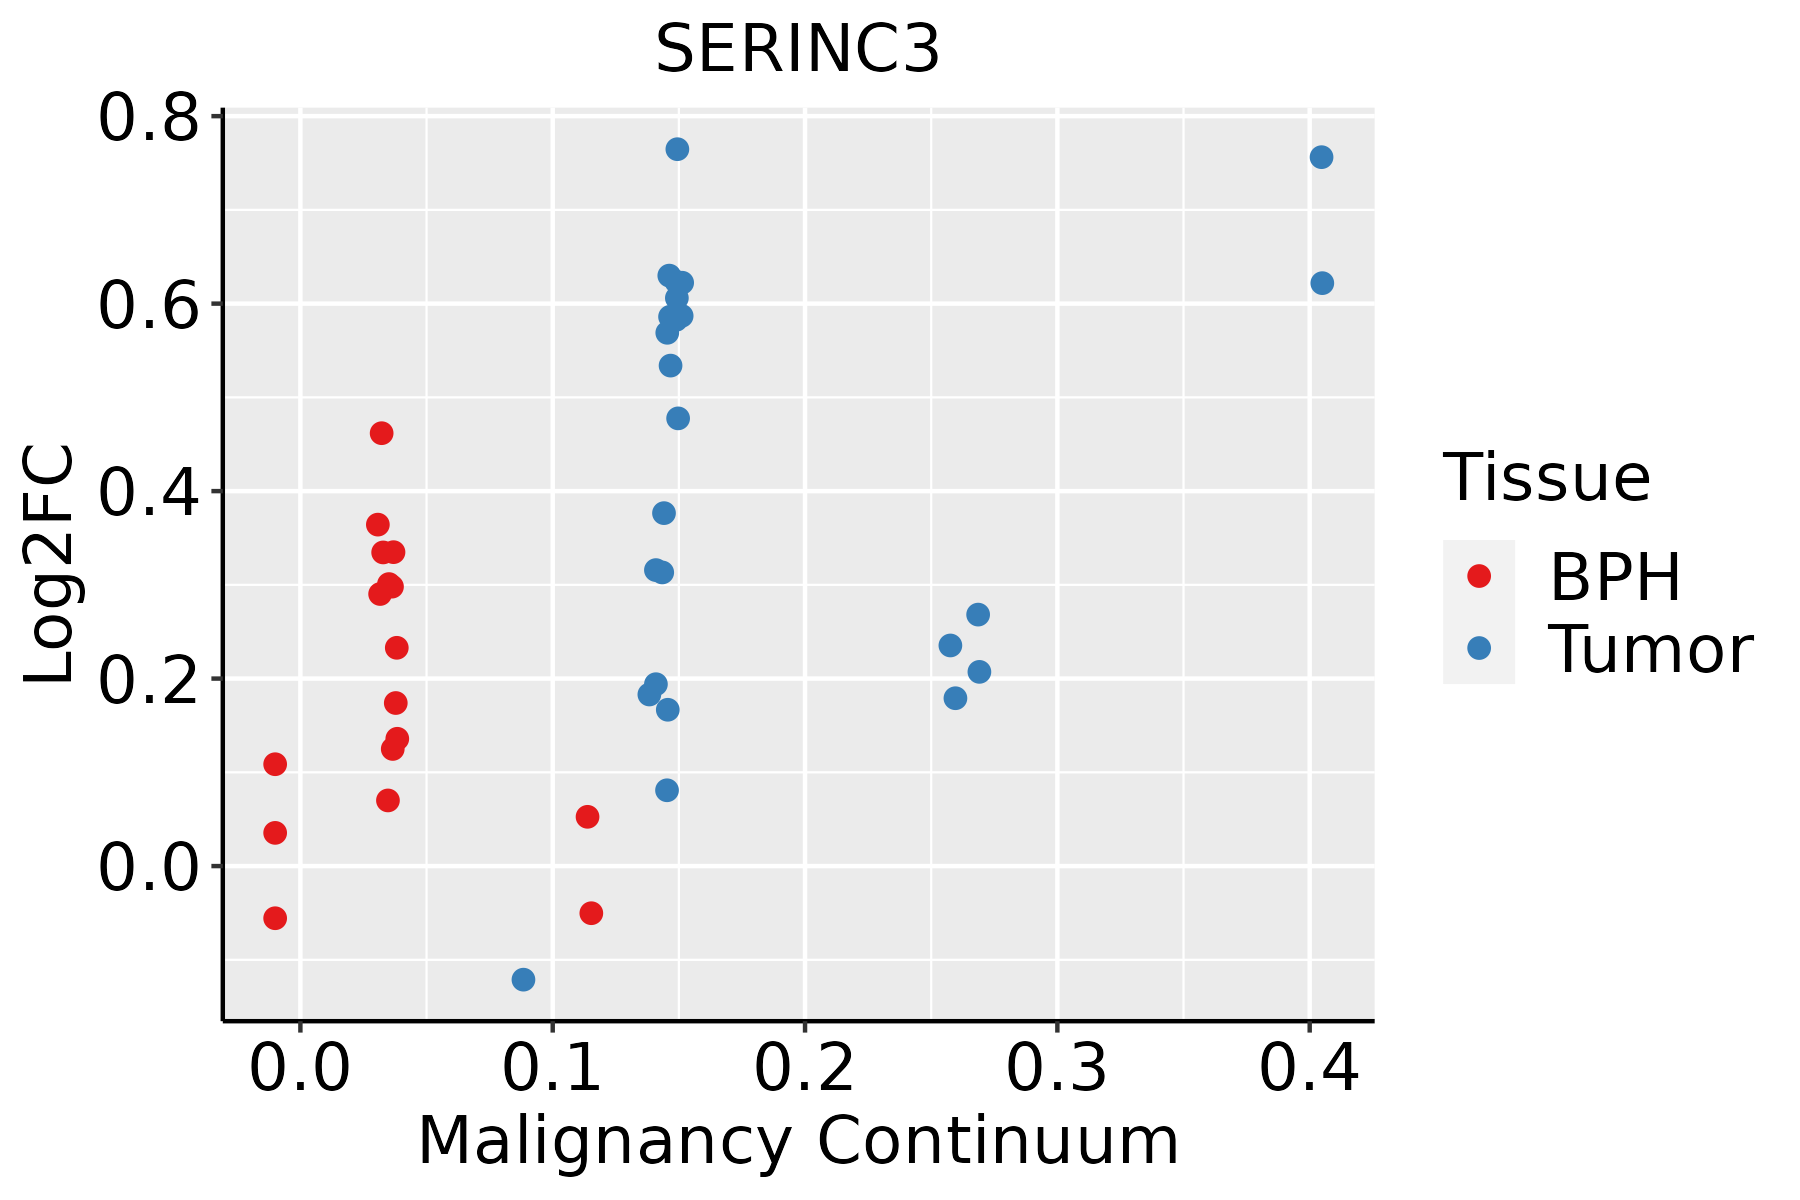 | BPH: Benign Prostatic Hyperplasia |
| Skin | 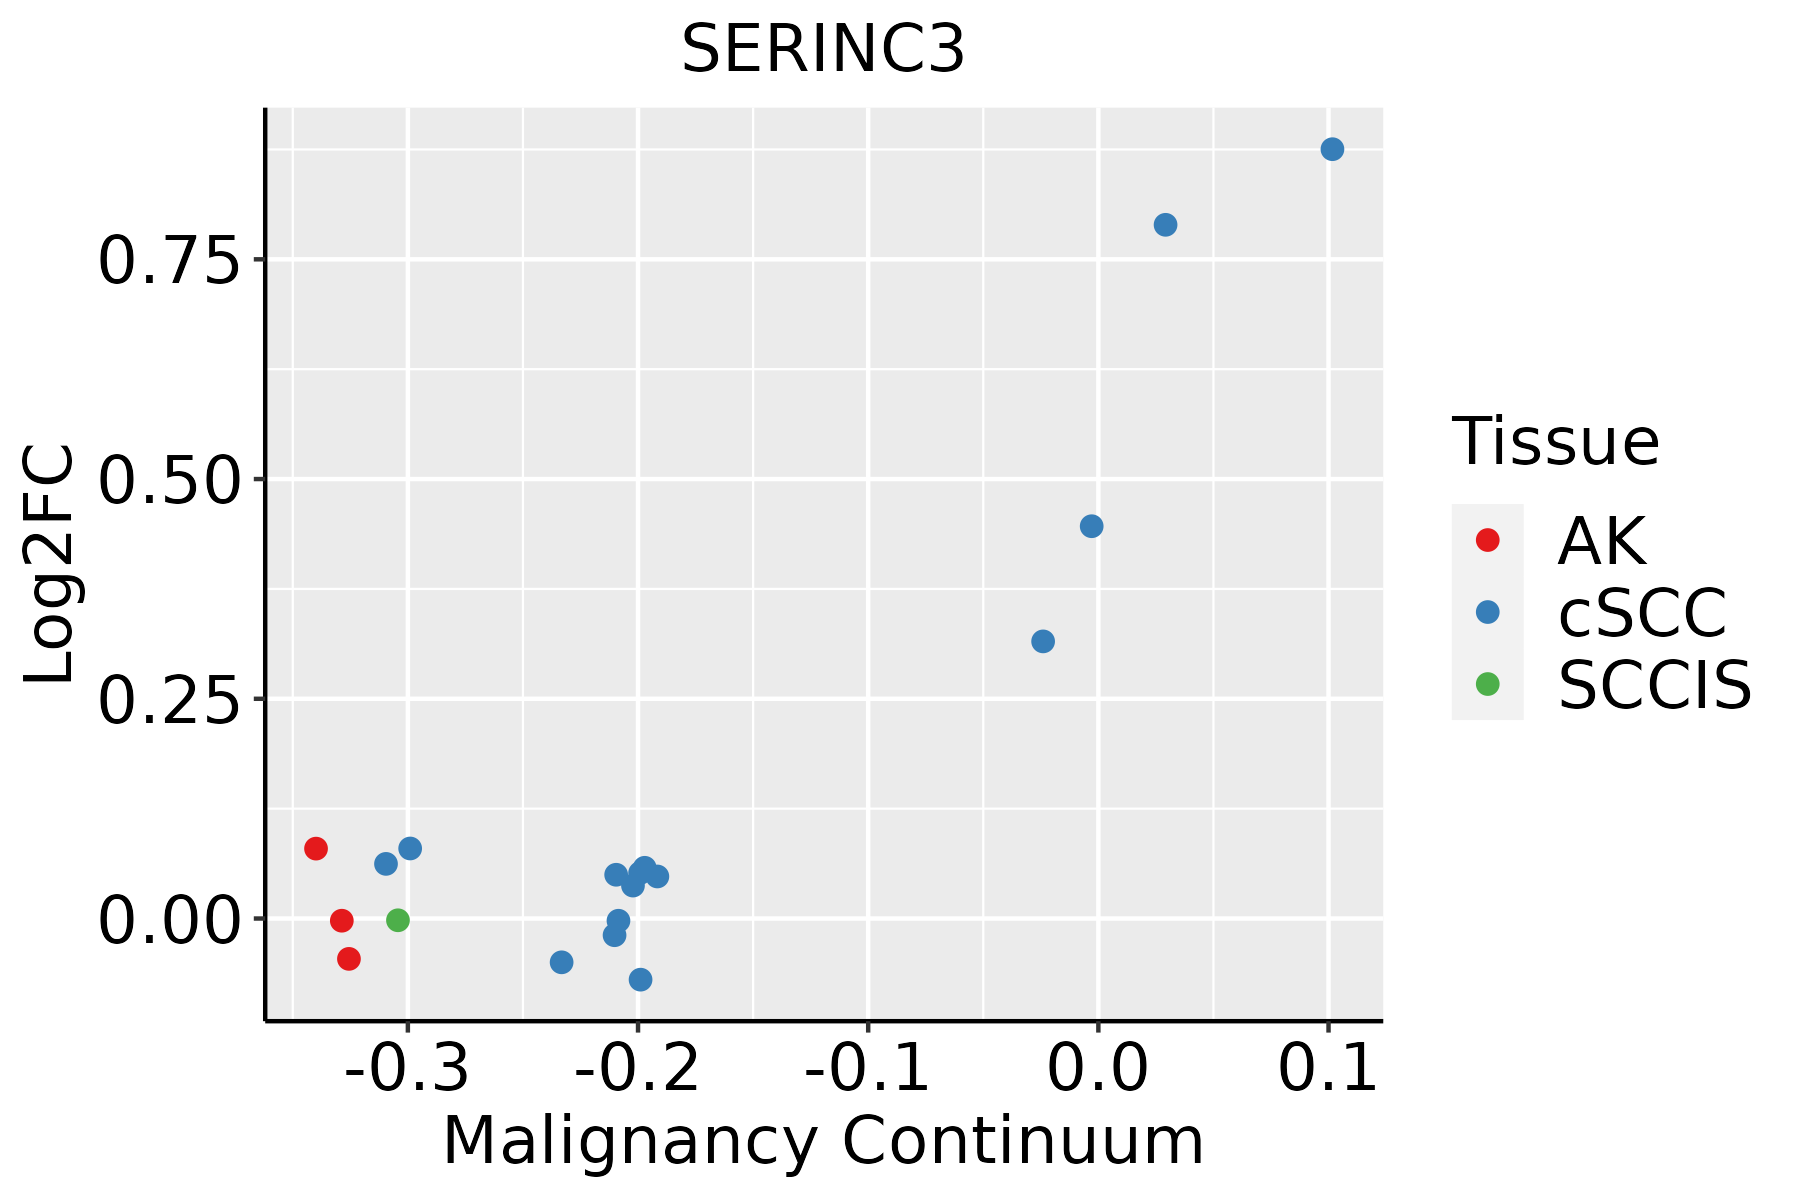 | AK: Actinic keratosis |
| cSCC: Cutaneous squamous cell carcinoma | ||
| SCCIS:squamous cell carcinoma in situ | ||
| Thyroid | 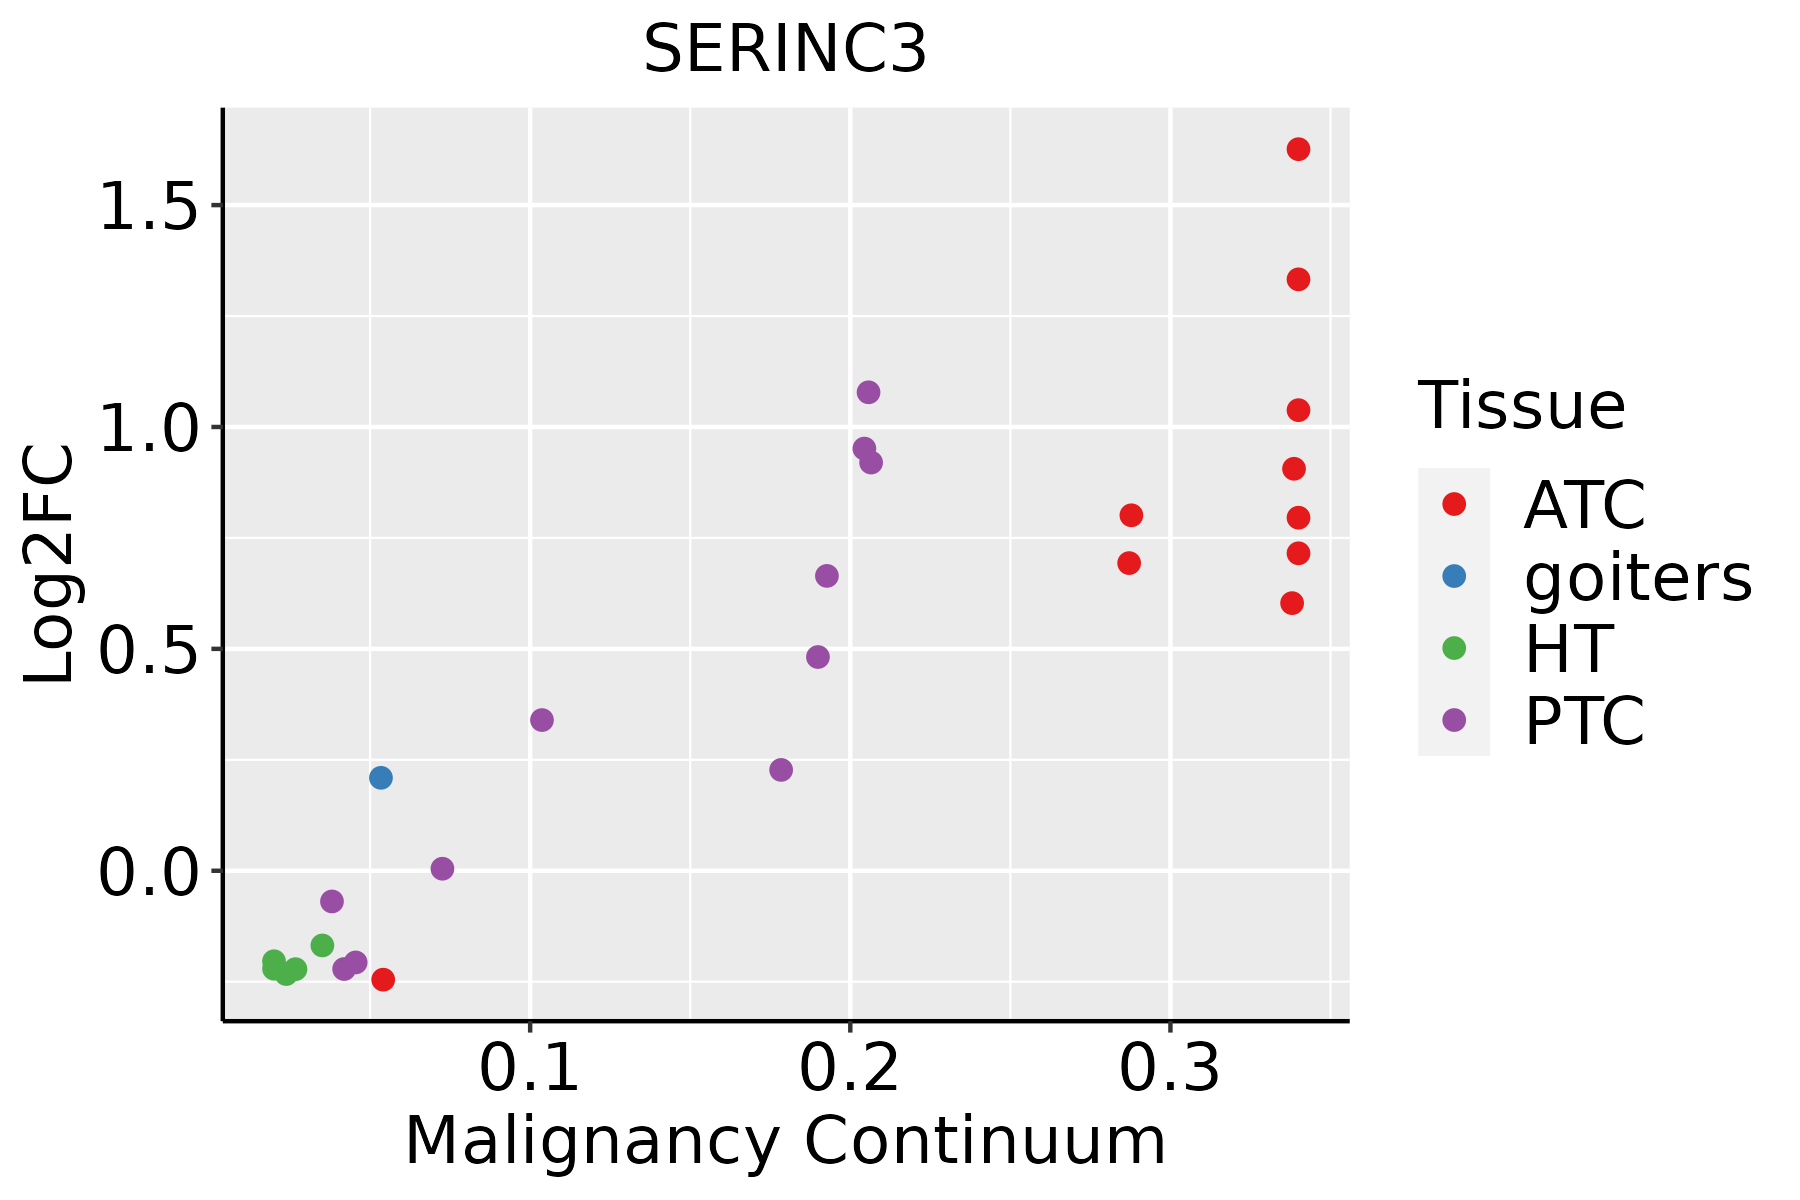 | ATC: Anaplastic thyroid cancer |
| HT: Hashimoto's thyroiditis | ||
| PTC: Papillary thyroid cancer |
| ∗log2FC in expression of this searched gene in stem-like cells from each diseased tissue sample relative to stem-like cells in normal samples in each tissue plotted against the malignancy continuum. Samples are colored based on if they are from different disease stage. |
Top |
Malignant transformation related pathway analysis |
| Find out the enriched GO biological processes and KEGG pathways involved in transition from healthy to precancer to cancer |
| Tissue | Disease Stage | Enriched GO biological Processes |
| Colorectum | AD |  |
| Colorectum | SER |  |
| Colorectum | MSS |  |
| Colorectum | MSI-H |  |
| Colorectum | FAP |  |
| ∗Top 15 enriched GO BP terms are showed in the bar plot of each disease state in each tissue. Each row represents a significant GO biological process which is colored according to the -log10(p.adjust). |
| Page: 1 2 3 4 5 6 7 8 9 |
| GO ID | Tissue | Disease Stage | Description | Gene Ratio | Bg Ratio | pvalue | p.adjust | Count |
| GO:0097193 | Colorectum | AD | intrinsic apoptotic signaling pathway | 108/3918 | 288/18723 | 6.25e-11 | 6.41e-09 | 108 |
| GO:2001242 | Colorectum | AD | regulation of intrinsic apoptotic signaling pathway | 67/3918 | 164/18723 | 4.94e-09 | 3.16e-07 | 67 |
| GO:2001233 | Colorectum | AD | regulation of apoptotic signaling pathway | 119/3918 | 356/18723 | 2.14e-08 | 1.21e-06 | 119 |
| GO:0034976 | Colorectum | AD | response to endoplasmic reticulum stress | 90/3918 | 256/18723 | 8.48e-08 | 4.28e-06 | 90 |
| GO:0070059 | Colorectum | AD | intrinsic apoptotic signaling pathway in response to endoplasmic reticulum stress | 29/3918 | 63/18723 | 7.03e-06 | 1.73e-04 | 29 |
| GO:1905897 | Colorectum | AD | regulation of response to endoplasmic reticulum stress | 32/3918 | 82/18723 | 1.37e-04 | 1.95e-03 | 32 |
| GO:0006575 | Colorectum | AD | cellular modified amino acid metabolic process | 59/3918 | 188/18723 | 4.80e-04 | 5.27e-03 | 59 |
| GO:2001235 | Colorectum | AD | positive regulation of apoptotic signaling pathway | 42/3918 | 126/18723 | 7.85e-04 | 7.84e-03 | 42 |
| GO:2001244 | Colorectum | AD | positive regulation of intrinsic apoptotic signaling pathway | 23/3918 | 58/18723 | 8.82e-04 | 8.53e-03 | 23 |
| GO:0006520 | Colorectum | AD | cellular amino acid metabolic process | 81/3918 | 284/18723 | 1.37e-03 | 1.19e-02 | 81 |
| GO:0006650 | Colorectum | AD | glycerophospholipid metabolic process | 83/3918 | 306/18723 | 5.40e-03 | 3.55e-02 | 83 |
| GO:0006644 | Colorectum | AD | phospholipid metabolic process | 101/3918 | 383/18723 | 5.80e-03 | 3.67e-02 | 101 |
| GO:00971932 | Colorectum | MSS | intrinsic apoptotic signaling pathway | 102/3467 | 288/18723 | 6.06e-12 | 9.82e-10 | 102 |
| GO:20012422 | Colorectum | MSS | regulation of intrinsic apoptotic signaling pathway | 66/3467 | 164/18723 | 6.70e-11 | 7.47e-09 | 66 |
| GO:20012332 | Colorectum | MSS | regulation of apoptotic signaling pathway | 116/3467 | 356/18723 | 1.02e-10 | 1.06e-08 | 116 |
| GO:00349762 | Colorectum | MSS | response to endoplasmic reticulum stress | 81/3467 | 256/18723 | 2.65e-07 | 1.10e-05 | 81 |
| GO:00700592 | Colorectum | MSS | intrinsic apoptotic signaling pathway in response to endoplasmic reticulum stress | 27/3467 | 63/18723 | 6.93e-06 | 1.79e-04 | 27 |
| GO:19058972 | Colorectum | MSS | regulation of response to endoplasmic reticulum stress | 31/3467 | 82/18723 | 3.17e-05 | 6.29e-04 | 31 |
| GO:20012352 | Colorectum | MSS | positive regulation of apoptotic signaling pathway | 42/3467 | 126/18723 | 4.95e-05 | 8.97e-04 | 42 |
| GO:20012442 | Colorectum | MSS | positive regulation of intrinsic apoptotic signaling pathway | 23/3467 | 58/18723 | 1.39e-04 | 2.06e-03 | 23 |
| Page: 1 2 3 4 5 6 7 8 9 10 11 12 |
| Pathway ID | Tissue | Disease Stage | Description | Gene Ratio | Bg Ratio | pvalue | p.adjust | qvalue | Count |
| hsa03250 | Colorectum | MSS | Viral life cycle - HIV-1 | 23/1875 | 63/8465 | 6.55e-03 | 2.64e-02 | 1.62e-02 | 23 |
| hsa032501 | Colorectum | MSS | Viral life cycle - HIV-1 | 23/1875 | 63/8465 | 6.55e-03 | 2.64e-02 | 1.62e-02 | 23 |
| hsa032509 | Esophagus | ESCC | Viral life cycle - HIV-1 | 54/4205 | 63/8465 | 2.01e-09 | 2.17e-08 | 1.11e-08 | 54 |
| hsa0325014 | Esophagus | ESCC | Viral life cycle - HIV-1 | 54/4205 | 63/8465 | 2.01e-09 | 2.17e-08 | 1.11e-08 | 54 |
| hsa032502 | Liver | HCC | Viral life cycle - HIV-1 | 46/4020 | 63/8465 | 3.25e-05 | 1.88e-04 | 1.04e-04 | 46 |
| hsa0325011 | Liver | HCC | Viral life cycle - HIV-1 | 46/4020 | 63/8465 | 3.25e-05 | 1.88e-04 | 1.04e-04 | 46 |
| hsa032508 | Oral cavity | OSCC | Viral life cycle - HIV-1 | 45/3704 | 63/8465 | 7.62e-06 | 3.59e-05 | 1.83e-05 | 45 |
| hsa0325013 | Oral cavity | OSCC | Viral life cycle - HIV-1 | 45/3704 | 63/8465 | 7.62e-06 | 3.59e-05 | 1.83e-05 | 45 |
| hsa0325022 | Oral cavity | LP | Viral life cycle - HIV-1 | 32/2418 | 63/8465 | 1.55e-04 | 9.08e-04 | 5.86e-04 | 32 |
| hsa0325031 | Oral cavity | LP | Viral life cycle - HIV-1 | 32/2418 | 63/8465 | 1.55e-04 | 9.08e-04 | 5.86e-04 | 32 |
| hsa032504 | Prostate | BPH | Viral life cycle - HIV-1 | 24/1718 | 63/8465 | 8.32e-04 | 3.98e-03 | 2.46e-03 | 24 |
| hsa0325012 | Prostate | BPH | Viral life cycle - HIV-1 | 24/1718 | 63/8465 | 8.32e-04 | 3.98e-03 | 2.46e-03 | 24 |
| hsa0325021 | Prostate | Tumor | Viral life cycle - HIV-1 | 25/1791 | 63/8465 | 6.13e-04 | 3.07e-03 | 1.91e-03 | 25 |
| hsa032503 | Prostate | Tumor | Viral life cycle - HIV-1 | 25/1791 | 63/8465 | 6.13e-04 | 3.07e-03 | 1.91e-03 | 25 |
| Page: 1 |
Top |
Cell-cell communication analysis |
| Identification of potential cell-cell interactions between two cell types and their ligand-receptor pairs for different disease states |
| Ligand | Receptor | LRpair | Pathway | Tissue | Disease Stage |
| Page: 1 |
Top |
Single-cell gene regulatory network inference analysis |
| Find out the significant the regulons (TFs) and the target genes of each regulon across cell types for different disease states |
| TF | Cell Type | Tissue | Disease Stage | Target Gene | RSS | Regulon Activity |
| ∗The dot plots of a searched regulon are shown for all cell subpopulations in each disease state of each tissue based on the regulon specific score inferred using pySCENIC and by calculating the average expression. |
| Page: 1 |
Top |
Somatic mutation of malignant transformation related genes |
| Annotation of somatic variants for genes involved in malignant transformation |
| Hugo Symbol | Variant Class | Variant Classification | dbSNP RS | HGVSc | HGVSp | HGVSp Short | SWISSPROT | BIOTYPE | SIFT | PolyPhen | Tumor Sample Barcode | Tissue | Histology | Sex | Age | Stage | Therapy Types | Drugs | Outcome |
| SERINC3 | SNV | Missense_Mutation | rs758967791 | c.1060C>T | p.Arg354Cys | p.R354C | Q13530 | protein_coding | deleterious(0.01) | probably_damaging(0.996) | TCGA-AO-A128-01 | Breast | breast invasive carcinoma | Female | <65 | I/II | Chemotherapy | doxorubicin | SD |
| SERINC3 | SNV | Missense_Mutation | c.610N>A | p.Ala204Thr | p.A204T | Q13530 | protein_coding | deleterious(0.05) | possibly_damaging(0.461) | TCGA-BH-A0HF-01 | Breast | breast invasive carcinoma | Female | >=65 | I/II | Hormone Therapy | arimidex | SD | |
| SERINC3 | SNV | Missense_Mutation | rs750095755 | c.893N>G | p.Asn298Ser | p.N298S | Q13530 | protein_coding | tolerated(1) | benign(0) | TCGA-EA-A3QD-01 | Cervix | cervical & endocervical cancer | Female | <65 | III/IV | Chemotherapy | cisplatin | CR |
| SERINC3 | SNV | Missense_Mutation | novel | c.562G>A | p.Glu188Lys | p.E188K | Q13530 | protein_coding | deleterious(0.04) | probably_damaging(1) | TCGA-VS-A9UH-01 | Cervix | cervical & endocervical cancer | Female | <65 | I/II | Chemotherapy | cisplatin | CR |
| SERINC3 | SNV | Missense_Mutation | c.863N>A | p.Ser288Tyr | p.S288Y | Q13530 | protein_coding | deleterious(0) | probably_damaging(0.953) | TCGA-CA-6716-01 | Colorectum | colon adenocarcinoma | Male | >=65 | I/II | Chemotherapy | oxaliplatin | CR | |
| SERINC3 | SNV | Missense_Mutation | novel | c.24C>A | p.Phe8Leu | p.F8L | Q13530 | protein_coding | tolerated(0.21) | benign(0.003) | TCGA-AG-A002-01 | Colorectum | rectum adenocarcinoma | Male | <65 | I/II | Unknown | Unknown | SD |
| SERINC3 | SNV | Missense_Mutation | novel | c.751N>A | p.Ala251Thr | p.A251T | Q13530 | protein_coding | deleterious(0.03) | benign(0.347) | TCGA-A5-A0G2-01 | Endometrium | uterine corpus endometrioid carcinoma | Female | <65 | III/IV | Unknown | Unknown | SD |
| SERINC3 | SNV | Missense_Mutation | c.142N>A | p.Leu48Met | p.L48M | Q13530 | protein_coding | deleterious(0.03) | probably_damaging(0.993) | TCGA-A5-A0GI-01 | Endometrium | uterine corpus endometrioid carcinoma | Female | <65 | I/II | Unknown | Unknown | SD | |
| SERINC3 | SNV | Missense_Mutation | novel | c.1013N>G | p.Phe338Cys | p.F338C | Q13530 | protein_coding | deleterious(0.01) | possibly_damaging(0.489) | TCGA-A5-A2K5-01 | Endometrium | uterine corpus endometrioid carcinoma | Female | >=65 | I/II | Unknown | Unknown | SD |
| SERINC3 | SNV | Missense_Mutation | rs750431207 | c.1061N>A | p.Arg354His | p.R354H | Q13530 | protein_coding | deleterious(0.01) | possibly_damaging(0.597) | TCGA-AJ-A3BH-01 | Endometrium | uterine corpus endometrioid carcinoma | Female | Unknown | I/II | Unknown | Unknown | SD |
| Page: 1 2 3 4 5 6 |
Top |
Related drugs of malignant transformation related genes |
| Identification of chemicals and drugs interact with genes involved in malignant transfromation |
| (DGIdb 4.0) |
| Entrez ID | Symbol | Category | Interaction Types | Drug Claim Name | Drug Name | PMIDs |
| Page: 1 |

Copyright 2023-Present -The University of Texas Health Science Center at Houston |