
|
|||||
|
 | |
| |
| |
| |
| |
| |
|
Gene: SERGEF |
Gene summary for SERGEF |
| Gene information | Species | Human | Gene symbol | SERGEF | Gene ID | 26297 |
| Gene name | secretion regulating guanine nucleotide exchange factor | |
| Gene Alias | DELGEF | |
| Cytomap | 11p15.1 | |
| Gene Type | protein-coding | GO ID | GO:0006810 | UniProtAcc | A8K8C1 |
Top |
Malignant transformation analysis |
| Identification of the aberrant gene expression in precancerous and cancerous lesions by comparing the gene expression of stem-like cells in diseased tissues with normal stem cells |
| Entrez ID | Symbol | Replicates | Species | Organ | Tissue | Adj P-value | Log2FC | Malignancy |
| 26297 | SERGEF | LZE4T | Human | Esophagus | ESCC | 1.24e-10 | 2.46e-01 | 0.0811 |
| 26297 | SERGEF | LZE7T | Human | Esophagus | ESCC | 6.14e-04 | 2.22e-01 | 0.0667 |
| 26297 | SERGEF | LZE8T | Human | Esophagus | ESCC | 1.03e-07 | 1.93e-01 | 0.067 |
| 26297 | SERGEF | LZE24T | Human | Esophagus | ESCC | 1.64e-20 | 3.17e-01 | 0.0596 |
| 26297 | SERGEF | LZE6T | Human | Esophagus | ESCC | 2.47e-02 | 1.10e-01 | 0.0845 |
| 26297 | SERGEF | P1T-E | Human | Esophagus | ESCC | 7.60e-06 | 1.61e-01 | 0.0875 |
| 26297 | SERGEF | P2T-E | Human | Esophagus | ESCC | 6.79e-11 | 1.76e-01 | 0.1177 |
| 26297 | SERGEF | P4T-E | Human | Esophagus | ESCC | 4.36e-16 | 1.99e-01 | 0.1323 |
| 26297 | SERGEF | P5T-E | Human | Esophagus | ESCC | 1.56e-07 | 9.43e-02 | 0.1327 |
| 26297 | SERGEF | P8T-E | Human | Esophagus | ESCC | 2.85e-13 | 2.10e-01 | 0.0889 |
| 26297 | SERGEF | P9T-E | Human | Esophagus | ESCC | 8.86e-10 | 1.66e-01 | 0.1131 |
| 26297 | SERGEF | P10T-E | Human | Esophagus | ESCC | 8.76e-20 | 1.87e-01 | 0.116 |
| 26297 | SERGEF | P11T-E | Human | Esophagus | ESCC | 1.13e-05 | 2.87e-01 | 0.1426 |
| 26297 | SERGEF | P12T-E | Human | Esophagus | ESCC | 1.65e-18 | 2.37e-01 | 0.1122 |
| 26297 | SERGEF | P15T-E | Human | Esophagus | ESCC | 1.30e-16 | 2.64e-01 | 0.1149 |
| 26297 | SERGEF | P16T-E | Human | Esophagus | ESCC | 9.14e-11 | 1.43e-01 | 0.1153 |
| 26297 | SERGEF | P17T-E | Human | Esophagus | ESCC | 4.46e-13 | 3.11e-01 | 0.1278 |
| 26297 | SERGEF | P20T-E | Human | Esophagus | ESCC | 1.50e-15 | 2.96e-01 | 0.1124 |
| 26297 | SERGEF | P21T-E | Human | Esophagus | ESCC | 5.31e-19 | 2.75e-01 | 0.1617 |
| 26297 | SERGEF | P22T-E | Human | Esophagus | ESCC | 3.93e-30 | 4.26e-01 | 0.1236 |
| Page: 1 2 3 4 5 |
| Tissue | Expression Dynamics | Abbreviation |
| Esophagus | 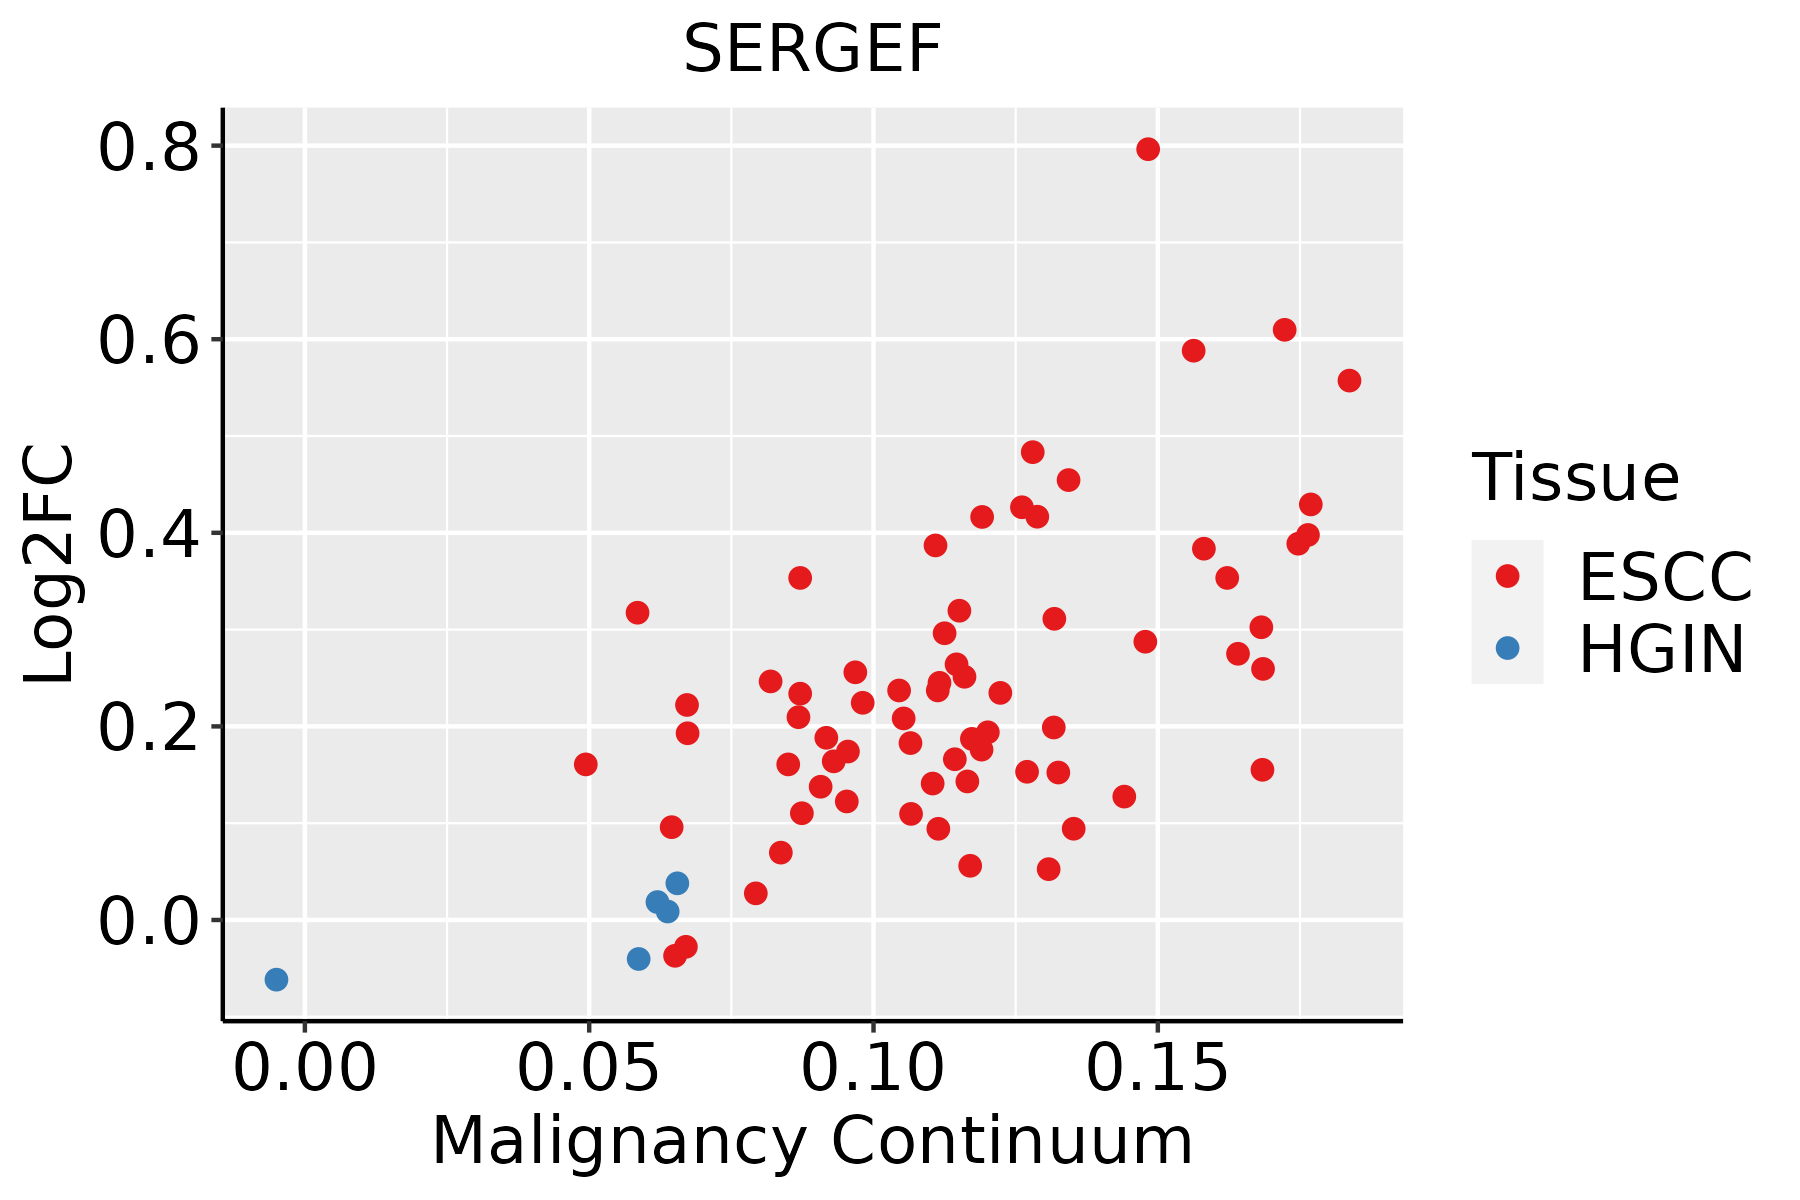 | ESCC: Esophageal squamous cell carcinoma |
| HGIN: High-grade intraepithelial neoplasias | ||
| LGIN: Low-grade intraepithelial neoplasias | ||
| Oral Cavity | 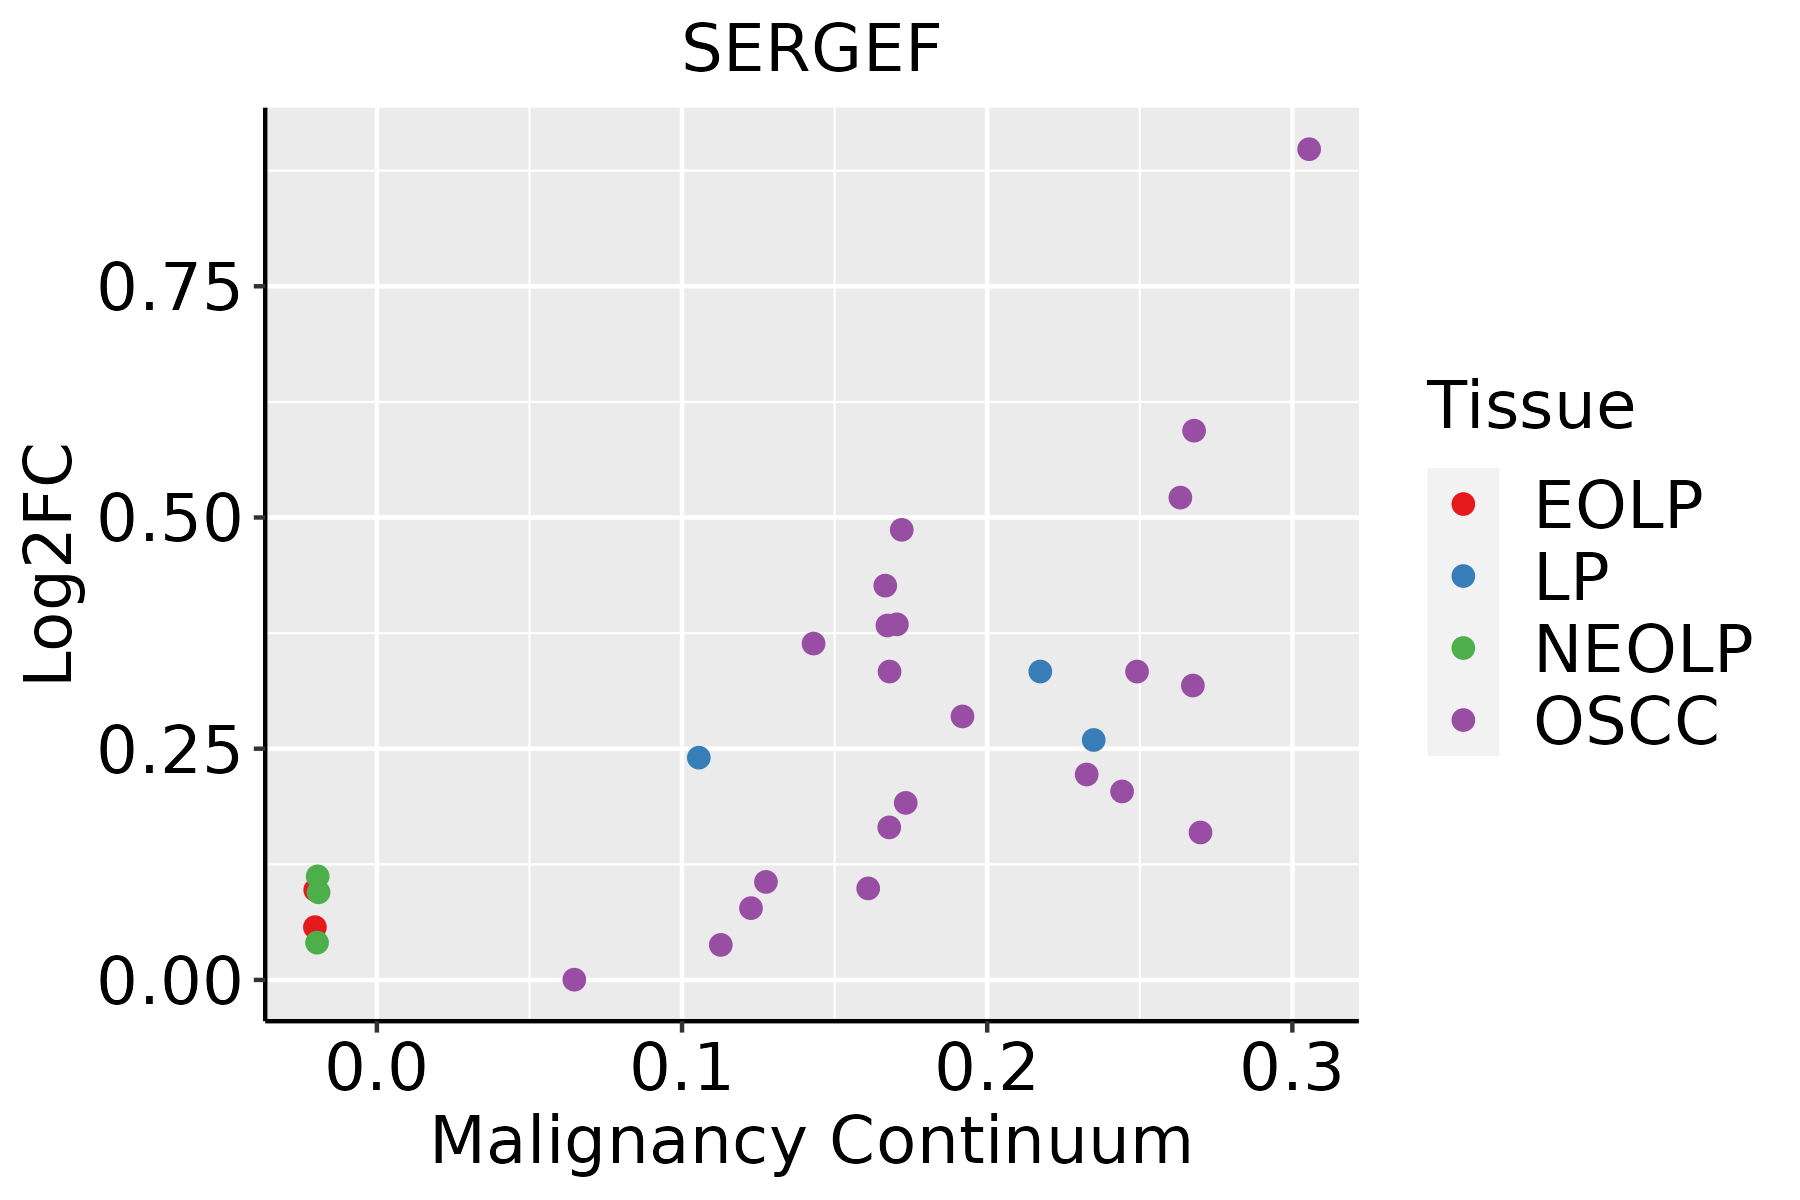 | EOLP: Erosive Oral lichen planus |
| LP: leukoplakia | ||
| NEOLP: Non-erosive oral lichen planus | ||
| OSCC: Oral squamous cell carcinoma | ||
| Thyroid |  | ATC: Anaplastic thyroid cancer |
| HT: Hashimoto's thyroiditis | ||
| PTC: Papillary thyroid cancer |
| ∗log2FC in expression of this searched gene in stem-like cells from each diseased tissue sample relative to stem-like cells in normal samples in each tissue plotted against the malignancy continuum. Samples are colored based on if they are from different disease stage. |
Top |
Malignant transformation related pathway analysis |
| Find out the enriched GO biological processes and KEGG pathways involved in transition from healthy to precancer to cancer |
| Tissue | Disease Stage | Enriched GO biological Processes |
| Colorectum | AD |  |
| Colorectum | SER |  |
| Colorectum | MSS |  |
| Colorectum | MSI-H |  |
| Colorectum | FAP |  |
| ∗Top 15 enriched GO BP terms are showed in the bar plot of each disease state in each tissue. Each row represents a significant GO biological process which is colored according to the -log10(p.adjust). |
| Page: 1 2 3 4 5 6 7 8 9 |
| GO ID | Tissue | Disease Stage | Description | Gene Ratio | Bg Ratio | pvalue | p.adjust | Count |
| GO:00512244 | Esophagus | ESCC | negative regulation of protein transport | 74/8552 | 127/18723 | 2.86e-03 | 1.21e-02 | 74 |
| GO:19049505 | Esophagus | ESCC | negative regulation of establishment of protein localization | 76/8552 | 131/18723 | 2.96e-03 | 1.24e-02 | 76 |
| GO:000930617 | Esophagus | ESCC | protein secretion | 190/8552 | 359/18723 | 3.22e-03 | 1.34e-02 | 190 |
| GO:003559217 | Esophagus | ESCC | establishment of protein localization to extracellular region | 190/8552 | 360/18723 | 3.77e-03 | 1.53e-02 | 190 |
| GO:007169210 | Esophagus | ESCC | protein localization to extracellular region | 193/8552 | 368/18723 | 5.01e-03 | 1.92e-02 | 193 |
| GO:005070810 | Esophagus | ESCC | regulation of protein secretion | 142/8552 | 268/18723 | 9.31e-03 | 3.24e-02 | 142 |
| GO:19049504 | Oral cavity | OSCC | negative regulation of establishment of protein localization | 72/7305 | 131/18723 | 1.51e-04 | 1.06e-03 | 72 |
| GO:00512243 | Oral cavity | OSCC | negative regulation of protein transport | 70/7305 | 127/18723 | 1.65e-04 | 1.14e-03 | 70 |
| GO:000930610 | Oral cavity | OSCC | protein secretion | 169/7305 | 359/18723 | 1.04e-03 | 5.34e-03 | 169 |
| GO:003559210 | Oral cavity | OSCC | establishment of protein localization to extracellular region | 169/7305 | 360/18723 | 1.21e-03 | 6.08e-03 | 169 |
| GO:00716929 | Oral cavity | OSCC | protein localization to extracellular region | 172/7305 | 368/18723 | 1.40e-03 | 6.79e-03 | 172 |
| GO:00507089 | Oral cavity | OSCC | regulation of protein secretion | 126/7305 | 268/18723 | 4.41e-03 | 1.79e-02 | 126 |
| GO:190495012 | Oral cavity | LP | negative regulation of establishment of protein localization | 47/4623 | 131/18723 | 2.73e-03 | 1.92e-02 | 47 |
| GO:005122412 | Oral cavity | LP | negative regulation of protein transport | 45/4623 | 127/18723 | 4.33e-03 | 2.78e-02 | 45 |
| GO:19049507 | Thyroid | PTC | negative regulation of establishment of protein localization | 61/5968 | 131/18723 | 3.01e-04 | 2.12e-03 | 61 |
| GO:00512246 | Thyroid | PTC | negative regulation of protein transport | 59/5968 | 127/18723 | 4.04e-04 | 2.71e-03 | 59 |
| GO:00510518 | Thyroid | PTC | negative regulation of transport | 176/5968 | 470/18723 | 5.44e-03 | 2.49e-02 | 176 |
| GO:007169216 | Thyroid | PTC | protein localization to extracellular region | 139/5968 | 368/18723 | 8.95e-03 | 3.72e-02 | 139 |
| GO:000930618 | Thyroid | PTC | protein secretion | 135/5968 | 359/18723 | 1.16e-02 | 4.58e-02 | 135 |
| GO:003559218 | Thyroid | PTC | establishment of protein localization to extracellular region | 135/5968 | 360/18723 | 1.28e-02 | 4.95e-02 | 135 |
| Page: 1 2 |
| Pathway ID | Tissue | Disease Stage | Description | Gene Ratio | Bg Ratio | pvalue | p.adjust | qvalue | Count |
| Page: 1 |
Top |
Cell-cell communication analysis |
| Identification of potential cell-cell interactions between two cell types and their ligand-receptor pairs for different disease states |
| Ligand | Receptor | LRpair | Pathway | Tissue | Disease Stage |
| Page: 1 |
Top |
Single-cell gene regulatory network inference analysis |
| Find out the significant the regulons (TFs) and the target genes of each regulon across cell types for different disease states |
| TF | Cell Type | Tissue | Disease Stage | Target Gene | RSS | Regulon Activity |
| ∗The dot plots of a searched regulon are shown for all cell subpopulations in each disease state of each tissue based on the regulon specific score inferred using pySCENIC and by calculating the average expression. |
| Page: 1 |
Top |
Somatic mutation of malignant transformation related genes |
| Annotation of somatic variants for genes involved in malignant transformation |
| Hugo Symbol | Variant Class | Variant Classification | dbSNP RS | HGVSc | HGVSp | HGVSp Short | SWISSPROT | BIOTYPE | SIFT | PolyPhen | Tumor Sample Barcode | Tissue | Histology | Sex | Age | Stage | Therapy Types | Drugs | Outcome |
| SERGEF | SNV | Missense_Mutation | novel | c.628N>A | p.Glu210Lys | p.E210K | Q9UGK8 | protein_coding | deleterious(0.02) | possibly_damaging(0.786) | TCGA-GM-A2D9-01 | Breast | breast invasive carcinoma | Female | >=65 | I/II | Hormone Therapy | arimidex | SD |
| SERGEF | insertion | Nonsense_Mutation | novel | c.197_198insATAA | p.Asp66GlufsTer2 | p.D66Efs*2 | Q9UGK8 | protein_coding | TCGA-A8-A0A7-01 | Breast | breast invasive carcinoma | Female | <65 | I/II | Unknown | Unknown | SD | ||
| SERGEF | deletion | Frame_Shift_Del | c.1217delN | p.Pro406LeufsTer? | p.P406Lfs*? | Q9UGK8 | protein_coding | TCGA-AN-A0AK-01 | Breast | breast invasive carcinoma | Female | >=65 | I/II | Unknown | Unknown | SD | |||
| SERGEF | insertion | Frame_Shift_Ins | novel | c.531_532insACTAATGAAAGACATAAAGATGTTGCTTCTTTGATTTTAGCTTT | p.Gly178ThrfsTer44 | p.G178Tfs*44 | Q9UGK8 | protein_coding | TCGA-AN-A0FS-01 | Breast | breast invasive carcinoma | Female | <65 | I/II | Unknown | Unknown | SD | ||
| SERGEF | insertion | Frame_Shift_Ins | novel | c.732_733insTCAAAGTATTC | p.Ala245SerfsTer17 | p.A245Sfs*17 | Q9UGK8 | protein_coding | TCGA-BH-A0HF-01 | Breast | breast invasive carcinoma | Female | >=65 | I/II | Hormone Therapy | arimidex | SD | ||
| SERGEF | insertion | Frame_Shift_Ins | novel | c.730_731insCCAAGATCTGTTATCA | p.Leu244ProfsTer8 | p.L244Pfs*8 | Q9UGK8 | protein_coding | TCGA-BH-A0HF-01 | Breast | breast invasive carcinoma | Female | >=65 | I/II | Hormone Therapy | arimidex | SD | ||
| SERGEF | SNV | Missense_Mutation | c.574N>A | p.Gln192Lys | p.Q192K | Q9UGK8 | protein_coding | tolerated(0.57) | benign(0) | TCGA-AA-3672-01 | Colorectum | colon adenocarcinoma | Female | >=65 | III/IV | Unknown | Unknown | SD | |
| SERGEF | SNV | Missense_Mutation | c.230A>C | p.Lys77Thr | p.K77T | Q9UGK8 | protein_coding | tolerated(0.08) | possibly_damaging(0.476) | TCGA-CA-6718-01 | Colorectum | colon adenocarcinoma | Male | <65 | I/II | Unknown | Unknown | PD | |
| SERGEF | SNV | Missense_Mutation | c.299G>A | p.Gly100Asp | p.G100D | Q9UGK8 | protein_coding | tolerated(0.08) | benign(0.011) | TCGA-CK-4951-01 | Colorectum | colon adenocarcinoma | Female | >=65 | I/II | Unknown | Unknown | PD | |
| SERGEF | SNV | Missense_Mutation | rs774761000 | c.965C>T | p.Pro322Leu | p.P322L | Q9UGK8 | protein_coding | tolerated(0.33) | benign(0) | TCGA-QL-A97D-01 | Colorectum | colon adenocarcinoma | Female | >=65 | I/II | Unknown | Unknown | SD |
| Page: 1 2 3 4 5 |
Top |
Related drugs of malignant transformation related genes |
| Identification of chemicals and drugs interact with genes involved in malignant transfromation |
| (DGIdb 4.0) |
| Entrez ID | Symbol | Category | Interaction Types | Drug Claim Name | Drug Name | PMIDs |
| Page: 1 |

Copyright 2023-Present -The University of Texas Health Science Center at Houston |