Schematic overview of the cellular and molecular mechanisms involved in the cancer progression, including the proposed cellular and molecular mechanisms in cancer cells trajectory. AT1: alveolar type 1 cells; AT2: alveolar type 2 cells; AAH: atypical adenomatous hyperplasia; AIS: adenocarcinoma in situ; MIA: minimally invasive adenocarcinoma; IA: invasive adenocarcinoma; EMT: epithelial-mesenchymal transition

Home

Download

Statistics

Help

Contact

Center for Computational Systems Medicine
leaf

Gene summary

leaf

Malignant transformation analysis

leaf

Malignant transformation related pathway analysis

leaf

Cell-cell communication analysis

leaf

Single-cell gene regulatory network inference analysis

leaf

Somatic mutation of malignant transformation related genes

leaf

Related drugs of malignant transformation related genes

Gene: SERBP1

Gene summary for SERBP1

check button Gene summary.

Gene informationSpeciesHuman
Gene symbol

SERBP1

Gene ID

26135

Gene nameSERPINE1 mRNA binding protein 1
Gene AliasCGI-55
Cytomap1p31.3
Gene Typeprotein-coding
GO ID

GO:0006139

UniProtAcc

Q8NC51


Top

Malignant transformation analysis

check button Identification of the aberrant gene expression in precancerous and cancerous lesions by comparing the gene expression of stem-like cells in diseased tissues with normal stem cells
check button Malignant transformation involving gene list.
Entrez IDSymbolReplicatesSpeciesOrganTissueAdj P-valueLog2FCMalignancy
26135SERBP1CA_HPV_1HumanCervixCC1.81e-06-6.72e-020.0264
26135SERBP1CA_HPV_3HumanCervixCC1.80e-031.39e-010.0414
26135SERBP1N_HPV_2HumanCervixN_HPV1.29e-021.18e-01-0.0131
26135SERBP1CCII_1HumanCervixCC4.19e-29-9.19e-010.3249
26135SERBP1sample1HumanCervixCC4.52e-06-4.62e-010.0959
26135SERBP1sample3HumanCervixCC5.59e-05-2.17e-020.1387
26135SERBP1L1HumanCervixCC2.57e-07-6.48e-020.0802
26135SERBP1T1HumanCervixCC7.57e-20-5.51e-010.0918
26135SERBP1T3HumanCervixCC1.03e-03-1.22e-020.1389
26135SERBP1HTA11_1938_2000001011HumanColorectumAD1.90e-076.91e-01-0.0811
26135SERBP1HTA11_78_2000001011HumanColorectumAD2.61e-086.90e-01-0.1088
26135SERBP1HTA11_347_2000001011HumanColorectumAD5.40e-229.97e-01-0.1954
26135SERBP1HTA11_83_2000001011HumanColorectumSER2.40e-046.10e-01-0.1526
26135SERBP1HTA11_696_2000001011HumanColorectumAD1.35e-106.40e-01-0.1464
26135SERBP1HTA11_866_2000001011HumanColorectumAD1.04e-054.79e-01-0.1001
26135SERBP1HTA11_1391_2000001011HumanColorectumAD3.08e-129.71e-01-0.059
26135SERBP1HTA11_546_2000001011HumanColorectumAD3.15e-045.89e-01-0.0842
26135SERBP1HTA11_866_3004761011HumanColorectumAD3.49e-096.62e-010.096
26135SERBP1HTA11_7663_2000001011HumanColorectumSER1.19e-058.94e-010.0131
26135SERBP1HTA11_10623_2000001011HumanColorectumAD6.85e-036.59e-01-0.0177
Page: 1 2 3 4 5 6 7 8 9 10 11 12 

check button Transcriptomic changes along malignancy continuum.
TissueExpression DynamicsAbbreviation
CervixThe image shows the transcriptomic changes along malignancy continuum.log2FC in expression of this searched gene in stem-like cells from each diseased tissue sample relative to stem-like cells in normal samples in each tissue plotted against the malignancy continuum. Samples are colored based on if they are from different disease stage.CC: Cervix cancer
HSIL_HPV: HPV-infected high-grade squamous intraepithelial lesions
N_HPV: HPV-infected normal cervix
Colorectum (GSE201348)The image shows the transcriptomic changes along malignancy continuum.log2FC in expression of this searched gene in stem-like cells from each diseased tissue sample relative to stem-like cells in normal samples in each tissue plotted against the malignancy continuum. Samples are colored based on if they are from different disease stage.
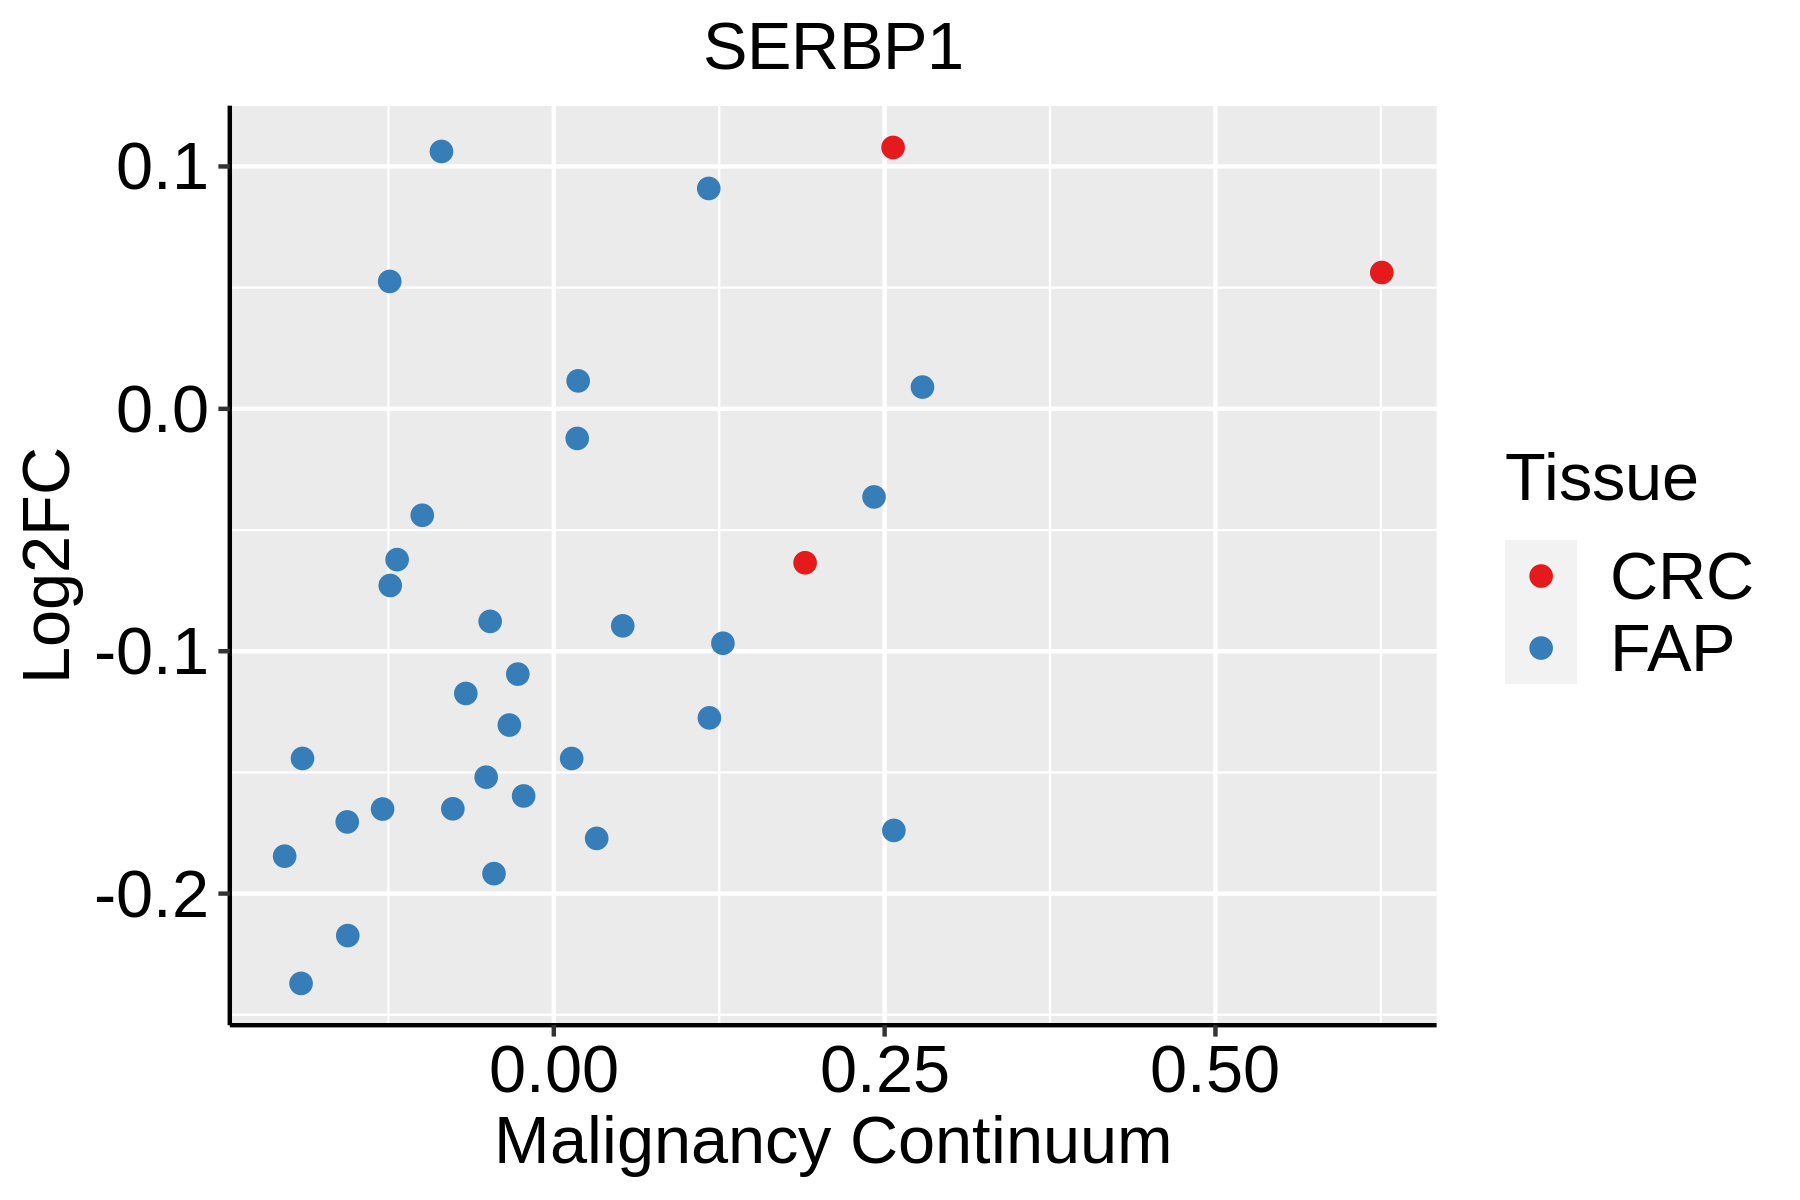
FAP: Familial adenomatous polyposis
CRC: Colorectal cancer
Colorectum (HTA11)The image shows the transcriptomic changes along malignancy continuum.log2FC in expression of this searched gene in stem-like cells from each diseased tissue sample relative to stem-like cells in normal samples in each tissue plotted against the malignancy continuum. Samples are colored based on if they are from different disease stage.AD: Adenomas
SER: Sessile serrated lesions
MSI-H: Microsatellite-high colorectal cancer
MSS: Microsatellite stable colorectal cancer
EndometriumThe image shows the transcriptomic changes along malignancy continuum.log2FC in expression of this searched gene in stem-like cells from each diseased tissue sample relative to stem-like cells in normal samples in each tissue plotted against the malignancy continuum. Samples are colored based on if they are from different disease stage.AEH: Atypical endometrial hyperplasia
EEC: Endometrioid Cancer
EsophagusThe image shows the transcriptomic changes along malignancy continuum.log2FC in expression of this searched gene in stem-like cells from each diseased tissue sample relative to stem-like cells in normal samples in each tissue plotted against the malignancy continuum. Samples are colored based on if they are from different disease stage.
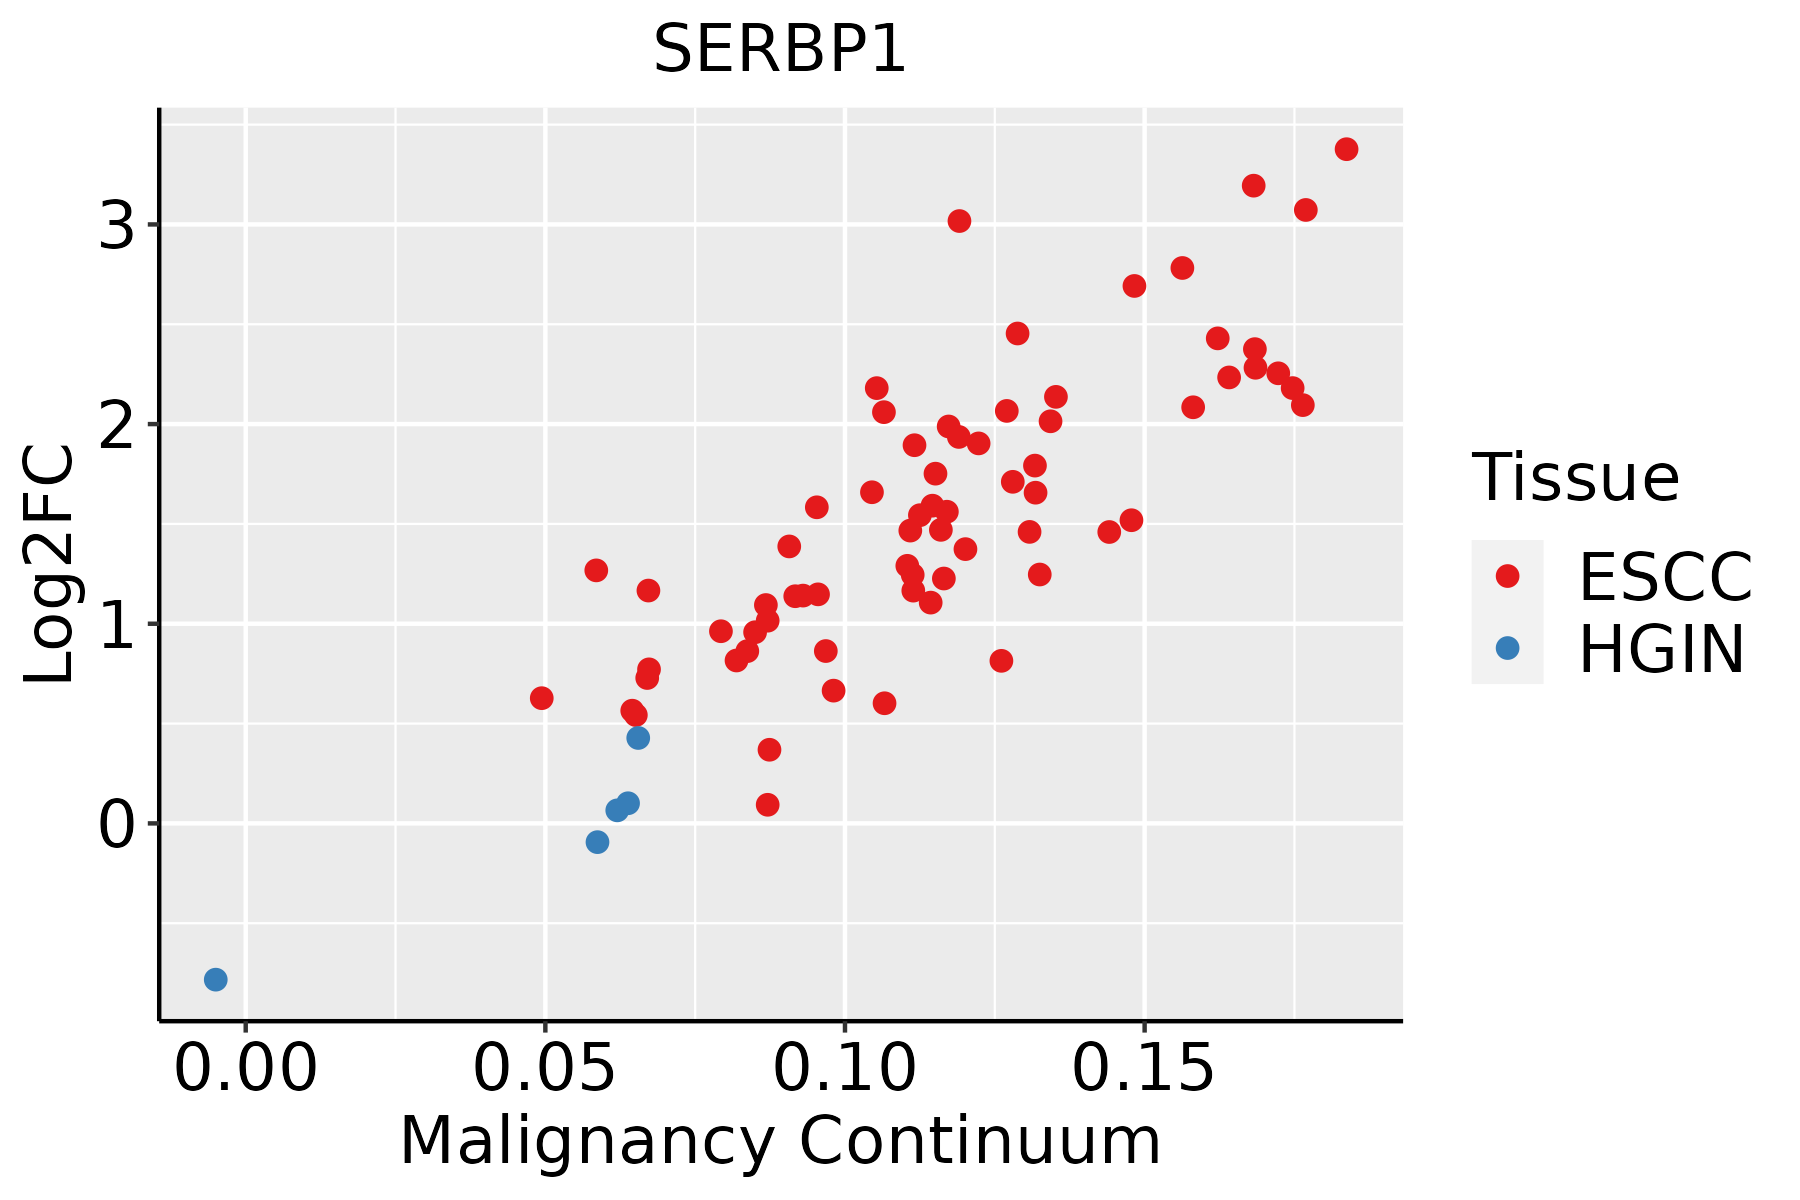
ESCC: Esophageal squamous cell carcinoma
HGIN: High-grade intraepithelial neoplasias
LGIN: Low-grade intraepithelial neoplasias
LiverThe image shows the transcriptomic changes along malignancy continuum.log2FC in expression of this searched gene in stem-like cells from each diseased tissue sample relative to stem-like cells in normal samples in each tissue plotted against the malignancy continuum. Samples are colored based on if they are from different disease stage.HCC: Hepatocellular carcinoma
NAFLD: Non-alcoholic fatty liver disease
Oral CavityThe image shows the transcriptomic changes along malignancy continuum.log2FC in expression of this searched gene in stem-like cells from each diseased tissue sample relative to stem-like cells in normal samples in each tissue plotted against the malignancy continuum. Samples are colored based on if they are from different disease stage.
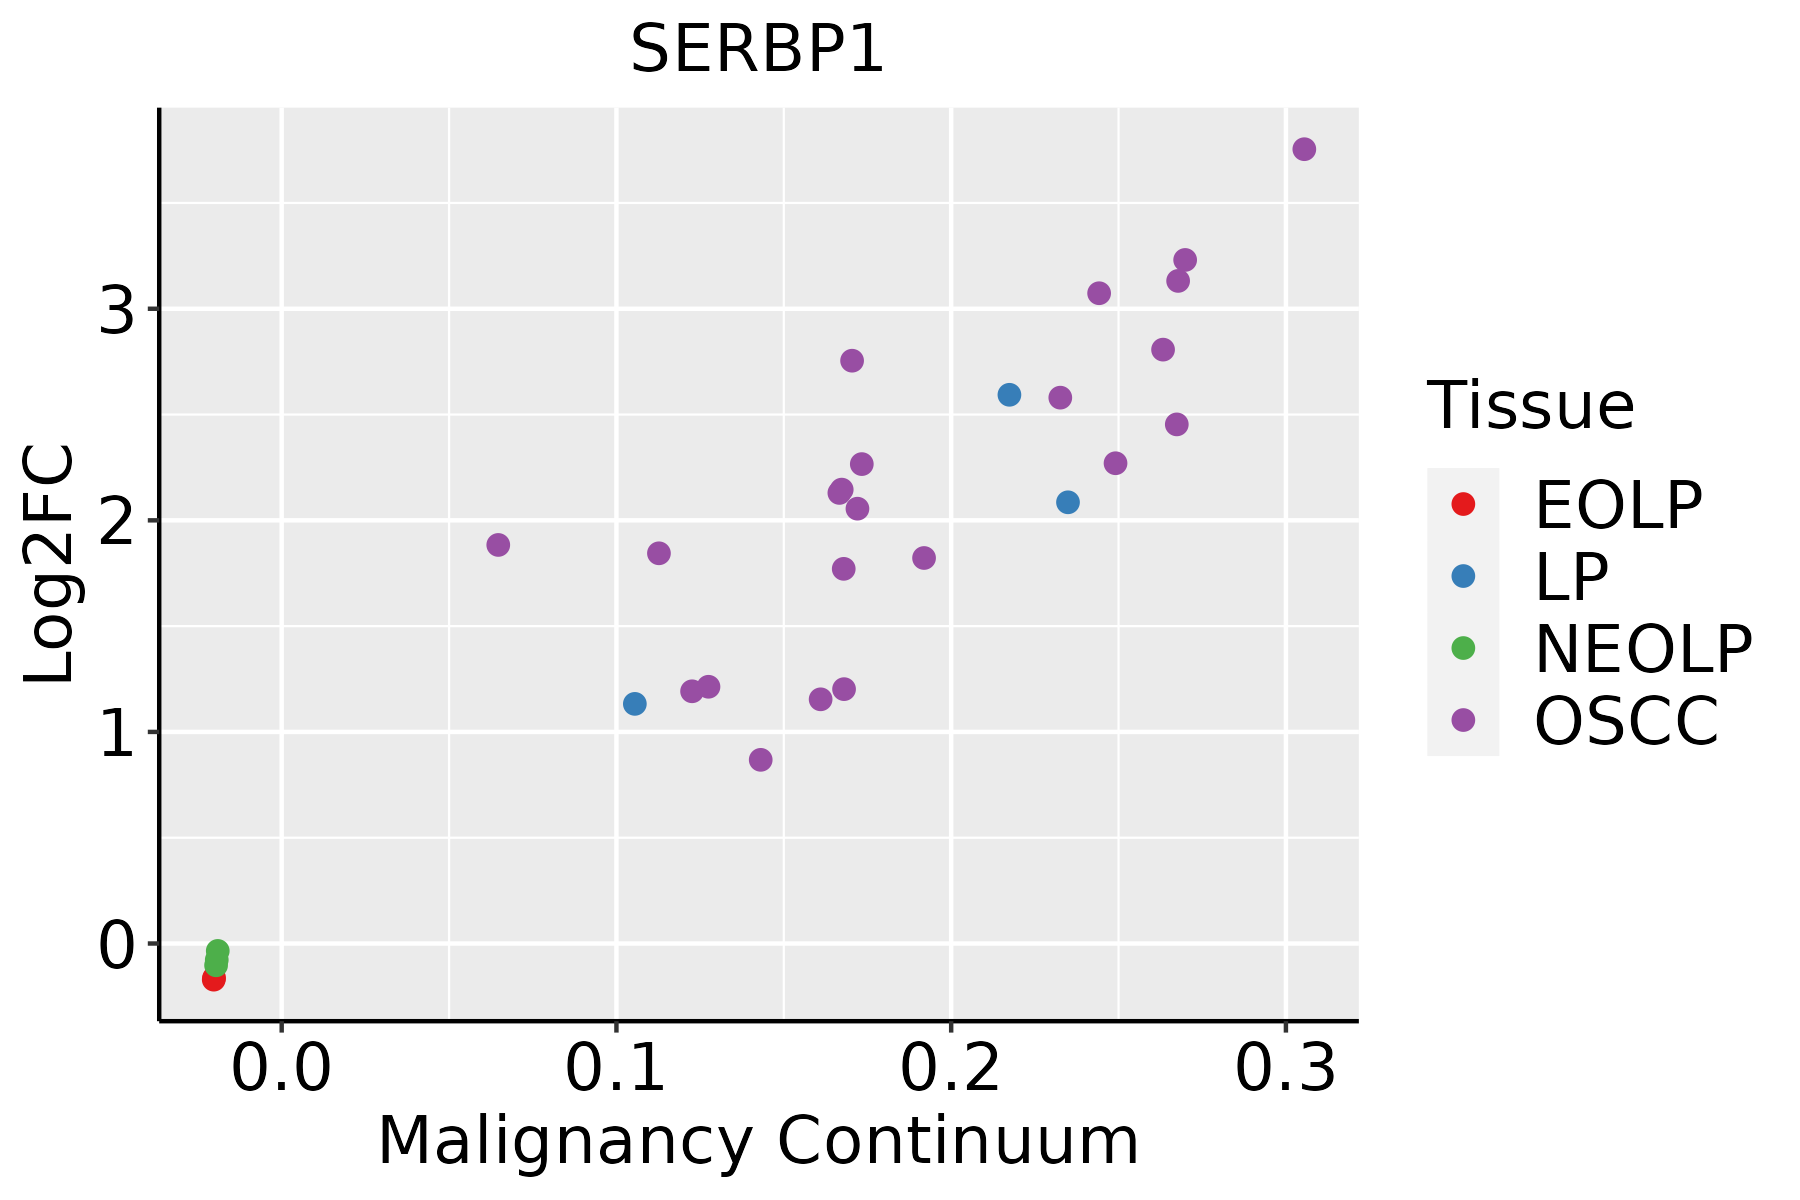
EOLP: Erosive Oral lichen planus
LP: leukoplakia
NEOLP: Non-erosive oral lichen planus
OSCC: Oral squamous cell carcinoma
ProstateThe image shows the transcriptomic changes along malignancy continuum.log2FC in expression of this searched gene in stem-like cells from each diseased tissue sample relative to stem-like cells in normal samples in each tissue plotted against the malignancy continuum. Samples are colored based on if they are from different disease stage.
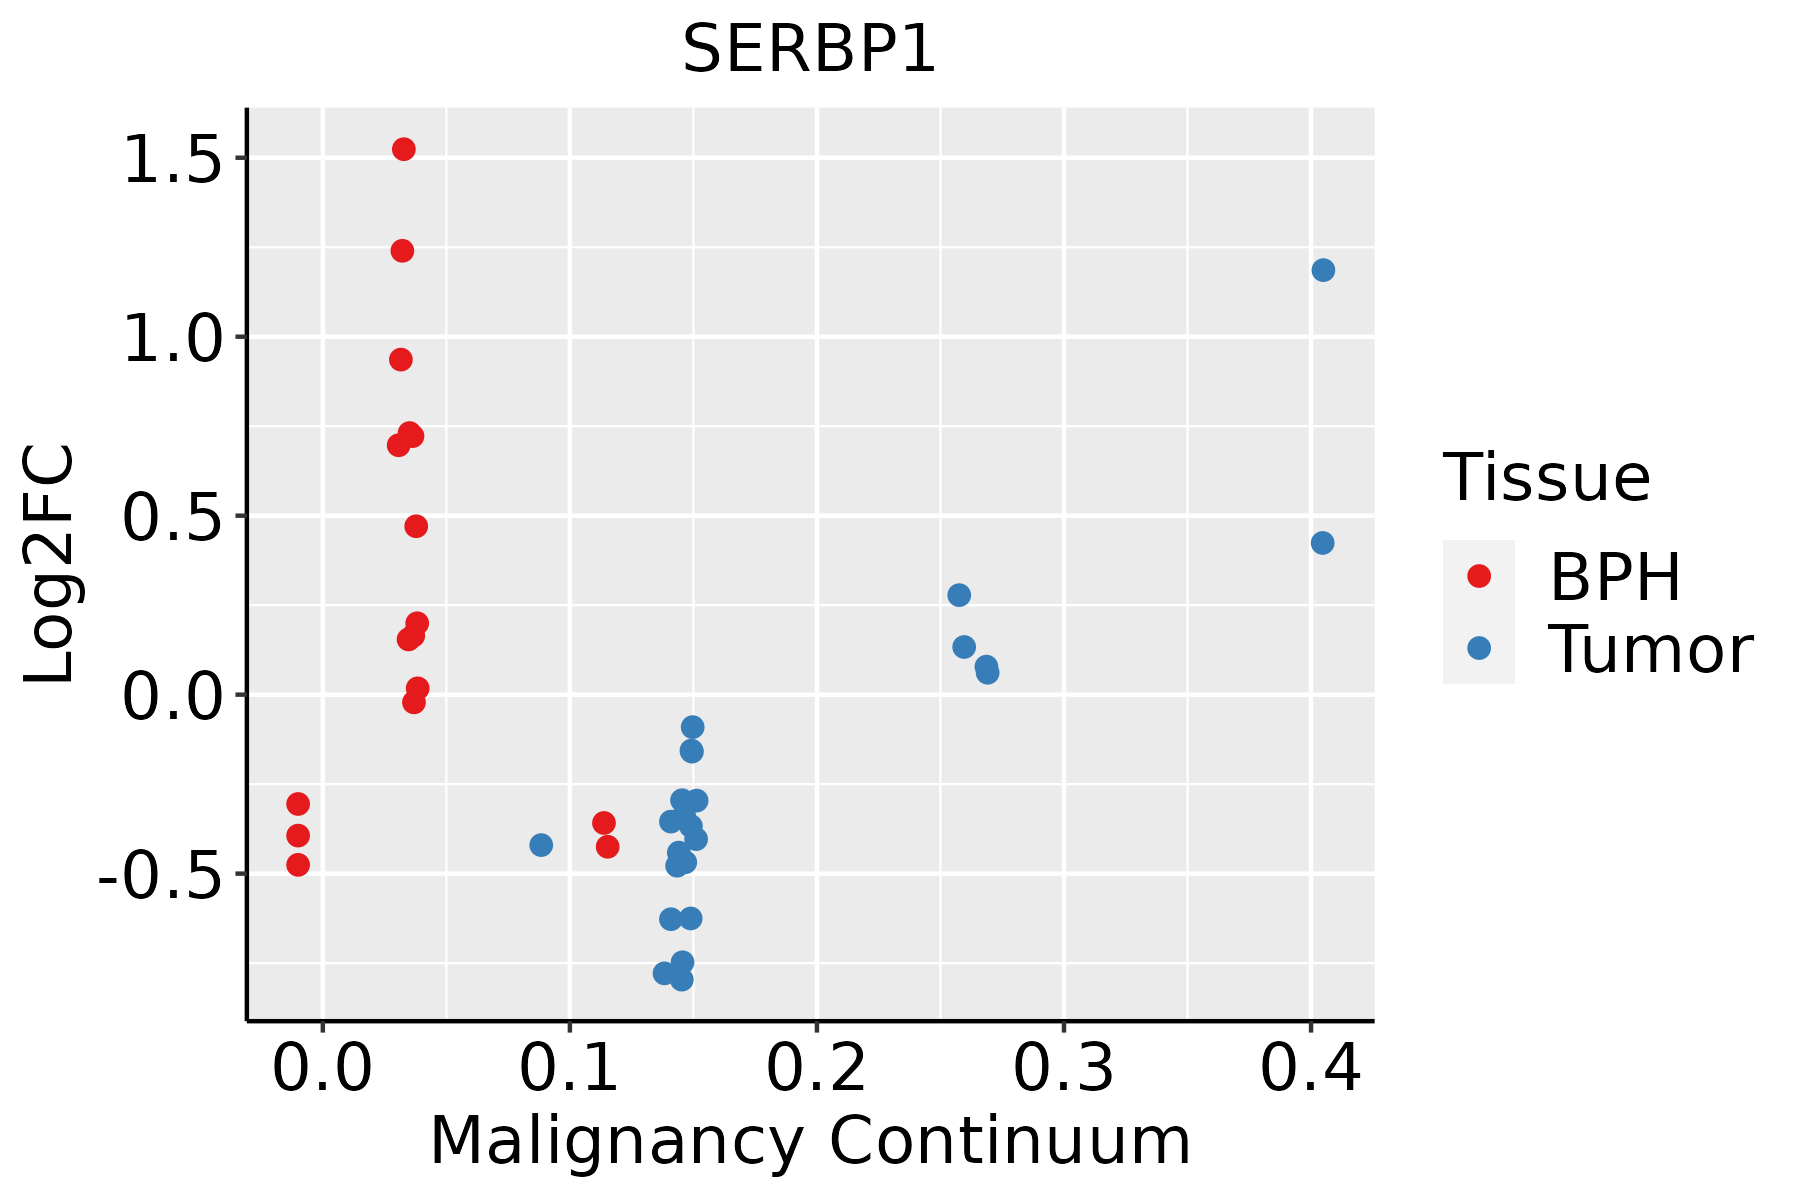
BPH: Benign Prostatic Hyperplasia
SkinThe image shows the transcriptomic changes along malignancy continuum.log2FC in expression of this searched gene in stem-like cells from each diseased tissue sample relative to stem-like cells in normal samples in each tissue plotted against the malignancy continuum. Samples are colored based on if they are from different disease stage.
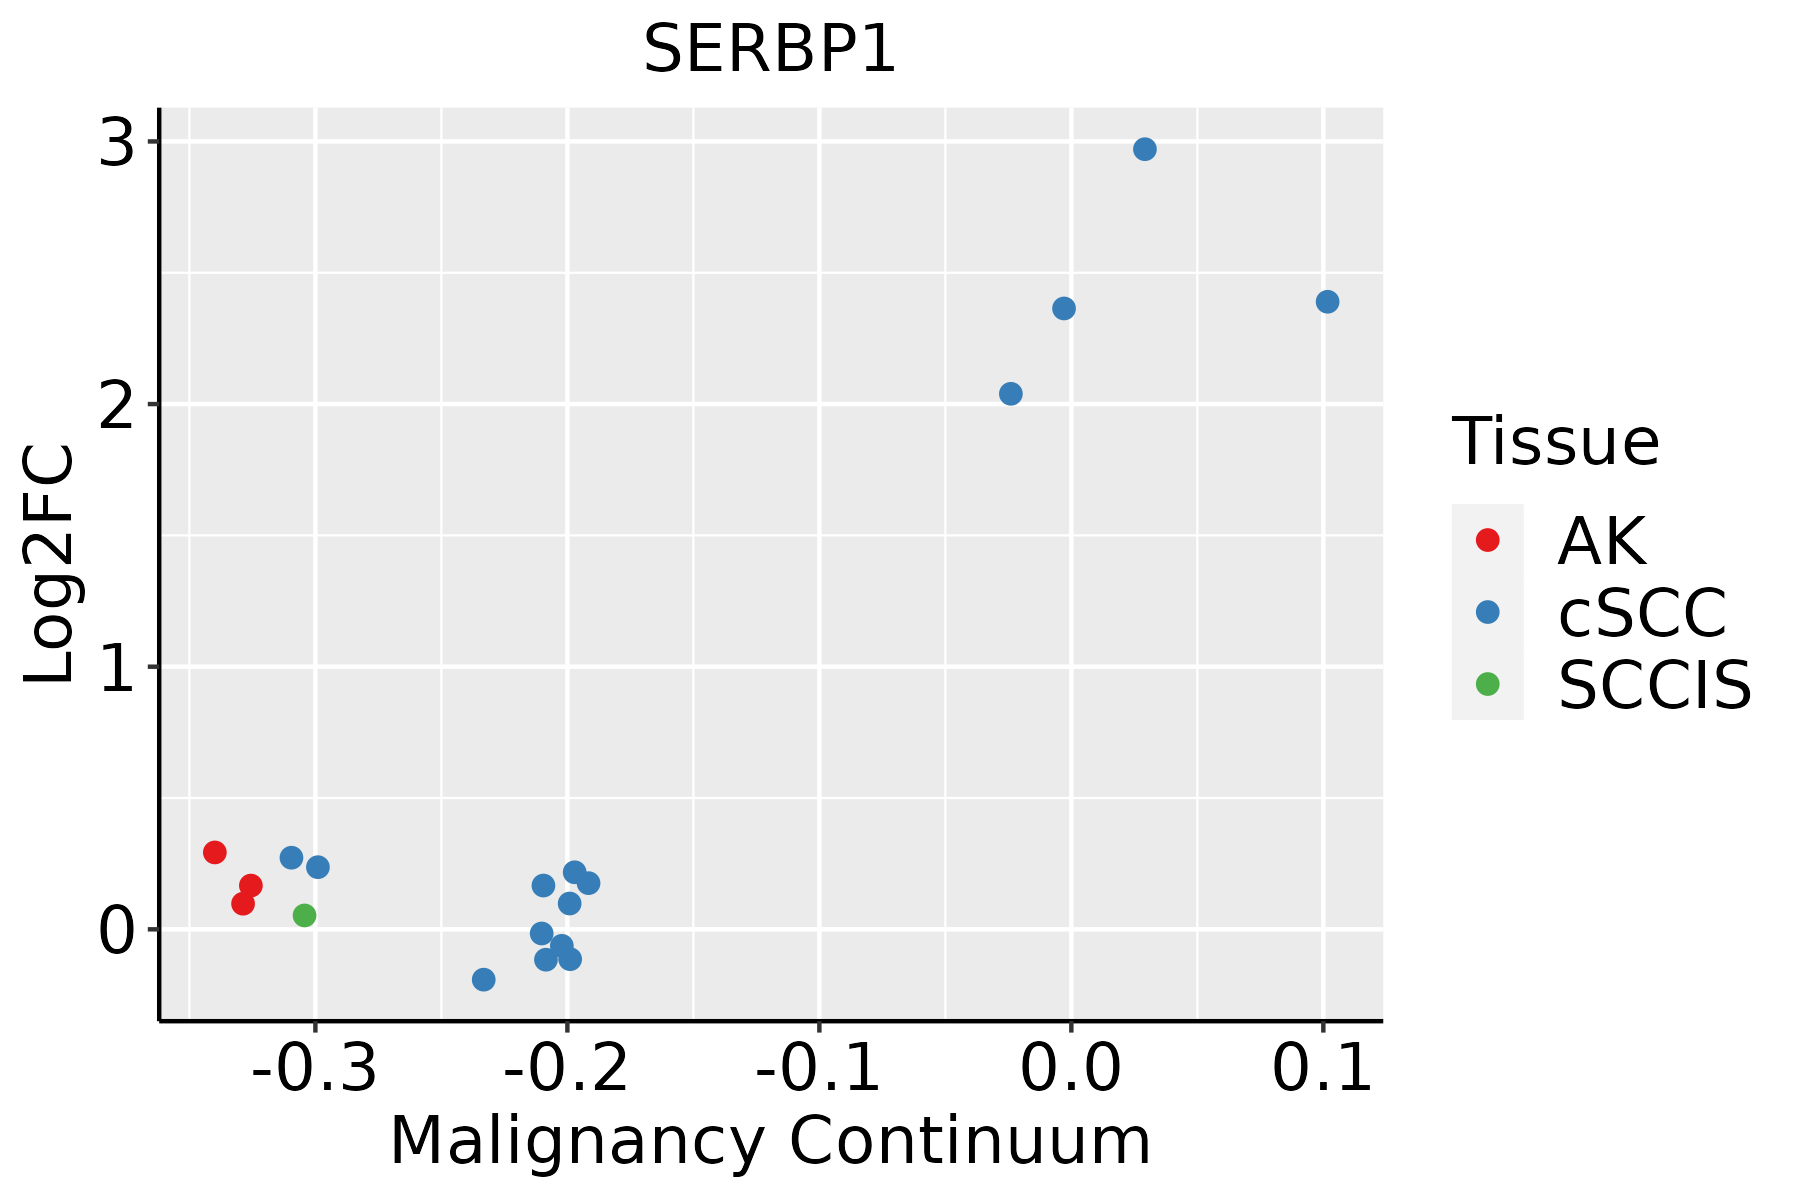
AK: Actinic keratosis
cSCC: Cutaneous squamous cell carcinoma
SCCIS:squamous cell carcinoma in situ
ThyroidThe image shows the transcriptomic changes along malignancy continuum.log2FC in expression of this searched gene in stem-like cells from each diseased tissue sample relative to stem-like cells in normal samples in each tissue plotted against the malignancy continuum. Samples are colored based on if they are from different disease stage.
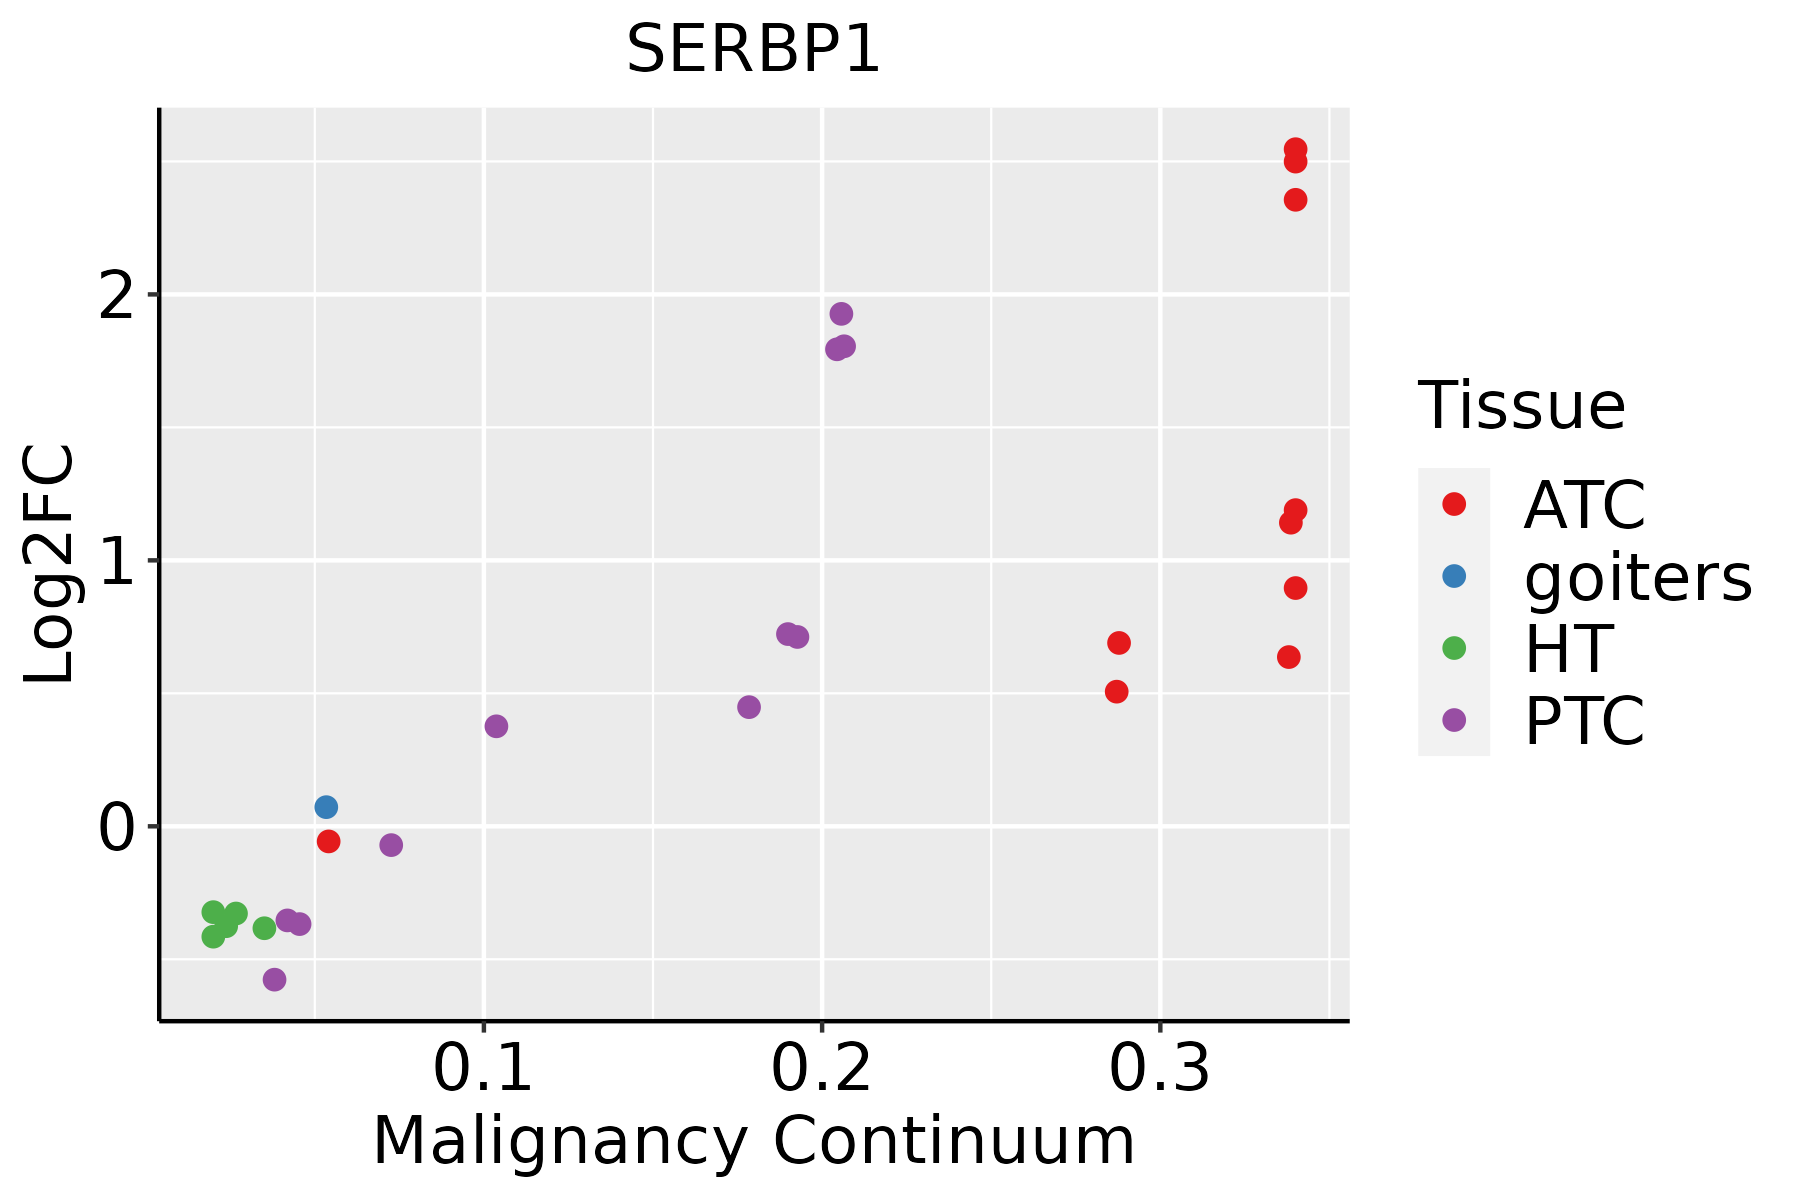
ATC: Anaplastic thyroid cancer
HT: Hashimoto's thyroiditis
PTC: Papillary thyroid cancer
∗log2FC in expression of this searched gene in stem-like cells from each diseased tissue sample relative to stem-like cells in normal samples in each tissue plotted against the malignancy continuum. Samples are colored based on if they are from different disease stage.

Top

Malignant transformation related pathway analysis

check buttonFind out the enriched GO biological processes and KEGG pathways involved in transition from healthy to precancer to cancer
check button Figure of enriched GO biological processes.
TissueDisease StageEnriched GO biological Processes
ColorectumADGO analysis - Figure of enriched GO biological processes: Top 15 enriched GO BP terms are showed in the bar plot of each disease state in each tissue. Each row represents a significant GO biological process which is colored according to the -log10(p.adjust).
ColorectumSERGO analysis - Figure of enriched GO biological processes: Top 15 enriched GO BP terms are showed in the bar plot of each disease state in each tissue. Each row represents a significant GO biological process which is colored according to the -log10(p.adjust).
ColorectumMSSGO analysis - Figure of enriched GO biological processes: Top 15 enriched GO BP terms are showed in the bar plot of each disease state in each tissue. Each row represents a significant GO biological process which is colored according to the -log10(p.adjust).
ColorectumMSI-HGO analysis - Figure of enriched GO biological processes: Top 15 enriched GO BP terms are showed in the bar plot of each disease state in each tissue. Each row represents a significant GO biological process which is colored according to the -log10(p.adjust).
ColorectumFAPGO analysis - Figure of enriched GO biological processes: Top 15 enriched GO BP terms are showed in the bar plot of each disease state in each tissue. Each row represents a significant GO biological process which is colored according to the -log10(p.adjust).
∗Top 15 enriched GO BP terms are showed in the bar plot of each disease state in each tissue. Each row represents a significant GO biological process which is colored according to the -log10(p.adjust).
Page: 1 2 3 4 5 6 7 8 9 

check button Enriched GO biological processes.
GO IDTissueDisease StageDescriptionGene RatioBg Ratiopvaluep.adjustCount
GO:00064029CervixCCmRNA catabolic process56/2311232/187234.81e-071.83e-0556
GO:19033119CervixCCregulation of mRNA metabolic process64/2311288/187231.71e-065.64e-0564
GO:00064019CervixCCRNA catabolic process62/2311278/187232.18e-066.56e-0562
GO:00610139CervixCCregulation of mRNA catabolic process38/2311166/187231.07e-041.36e-0338
GO:00467008CervixCCheterocycle catabolic process80/2311445/187233.23e-043.42e-0380
GO:00346559CervixCCnucleobase-containing compound catabolic process74/2311407/187233.77e-043.88e-0374
GO:00434889CervixCCregulation of mRNA stability35/2311158/187233.80e-043.89e-0335
GO:00434879CervixCCregulation of RNA stability36/2311170/187237.72e-046.86e-0336
GO:00442709CervixCCcellular nitrogen compound catabolic process79/2311451/187237.80e-046.91e-0379
GO:00194398CervixCCaromatic compound catabolic process79/2311467/187232.14e-031.54e-0279
GO:19013618CervixCCorganic cyclic compound catabolic process80/2311495/187236.77e-033.72e-0280
GO:000640214CervixN_HPVmRNA catabolic process17/534232/187233.76e-045.43e-0317
GO:190331114CervixN_HPVregulation of mRNA metabolic process18/534288/187231.63e-031.68e-0218
GO:000640114CervixN_HPVRNA catabolic process17/534278/187232.72e-032.39e-0217
GO:1903311ColorectumADregulation of mRNA metabolic process117/3918288/187231.69e-144.23e-12117
GO:0006401ColorectumADRNA catabolic process102/3918278/187238.64e-106.76e-08102
GO:0044270ColorectumADcellular nitrogen compound catabolic process147/3918451/187233.35e-092.23e-07147
GO:0046700ColorectumADheterocycle catabolic process145/3918445/187234.37e-092.84e-07145
GO:0006402ColorectumADmRNA catabolic process87/3918232/187234.40e-092.84e-0787
GO:0034655ColorectumADnucleobase-containing compound catabolic process133/3918407/187231.56e-089.12e-07133
Page: 1 2 3 4 5 6 7 8 9 10 11 12 13 14 15 

check button Enriched KEGG pathways.
Pathway IDTissueDisease StageDescriptionGene RatioBg Ratiopvaluep.adjustqvalueCount
Page: 1 

Top

Cell-cell communication analysis

check buttonIdentification of potential cell-cell interactions between two cell types and their ligand-receptor pairs for different disease states
LigandReceptorLRpairPathwayTissueDisease Stage
Page: 1 

Top

Single-cell gene regulatory network inference analysis

check buttonFind out the significant the regulons (TFs) and the target genes of each regulon across cell types for different disease states
TFCell TypeTissueDisease StageTarget GeneRSSRegulon Activity
∗The dot plots of a searched regulon are shown for all cell subpopulations in each disease state of each tissue based on the regulon specific score inferred using pySCENIC and by calculating the average expression.
Page: 1 

Top

Somatic mutation of malignant transformation related genes

check buttonAnnotation of somatic variants for genes involved in malignant transformation
Hugo SymbolVariant ClassVariant ClassificationdbSNP RSHGVScHGVSpHGVSp ShortSWISSPROTBIOTYPESIFTPolyPhenTumor Sample BarcodeTissueHistologySexAgeStageTherapy TypesDrugsOutcome
SERBP1SNVMissense_Mutationnovelc.197N>Ap.Ala66Glup.A66EQ8NC51protein_codingdeleterious(0.03)probably_damaging(0.987)TCGA-AR-A1AL-01Breastbreast invasive carcinomaFemale<65III/IVHormone TherapyanastrozoleSD
SERBP1SNVMissense_Mutationc.448G>Ap.Glu150Lysp.E150KQ8NC51protein_codingtolerated(0.21)probably_damaging(0.988)TCGA-D8-A27N-01Breastbreast invasive carcinomaFemale<65III/IVChemotherapytaxol+adriamycin+cyclophosphamide+herceptinSD
SERBP1SNVMissense_Mutationnovelc.845N>Tp.Glu282Valp.E282VQ8NC51protein_codingdeleterious(0)probably_damaging(0.917)TCGA-E2-A15S-01Breastbreast invasive carcinomaFemale<65I/IIChemotherapydoxorubicinSD
SERBP1SNVMissense_Mutationrs767934992c.562C>Tp.Arg188Cysp.R188CQ8NC51protein_codingdeleterious(0)possibly_damaging(0.796)TCGA-IR-A3LF-01Cervixcervical & endocervical cancerFemale<65I/IIUnknownUnknownSD
SERBP1SNVMissense_Mutationc.946G>Ap.Asp316Asnp.D316NQ8NC51protein_codingtolerated(0.34)benign(0.145)TCGA-JX-A5QV-01Cervixcervical & endocervical cancerFemale<65I/IIUnknownUnknownSD
SERBP1SNVMissense_Mutationnovelc.901N>Tp.Arg301Trpp.R301WQ8NC51protein_codingtolerated(0.06)benign(0.178)TCGA-VS-A9UH-01Cervixcervical & endocervical cancerFemale<65I/IIChemotherapycisplatinCR
SERBP1insertionNonsense_Mutationnovelc.567_568insTCCAAATGCTTATTCATAACATTTTTATGTAATCTTAATAGGTAAGp.Lys190SerfsTer15p.K190Sfs*15Q8NC51protein_codingTCGA-EA-A5O9-01Cervixcervical & endocervical cancerFemale<65I/IIUnknownUnknownSD
SERBP1SNVMissense_Mutationnovelc.1055N>Tp.Thr352Metp.T352MQ8NC51protein_codingtolerated(0.05)benign(0.36)TCGA-A6-2672-01Colorectumcolon adenocarcinomaFemale>=65III/IVUnknownUnknownSD
SERBP1SNVMissense_Mutationc.295N>Ap.Val99Metp.V99MQ8NC51protein_codingtolerated(0.16)possibly_damaging(0.682)TCGA-AA-A00O-01Colorectumcolon adenocarcinomaFemale>=65III/IVUnknownUnknownSD
SERBP1SNVMissense_Mutationnovelc.892N>Gp.Asn298Aspp.N298DQ8NC51protein_codingtolerated(0.83)benign(0.006)TCGA-CA-6717-01Colorectumcolon adenocarcinomaMale<65I/IIChemotherapyoxaliplatinCR
Page: 1 2 3 4 5 6 

Top

Related drugs of malignant transformation related genes

check buttonIdentification of chemicals and drugs interact with genes involved in malignant transfromation
(DGIdb 4.0)
Entrez IDSymbolCategoryInteraction TypesDrug Claim NameDrug NamePMIDs
Page: 1