
|
|||||
|
 | |
| |
| |
| |
| |
| |
|
Gene: SEPTIN7 |
Gene summary for SEPTIN7 |
| Gene information | Species | Human | Gene symbol | SEPTIN7 | Gene ID | 989 |
| Gene name | septin 7 | |
| Gene Alias | CDC10 | |
| Cytomap | 7p14.2 | |
| Gene Type | protein-coding | GO ID | GO:0000003 | UniProtAcc | A8K3D0 |
Top |
Malignant transformation analysis |
| Identification of the aberrant gene expression in precancerous and cancerous lesions by comparing the gene expression of stem-like cells in diseased tissues with normal stem cells |
| Entrez ID | Symbol | Replicates | Species | Organ | Tissue | Adj P-value | Log2FC | Malignancy |
| 989 | SEPTIN7 | CA_HPV_1 | Human | Cervix | CC | 6.50e-10 | -1.41e-01 | 0.0264 |
| 989 | SEPTIN7 | CA_HPV_3 | Human | Cervix | CC | 1.14e-04 | 7.19e-02 | 0.0414 |
| 989 | SEPTIN7 | CCII_1 | Human | Cervix | CC | 8.74e-13 | -6.98e-01 | 0.3249 |
| 989 | SEPTIN7 | Tumor | Human | Cervix | CC | 3.71e-62 | -9.20e-01 | 0.1241 |
| 989 | SEPTIN7 | sample1 | Human | Cervix | CC | 9.02e-03 | -4.80e-01 | 0.0959 |
| 989 | SEPTIN7 | sample3 | Human | Cervix | CC | 1.40e-15 | 4.07e-01 | 0.1387 |
| 989 | SEPTIN7 | L1 | Human | Cervix | CC | 2.88e-07 | -2.56e-01 | 0.0802 |
| 989 | SEPTIN7 | T1 | Human | Cervix | CC | 9.13e-10 | -4.84e-01 | 0.0918 |
| 989 | SEPTIN7 | T3 | Human | Cervix | CC | 1.39e-13 | 3.88e-01 | 0.1389 |
| 989 | SEPTIN7 | HTA11_3410_2000001011 | Human | Colorectum | AD | 9.84e-06 | 1.59e-01 | 0.0155 |
| 989 | SEPTIN7 | HTA11_2487_2000001011 | Human | Colorectum | SER | 1.32e-08 | 2.66e-01 | -0.1808 |
| 989 | SEPTIN7 | HTA11_1938_2000001011 | Human | Colorectum | AD | 2.77e-18 | 5.26e-01 | -0.0811 |
| 989 | SEPTIN7 | HTA11_78_2000001011 | Human | Colorectum | AD | 6.88e-27 | 5.45e-01 | -0.1088 |
| 989 | SEPTIN7 | HTA11_347_2000001011 | Human | Colorectum | AD | 3.67e-47 | 8.18e-01 | -0.1954 |
| 989 | SEPTIN7 | HTA11_411_2000001011 | Human | Colorectum | SER | 3.33e-15 | 7.46e-01 | -0.2602 |
| 989 | SEPTIN7 | HTA11_2112_2000001011 | Human | Colorectum | SER | 1.71e-03 | 2.44e-01 | -0.2196 |
| 989 | SEPTIN7 | HTA11_3361_2000001011 | Human | Colorectum | AD | 1.34e-03 | 1.69e-01 | -0.1207 |
| 989 | SEPTIN7 | HTA11_83_2000001011 | Human | Colorectum | SER | 3.64e-05 | 2.04e-01 | -0.1526 |
| 989 | SEPTIN7 | HTA11_696_2000001011 | Human | Colorectum | AD | 1.75e-18 | 3.26e-01 | -0.1464 |
| 989 | SEPTIN7 | HTA11_866_2000001011 | Human | Colorectum | AD | 4.93e-21 | 3.59e-01 | -0.1001 |
| Page: 1 2 3 4 5 6 7 8 9 |
| Tissue | Expression Dynamics | Abbreviation |
| Cervix | 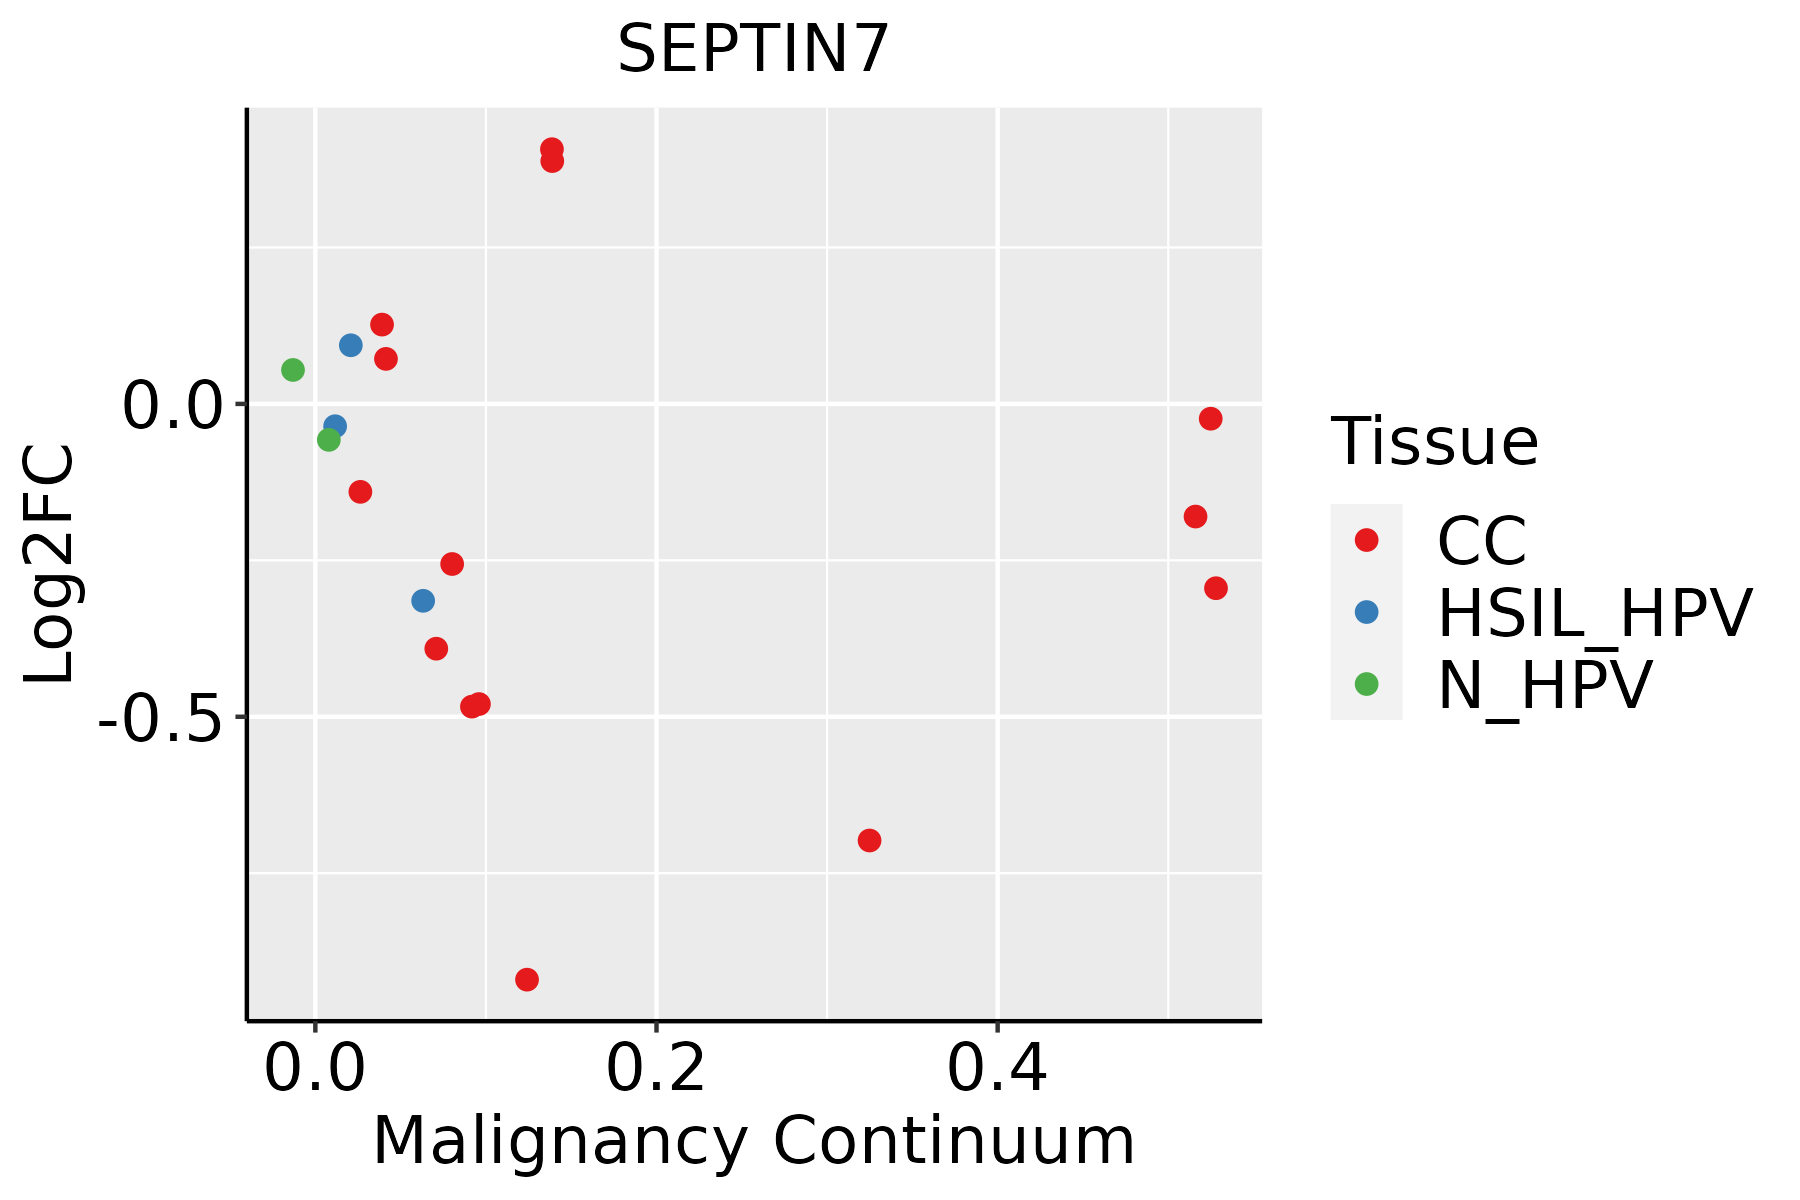 | CC: Cervix cancer |
| HSIL_HPV: HPV-infected high-grade squamous intraepithelial lesions | ||
| N_HPV: HPV-infected normal cervix | ||
| Colorectum (GSE201348) |  | FAP: Familial adenomatous polyposis |
| CRC: Colorectal cancer | ||
| Colorectum (HTA11) |  | AD: Adenomas |
| SER: Sessile serrated lesions | ||
| MSI-H: Microsatellite-high colorectal cancer | ||
| MSS: Microsatellite stable colorectal cancer | ||
| Endometrium | 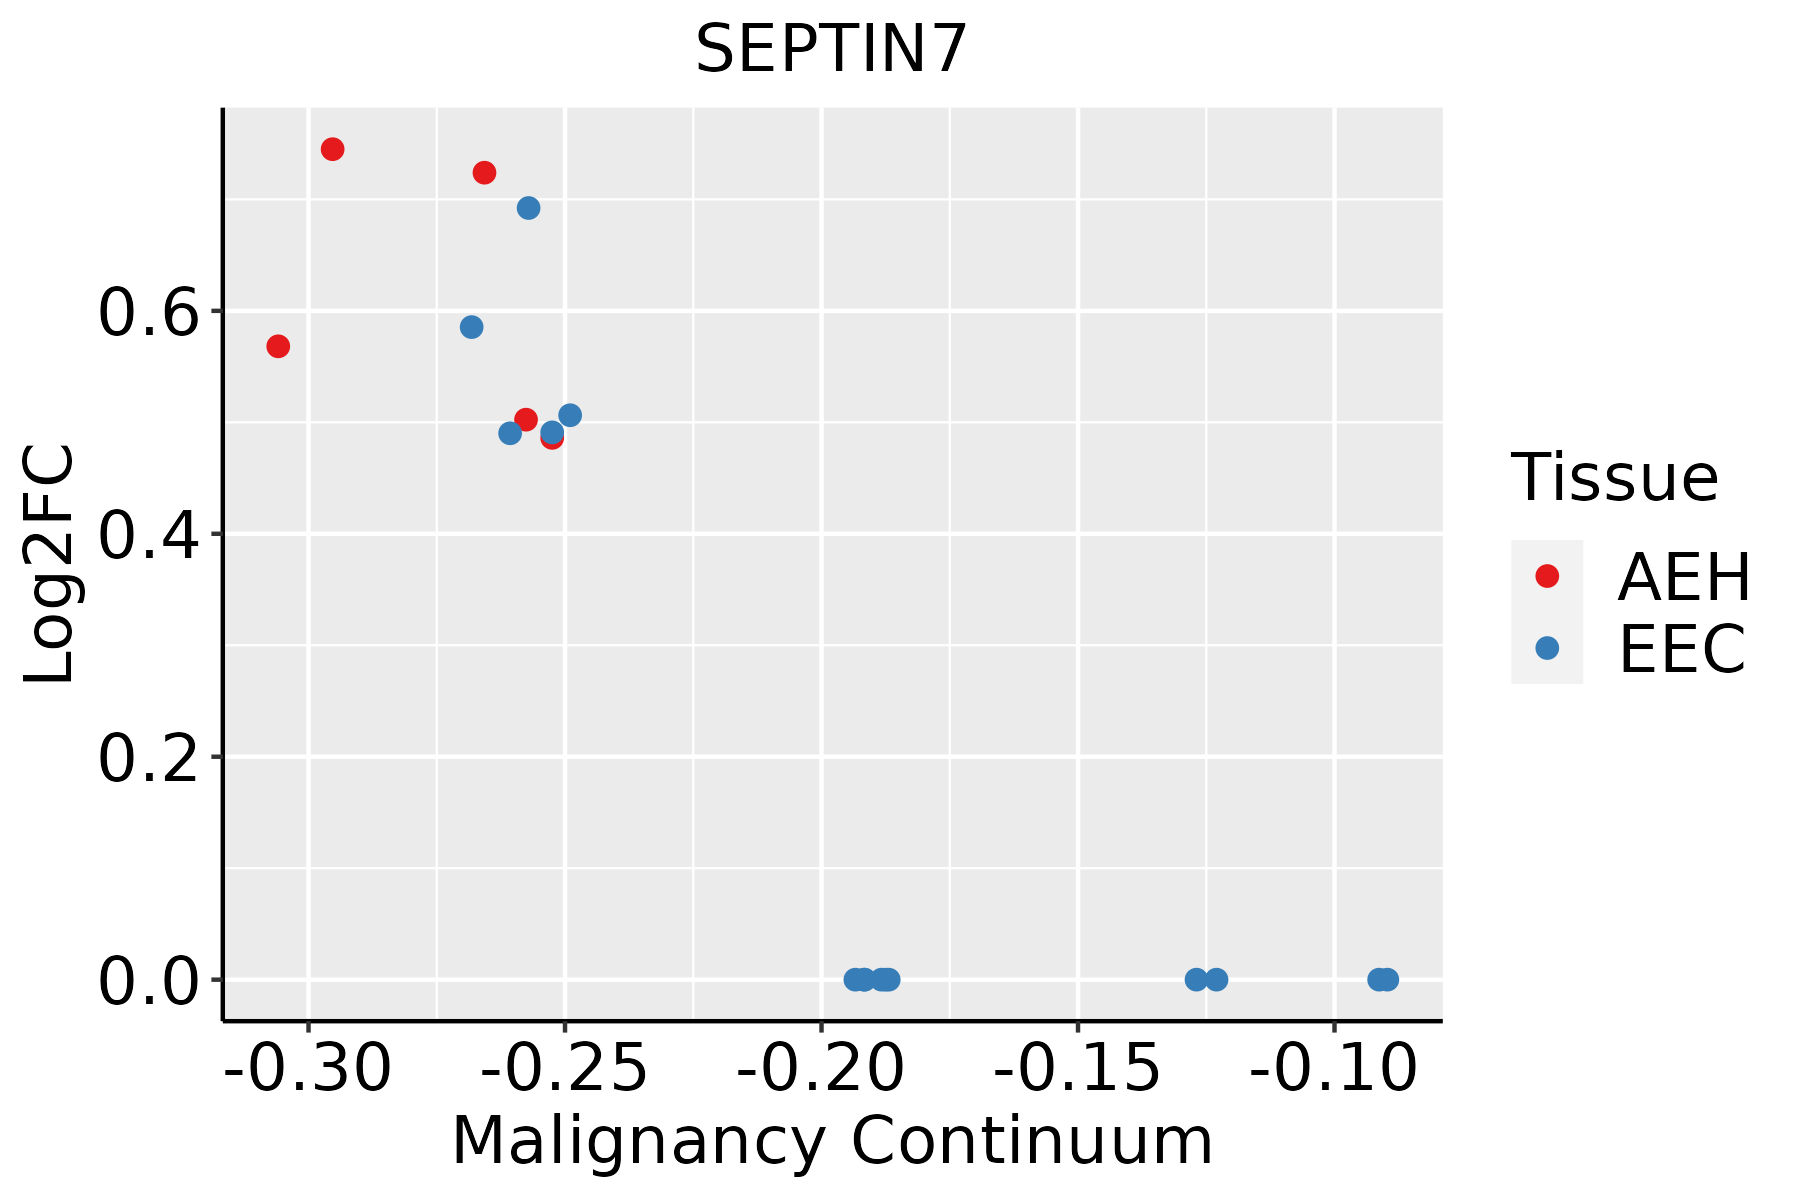 | AEH: Atypical endometrial hyperplasia |
| EEC: Endometrioid Cancer | ||
| Esophagus | 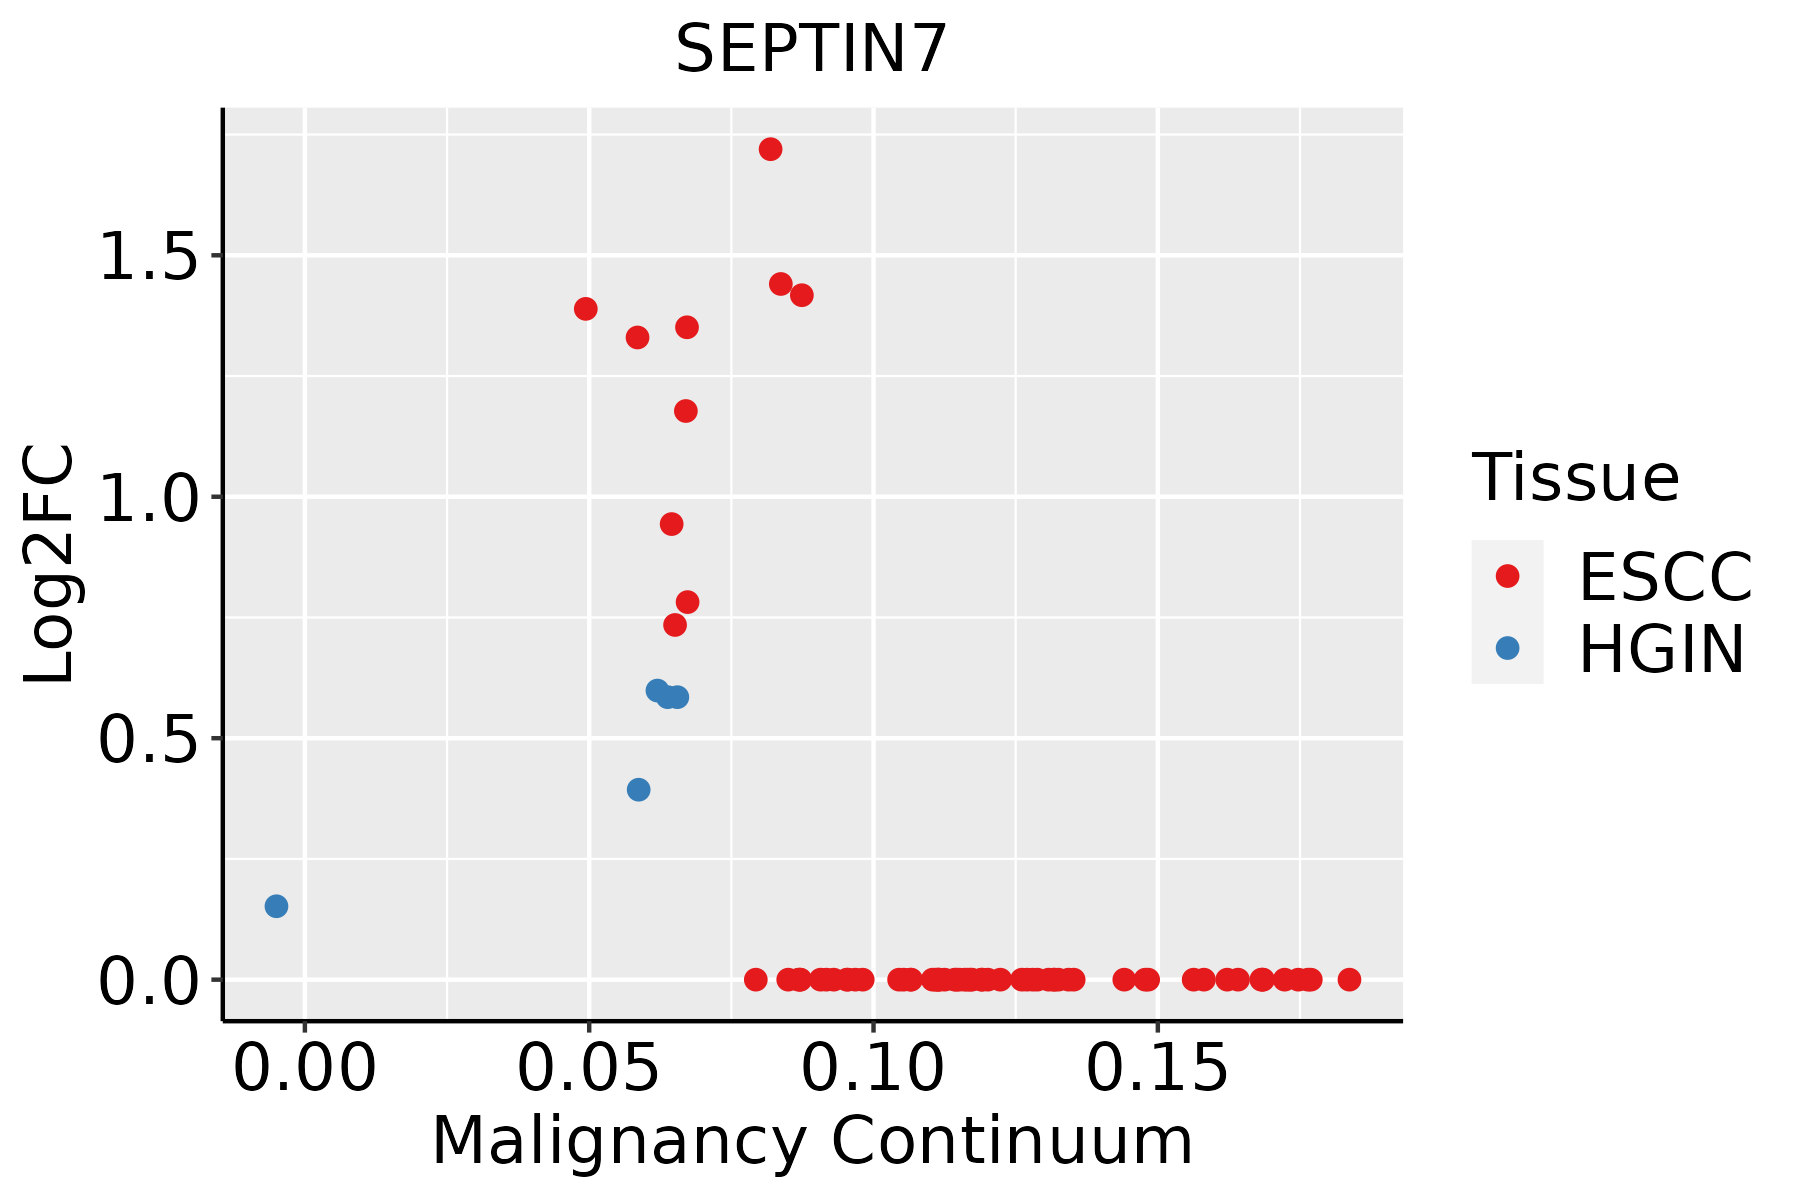 | ESCC: Esophageal squamous cell carcinoma |
| HGIN: High-grade intraepithelial neoplasias | ||
| LGIN: Low-grade intraepithelial neoplasias | ||
| GC |  | CAG: Chronic atrophic gastritis |
| CAG with IM: Chronic atrophic gastritis with intestinal metaplasia | ||
| CSG: Chronic superficial gastritis | ||
| GC: Gastric cancer | ||
| SIM: Severe intestinal metaplasia | ||
| WIM: Wild intestinal metaplasia | ||
| Lung | 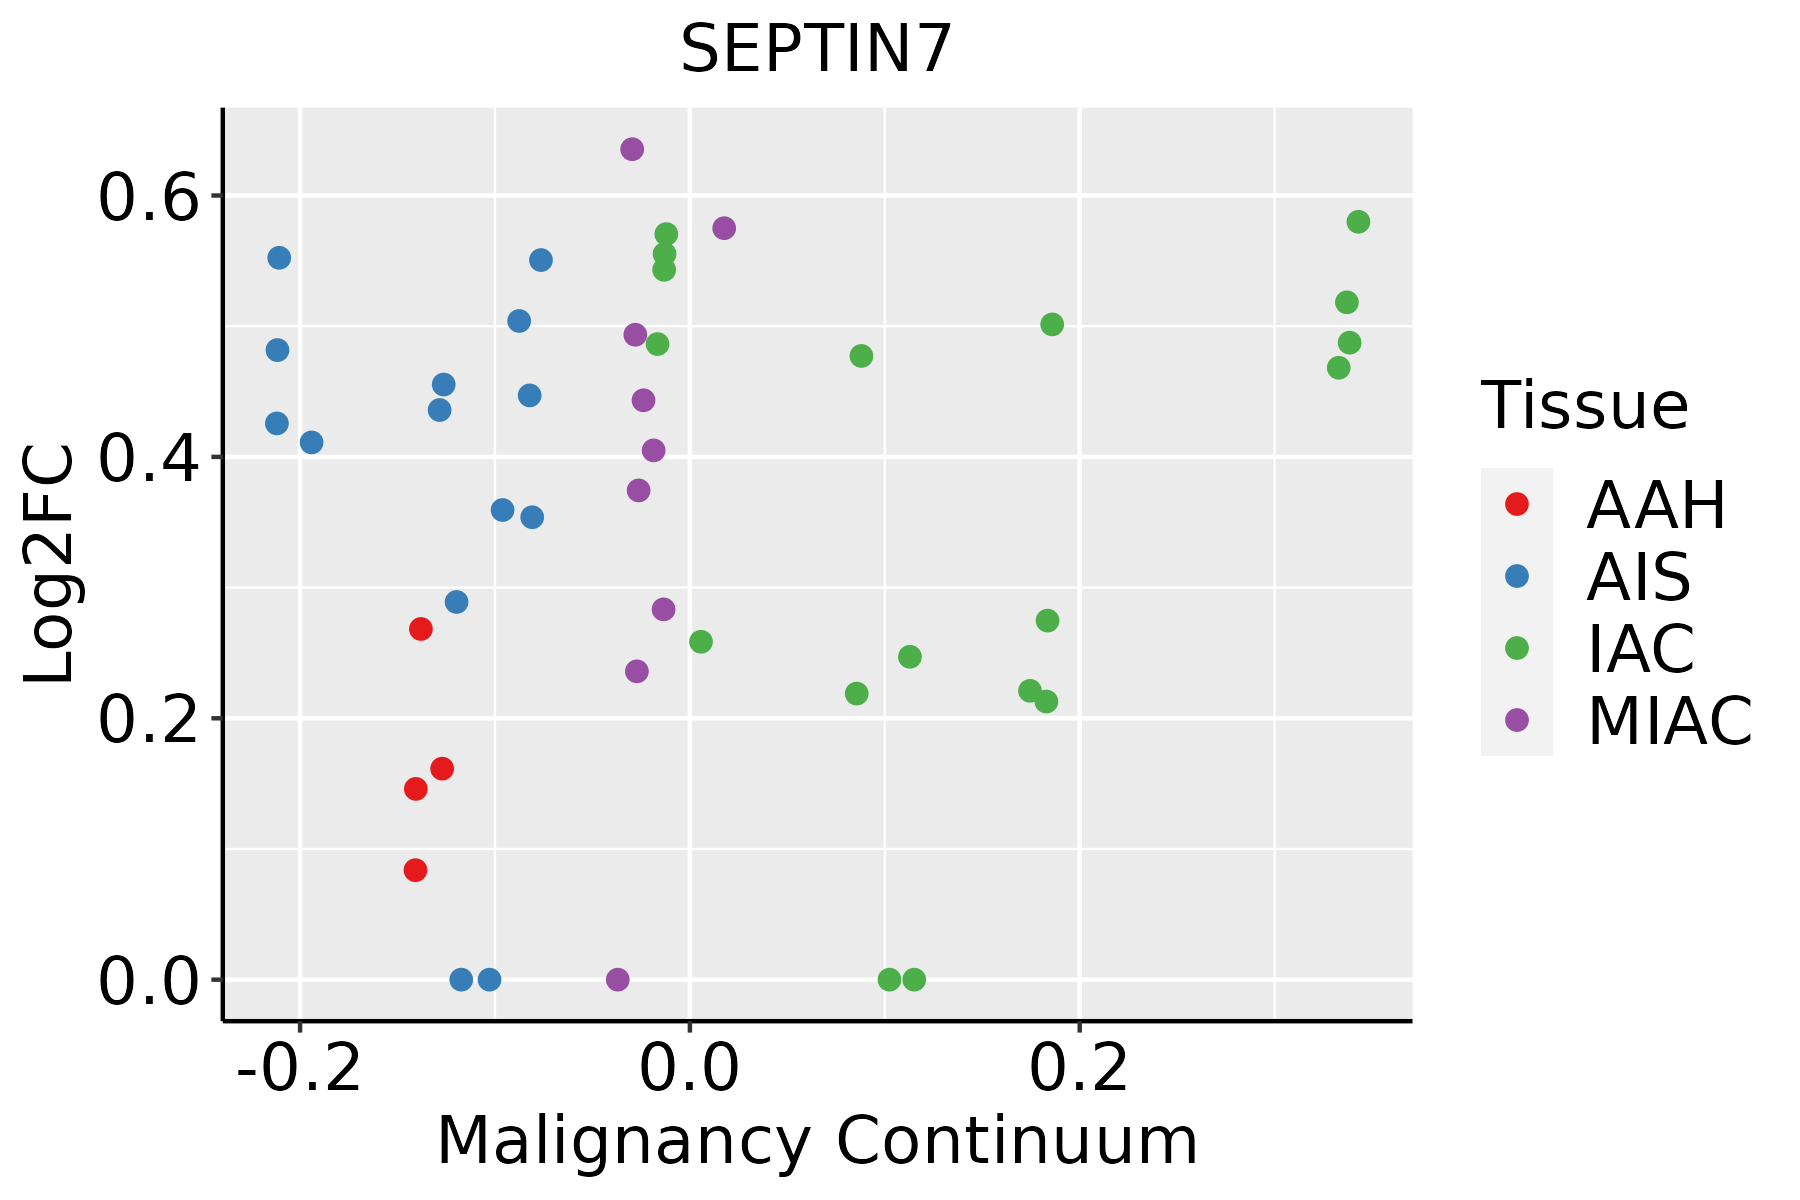 | AAH: Atypical adenomatous hyperplasia |
| AIS: Adenocarcinoma in situ | ||
| IAC: Invasive lung adenocarcinoma | ||
| MIA: Minimally invasive adenocarcinoma | ||
| Oral Cavity | 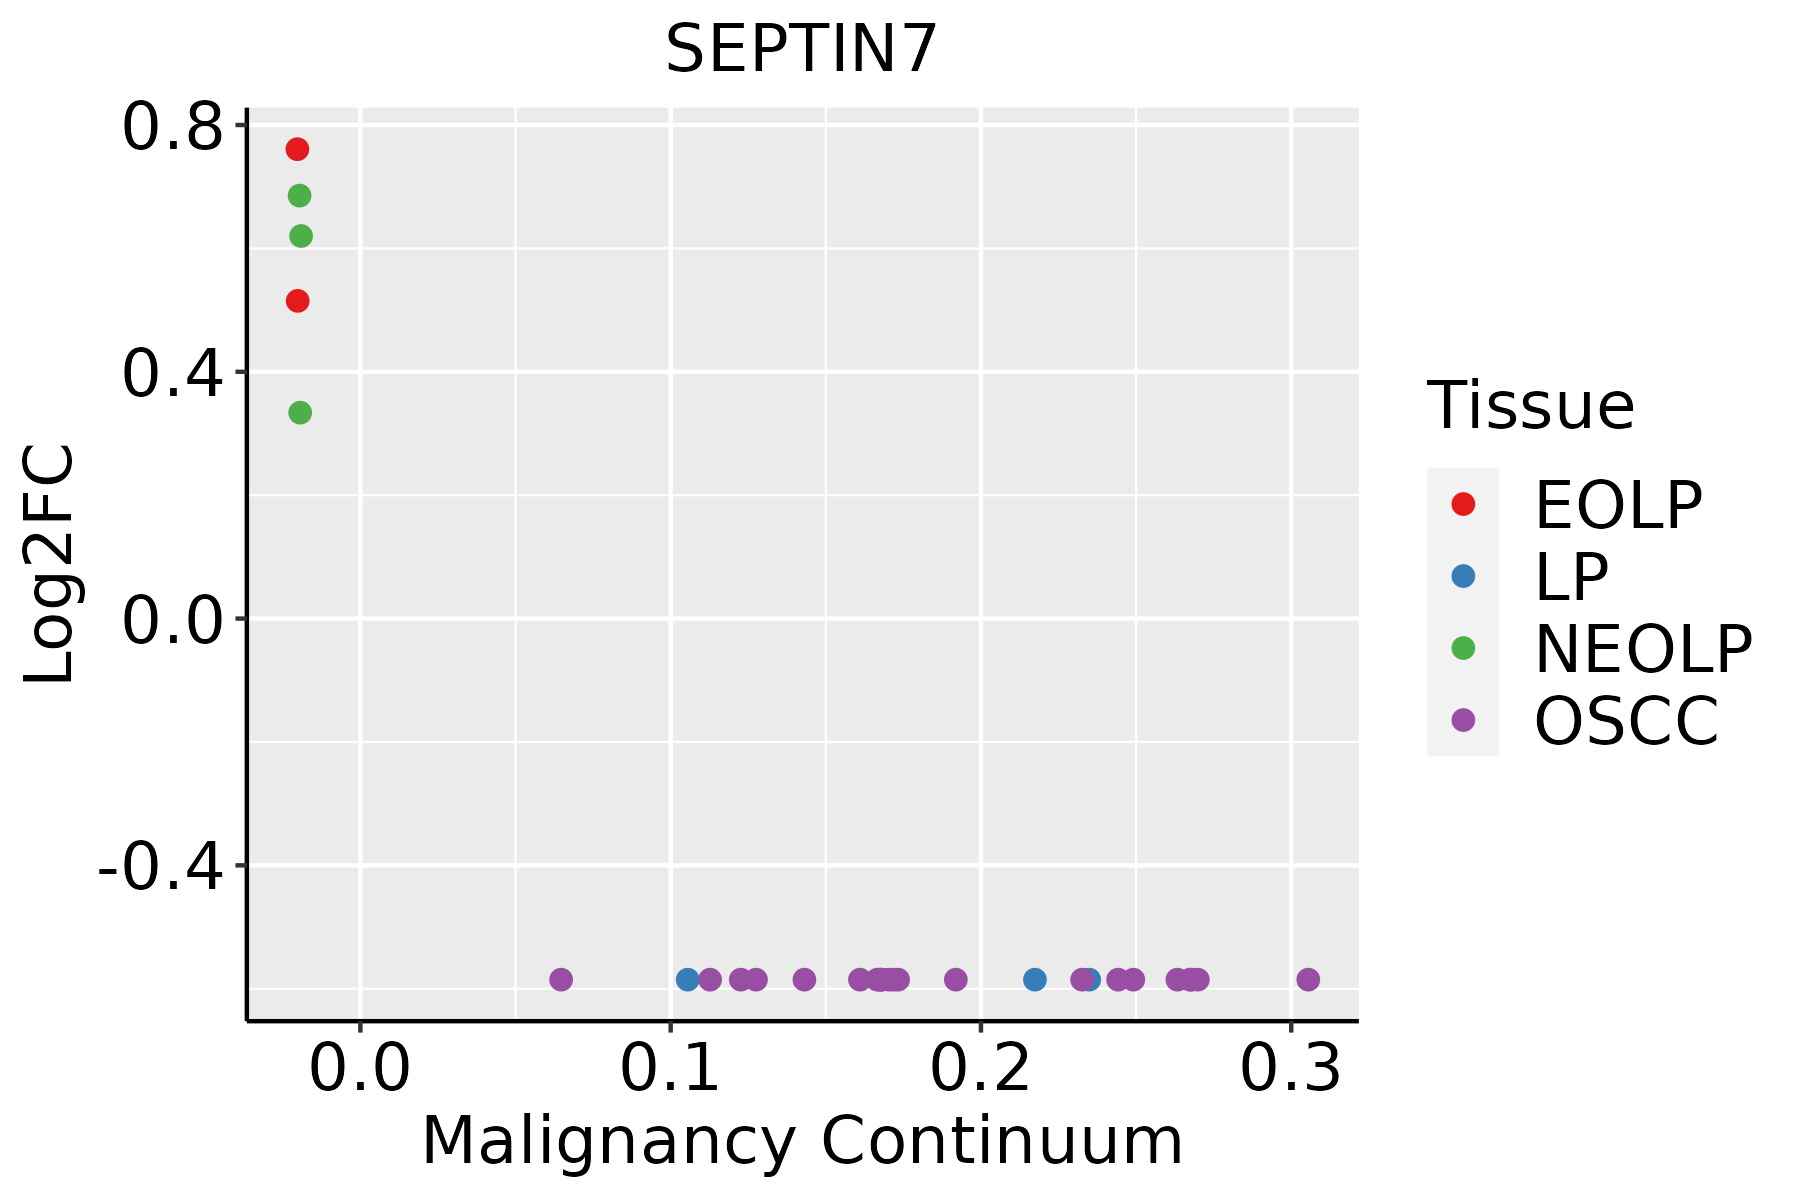 | EOLP: Erosive Oral lichen planus |
| LP: leukoplakia | ||
| NEOLP: Non-erosive oral lichen planus | ||
| OSCC: Oral squamous cell carcinoma | ||
| Prostate |  | BPH: Benign Prostatic Hyperplasia |
| Skin |  | AK: Actinic keratosis |
| cSCC: Cutaneous squamous cell carcinoma | ||
| SCCIS:squamous cell carcinoma in situ |
| ∗log2FC in expression of this searched gene in stem-like cells from each diseased tissue sample relative to stem-like cells in normal samples in each tissue plotted against the malignancy continuum. Samples are colored based on if they are from different disease stage. |
Top |
Malignant transformation related pathway analysis |
| Find out the enriched GO biological processes and KEGG pathways involved in transition from healthy to precancer to cancer |
| Tissue | Disease Stage | Enriched GO biological Processes |
| Colorectum | AD |  |
| Colorectum | SER |  |
| Colorectum | MSS |  |
| Colorectum | MSI-H |  |
| Colorectum | FAP |  |
| ∗Top 15 enriched GO BP terms are showed in the bar plot of each disease state in each tissue. Each row represents a significant GO biological process which is colored according to the -log10(p.adjust). |
| Page: 1 2 3 4 5 6 7 8 9 |
| GO ID | Tissue | Disease Stage | Description | Gene Ratio | Bg Ratio | pvalue | p.adjust | Count |
| GO:002260410 | Cervix | CC | regulation of cell morphogenesis | 84/2311 | 309/18723 | 1.00e-12 | 4.29e-10 | 84 |
| GO:00313467 | Cervix | CC | positive regulation of cell projection organization | 72/2311 | 353/18723 | 1.04e-05 | 2.32e-04 | 72 |
| GO:00083608 | Cervix | CC | regulation of cell shape | 38/2311 | 154/18723 | 1.86e-05 | 3.46e-04 | 38 |
| GO:00459955 | Cervix | CC | regulation of embryonic development | 19/2311 | 64/18723 | 1.78e-04 | 2.09e-03 | 19 |
| GO:19021153 | Cervix | CC | regulation of organelle assembly | 40/2311 | 186/18723 | 2.92e-04 | 3.15e-03 | 40 |
| GO:19021171 | Cervix | CC | positive regulation of organelle assembly | 19/2311 | 67/18723 | 3.42e-04 | 3.58e-03 | 19 |
| GO:00009107 | Cervix | CC | cytokinesis | 37/2311 | 173/18723 | 5.40e-04 | 5.23e-03 | 37 |
| GO:01200328 | Cervix | CC | regulation of plasma membrane bounded cell projection assembly | 38/2311 | 186/18723 | 1.14e-03 | 9.35e-03 | 38 |
| GO:00604917 | Cervix | CC | regulation of cell projection assembly | 38/2311 | 188/18723 | 1.40e-03 | 1.10e-02 | 38 |
| GO:0022604 | Colorectum | AD | regulation of cell morphogenesis | 109/3918 | 309/18723 | 3.08e-09 | 2.07e-07 | 109 |
| GO:0008360 | Colorectum | AD | regulation of cell shape | 56/3918 | 154/18723 | 7.01e-06 | 1.73e-04 | 56 |
| GO:0000910 | Colorectum | AD | cytokinesis | 59/3918 | 173/18723 | 3.74e-05 | 6.75e-04 | 59 |
| GO:0031346 | Colorectum | AD | positive regulation of cell projection organization | 104/3918 | 353/18723 | 8.26e-05 | 1.30e-03 | 104 |
| GO:0061640 | Colorectum | AD | cytoskeleton-dependent cytokinesis | 37/3918 | 100/18723 | 1.58e-04 | 2.20e-03 | 37 |
| GO:0045995 | Colorectum | AD | regulation of embryonic development | 24/3918 | 64/18723 | 1.72e-03 | 1.43e-02 | 24 |
| GO:0120034 | Colorectum | AD | positive regulation of plasma membrane bounded cell projection assembly | 33/3918 | 105/18723 | 7.49e-03 | 4.55e-02 | 33 |
| GO:0120032 | Colorectum | AD | regulation of plasma membrane bounded cell projection assembly | 53/3918 | 186/18723 | 8.51e-03 | 4.97e-02 | 53 |
| GO:00226041 | Colorectum | SER | regulation of cell morphogenesis | 89/2897 | 309/18723 | 1.51e-09 | 1.52e-07 | 89 |
| GO:00083601 | Colorectum | SER | regulation of cell shape | 43/2897 | 154/18723 | 5.47e-05 | 1.30e-03 | 43 |
| GO:00009101 | Colorectum | SER | cytokinesis | 45/2897 | 173/18723 | 2.28e-04 | 3.93e-03 | 45 |
| Page: 1 2 3 4 5 6 7 8 9 |
| Pathway ID | Tissue | Disease Stage | Description | Gene Ratio | Bg Ratio | pvalue | p.adjust | qvalue | Count |
| hsa0513120 | Cervix | CC | Shigellosis | 69/1267 | 247/8465 | 7.64e-08 | 1.03e-06 | 6.10e-07 | 69 |
| hsa05131110 | Cervix | CC | Shigellosis | 69/1267 | 247/8465 | 7.64e-08 | 1.03e-06 | 6.10e-07 | 69 |
| hsa05131 | Colorectum | AD | Shigellosis | 109/2092 | 247/8465 | 1.09e-11 | 2.44e-10 | 1.55e-10 | 109 |
| hsa051311 | Colorectum | AD | Shigellosis | 109/2092 | 247/8465 | 1.09e-11 | 2.44e-10 | 1.55e-10 | 109 |
| hsa051312 | Colorectum | SER | Shigellosis | 87/1580 | 247/8465 | 3.07e-10 | 7.27e-09 | 5.28e-09 | 87 |
| hsa051313 | Colorectum | SER | Shigellosis | 87/1580 | 247/8465 | 3.07e-10 | 7.27e-09 | 5.28e-09 | 87 |
| hsa0513126 | Endometrium | AEH | Shigellosis | 78/1197 | 247/8465 | 9.23e-13 | 2.00e-11 | 1.46e-11 | 78 |
| hsa05131111 | Endometrium | AEH | Shigellosis | 78/1197 | 247/8465 | 9.23e-13 | 2.00e-11 | 1.46e-11 | 78 |
| hsa0513127 | Endometrium | EEC | Shigellosis | 79/1237 | 247/8465 | 1.80e-12 | 3.95e-11 | 2.95e-11 | 79 |
| hsa0513136 | Endometrium | EEC | Shigellosis | 79/1237 | 247/8465 | 1.80e-12 | 3.95e-11 | 2.95e-11 | 79 |
| hsa0513139 | Esophagus | HGIN | Shigellosis | 71/1383 | 247/8465 | 4.89e-07 | 7.98e-06 | 6.34e-06 | 71 |
| hsa05131114 | Esophagus | HGIN | Shigellosis | 71/1383 | 247/8465 | 4.89e-07 | 7.98e-06 | 6.34e-06 | 71 |
| hsa05131211 | Esophagus | ESCC | Shigellosis | 176/4205 | 247/8465 | 2.27e-12 | 4.01e-11 | 2.05e-11 | 176 |
| hsa05131310 | Esophagus | ESCC | Shigellosis | 176/4205 | 247/8465 | 2.27e-12 | 4.01e-11 | 2.05e-11 | 176 |
| hsa0513116 | Lung | IAC | Shigellosis | 58/1053 | 247/8465 | 8.21e-07 | 3.81e-05 | 2.53e-05 | 58 |
| hsa0513117 | Lung | IAC | Shigellosis | 58/1053 | 247/8465 | 8.21e-07 | 3.81e-05 | 2.53e-05 | 58 |
| hsa0513123 | Lung | AIS | Shigellosis | 53/961 | 247/8465 | 2.70e-06 | 9.71e-05 | 6.21e-05 | 53 |
| hsa0513133 | Lung | AIS | Shigellosis | 53/961 | 247/8465 | 2.70e-06 | 9.71e-05 | 6.21e-05 | 53 |
| hsa0513143 | Lung | MIAC | Shigellosis | 29/507 | 247/8465 | 3.64e-04 | 7.06e-03 | 5.11e-03 | 29 |
| hsa0513153 | Lung | MIAC | Shigellosis | 29/507 | 247/8465 | 3.64e-04 | 7.06e-03 | 5.11e-03 | 29 |
| Page: 1 2 |
Top |
Cell-cell communication analysis |
| Identification of potential cell-cell interactions between two cell types and their ligand-receptor pairs for different disease states |
| Ligand | Receptor | LRpair | Pathway | Tissue | Disease Stage |
| Page: 1 |
Top |
Single-cell gene regulatory network inference analysis |
| Find out the significant the regulons (TFs) and the target genes of each regulon across cell types for different disease states |
| TF | Cell Type | Tissue | Disease Stage | Target Gene | RSS | Regulon Activity |
| ∗The dot plots of a searched regulon are shown for all cell subpopulations in each disease state of each tissue based on the regulon specific score inferred using pySCENIC and by calculating the average expression. |
| Page: 1 |
Top |
Somatic mutation of malignant transformation related genes |
| Annotation of somatic variants for genes involved in malignant transformation |
| Hugo Symbol | Variant Class | Variant Classification | dbSNP RS | HGVSc | HGVSp | HGVSp Short | SWISSPROT | BIOTYPE | SIFT | PolyPhen | Tumor Sample Barcode | Tissue | Histology | Sex | Age | Stage | Therapy Types | Drugs | Outcome |
| Page: 1 |
Top |
Related drugs of malignant transformation related genes |
| Identification of chemicals and drugs interact with genes involved in malignant transfromation |
| (DGIdb 4.0) |
| Entrez ID | Symbol | Category | Interaction Types | Drug Claim Name | Drug Name | PMIDs |
| Page: 1 |

Copyright 2023-Present -The University of Texas Health Science Center at Houston |