Schematic overview of the cellular and molecular mechanisms involved in the cancer progression, including the proposed cellular and molecular mechanisms in cancer cells trajectory. AT1: alveolar type 1 cells; AT2: alveolar type 2 cells; AAH: atypical adenomatous hyperplasia; AIS: adenocarcinoma in situ; MIA: minimally invasive adenocarcinoma; IA: invasive adenocarcinoma; EMT: epithelial-mesenchymal transition

Home

Download

Statistics

Help

Contact

Center for Computational Systems Medicine
leaf

Gene summary

leaf

Malignant transformation analysis

leaf

Malignant transformation related pathway analysis

leaf

Cell-cell communication analysis

leaf

Single-cell gene regulatory network inference analysis

leaf

Somatic mutation of malignant transformation related genes

leaf

Related drugs of malignant transformation related genes

Gene: SEPT9

Gene summary for SEPT9

check button Gene summary.

Gene informationSpeciesHuman
Gene symbol

SEPT9

Gene ID

10801

Gene nameseptin 9
Gene AliasAF17q25
Cytomap17q25.3
Gene Typeprotein-coding
GO ID

GO:0000910

UniProtAcc

Q9UHD8


Top

Malignant transformation analysis

check button Identification of the aberrant gene expression in precancerous and cancerous lesions by comparing the gene expression of stem-like cells in diseased tissues with normal stem cells
check button Malignant transformation involving gene list.
Entrez IDSymbolReplicatesSpeciesOrganTissueAdj P-valueLog2FCMalignancy
10801SEPT9HTA11_3410_2000001011HumanColorectumAD2.16e-35-7.61e-010.0155
10801SEPT9HTA11_2487_2000001011HumanColorectumSER1.46e-21-7.61e-01-0.1808
10801SEPT9HTA11_2951_2000001011HumanColorectumAD2.88e-05-7.61e-010.0216
10801SEPT9HTA11_1938_2000001011HumanColorectumAD1.22e-16-7.61e-01-0.0811
10801SEPT9HTA11_78_2000001011HumanColorectumAD3.70e-25-7.61e-01-0.1088
10801SEPT9HTA11_347_2000001011HumanColorectumAD7.28e-38-7.61e-01-0.1954
10801SEPT9HTA11_411_2000001011HumanColorectumSER4.06e-03-7.61e-01-0.2602
10801SEPT9HTA11_2112_2000001011HumanColorectumSER1.69e-04-7.61e-01-0.2196
10801SEPT9HTA11_3361_2000001011HumanColorectumAD3.03e-17-7.61e-01-0.1207
10801SEPT9HTA11_83_2000001011HumanColorectumSER5.44e-14-7.61e-01-0.1526
10801SEPT9HTA11_696_2000001011HumanColorectumAD4.12e-43-7.61e-01-0.1464
10801SEPT9HTA11_866_2000001011HumanColorectumAD7.40e-36-7.61e-01-0.1001
10801SEPT9HTA11_1391_2000001011HumanColorectumAD5.34e-29-7.61e-01-0.059
10801SEPT9HTA11_2992_2000001011HumanColorectumSER9.01e-07-7.61e-01-0.1706
10801SEPT9HTA11_5212_2000001011HumanColorectumAD7.19e-08-7.61e-01-0.2061
10801SEPT9HTA11_5216_2000001011HumanColorectumSER2.88e-05-7.61e-01-0.1462
10801SEPT9HTA11_546_2000001011HumanColorectumAD3.37e-12-7.61e-01-0.0842
10801SEPT9HTA11_9341_2000001011HumanColorectumSER4.06e-03-7.61e-01-0.00410000000000005
10801SEPT9HTA11_7862_2000001011HumanColorectumAD5.39e-10-7.61e-01-0.0179
10801SEPT9HTA11_866_3004761011HumanColorectumAD1.90e-31-7.61e-010.096
Page: 1 2 3 4 5 6 7 8 9 10 11 

check button Transcriptomic changes along malignancy continuum.
TissueExpression DynamicsAbbreviation
Colorectum (GSE201348)The image shows the transcriptomic changes along malignancy continuum.log2FC in expression of this searched gene in stem-like cells from each diseased tissue sample relative to stem-like cells in normal samples in each tissue plotted against the malignancy continuum. Samples are colored based on if they are from different disease stage.FAP: Familial adenomatous polyposis
CRC: Colorectal cancer
Colorectum (HTA11)The image shows the transcriptomic changes along malignancy continuum.log2FC in expression of this searched gene in stem-like cells from each diseased tissue sample relative to stem-like cells in normal samples in each tissue plotted against the malignancy continuum. Samples are colored based on if they are from different disease stage.AD: Adenomas
SER: Sessile serrated lesions
MSI-H: Microsatellite-high colorectal cancer
MSS: Microsatellite stable colorectal cancer
EsophagusThe image shows the transcriptomic changes along malignancy continuum.log2FC in expression of this searched gene in stem-like cells from each diseased tissue sample relative to stem-like cells in normal samples in each tissue plotted against the malignancy continuum. Samples are colored based on if they are from different disease stage.
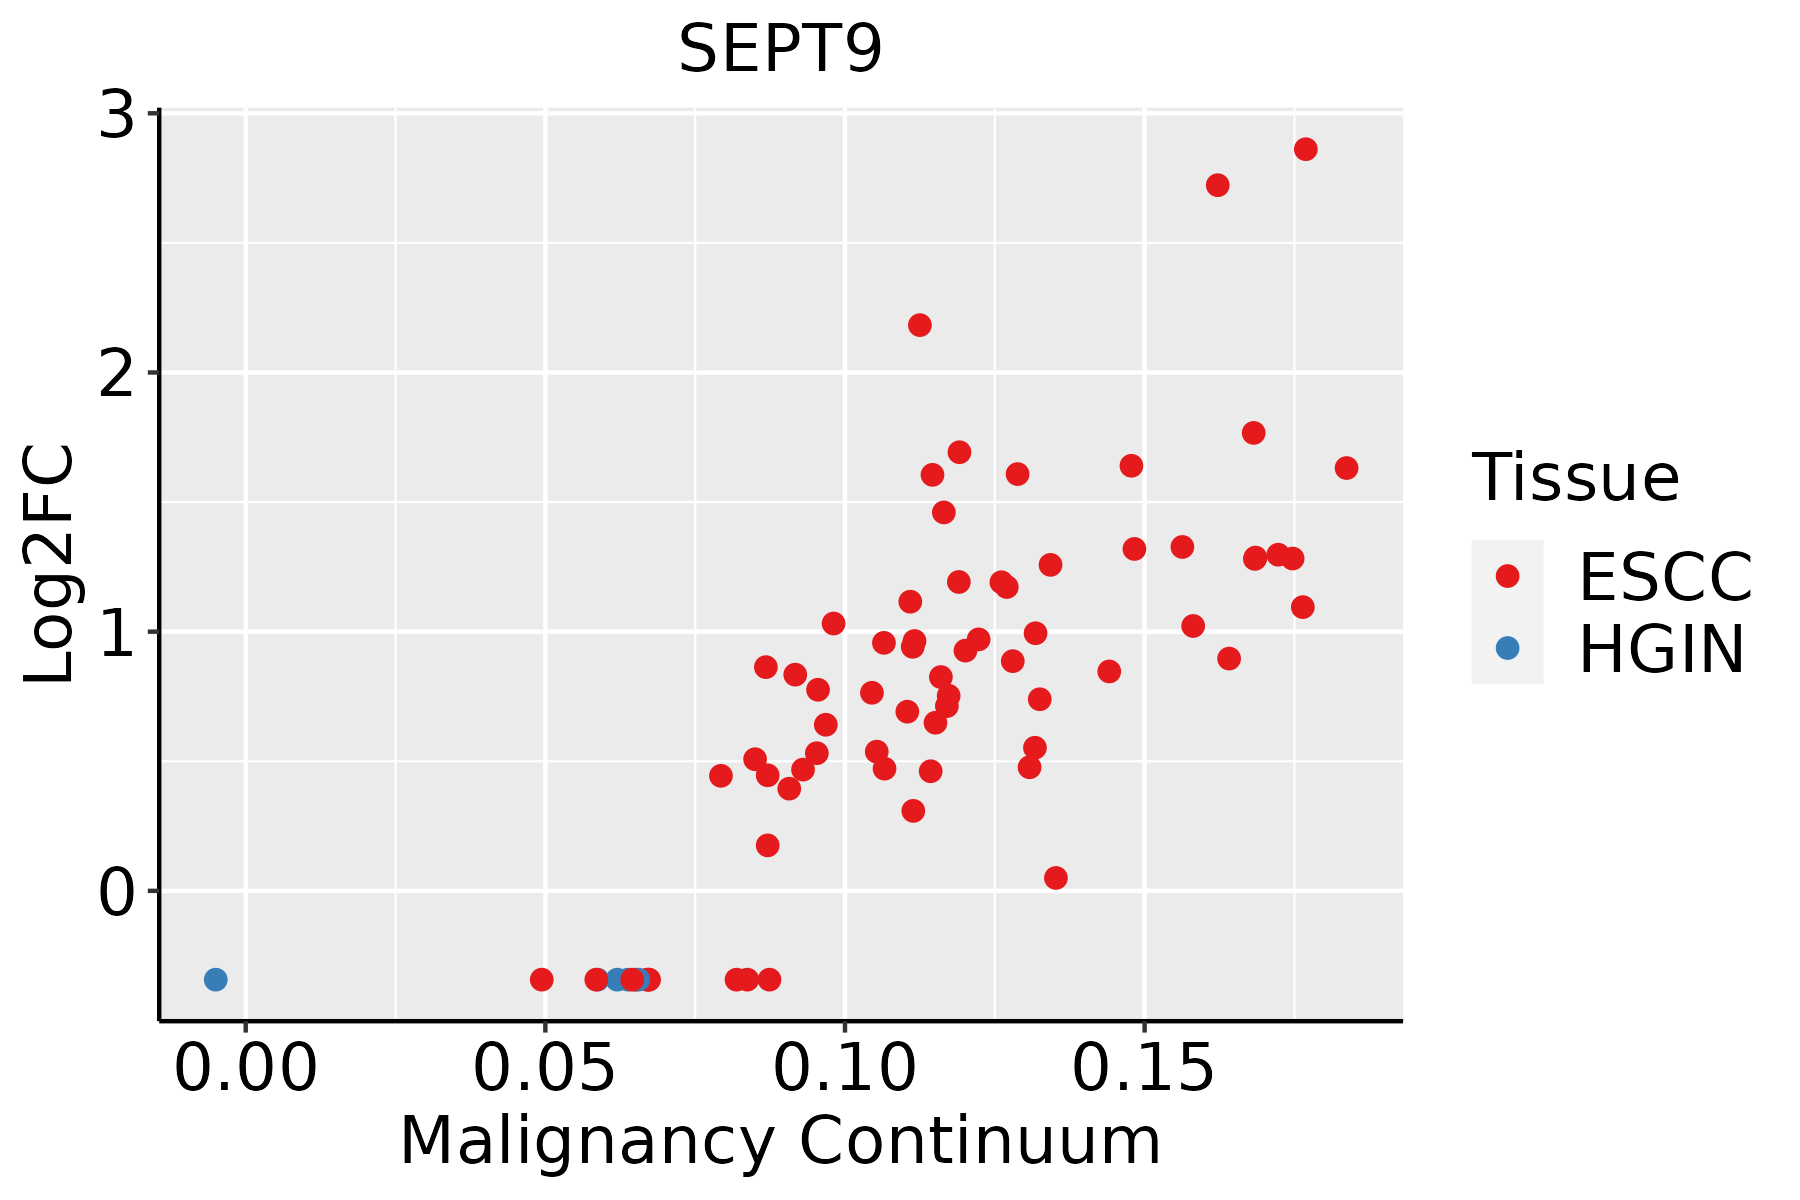
ESCC: Esophageal squamous cell carcinoma
HGIN: High-grade intraepithelial neoplasias
LGIN: Low-grade intraepithelial neoplasias
LiverThe image shows the transcriptomic changes along malignancy continuum.log2FC in expression of this searched gene in stem-like cells from each diseased tissue sample relative to stem-like cells in normal samples in each tissue plotted against the malignancy continuum. Samples are colored based on if they are from different disease stage.HCC: Hepatocellular carcinoma
NAFLD: Non-alcoholic fatty liver disease
Oral CavityThe image shows the transcriptomic changes along malignancy continuum.log2FC in expression of this searched gene in stem-like cells from each diseased tissue sample relative to stem-like cells in normal samples in each tissue plotted against the malignancy continuum. Samples are colored based on if they are from different disease stage.
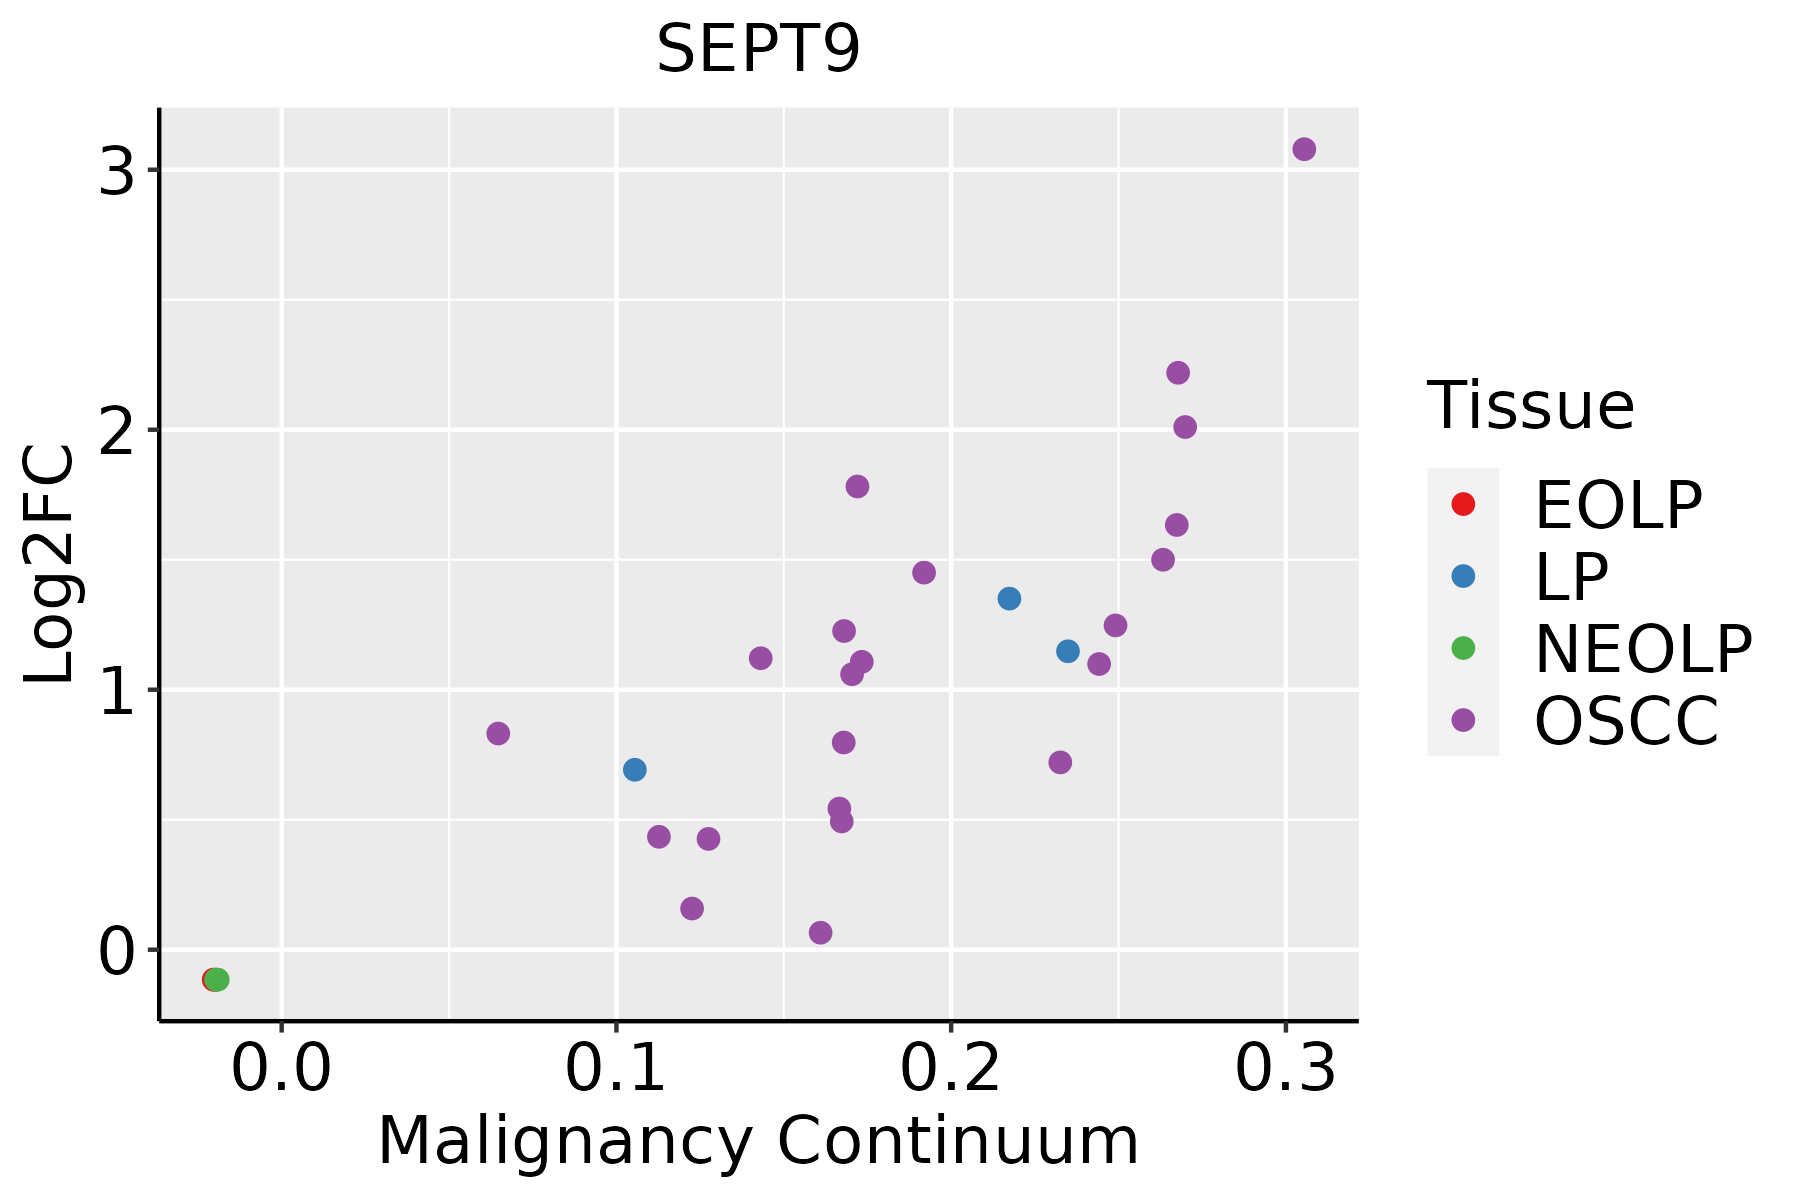
EOLP: Erosive Oral lichen planus
LP: leukoplakia
NEOLP: Non-erosive oral lichen planus
OSCC: Oral squamous cell carcinoma
ProstateThe image shows the transcriptomic changes along malignancy continuum.log2FC in expression of this searched gene in stem-like cells from each diseased tissue sample relative to stem-like cells in normal samples in each tissue plotted against the malignancy continuum. Samples are colored based on if they are from different disease stage.
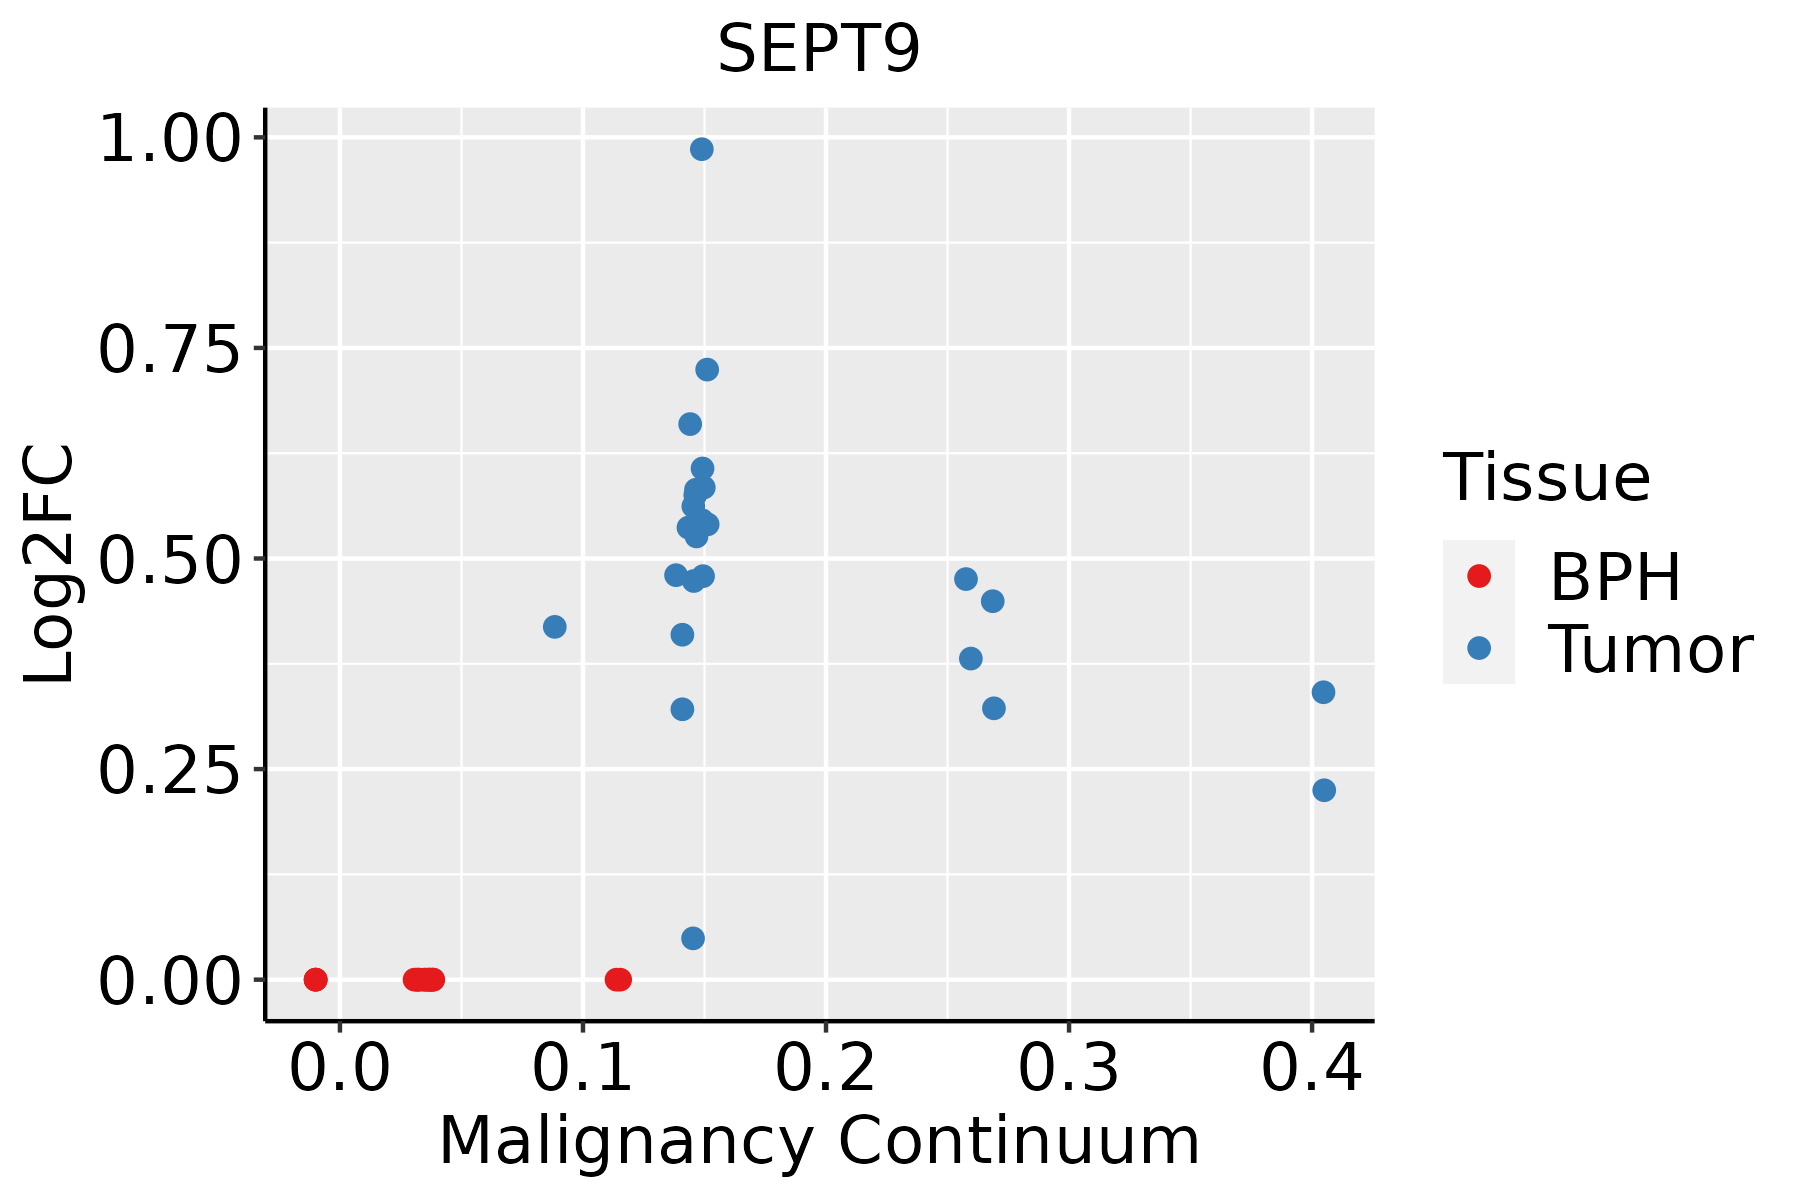
BPH: Benign Prostatic Hyperplasia
SkinThe image shows the transcriptomic changes along malignancy continuum.log2FC in expression of this searched gene in stem-like cells from each diseased tissue sample relative to stem-like cells in normal samples in each tissue plotted against the malignancy continuum. Samples are colored based on if they are from different disease stage.
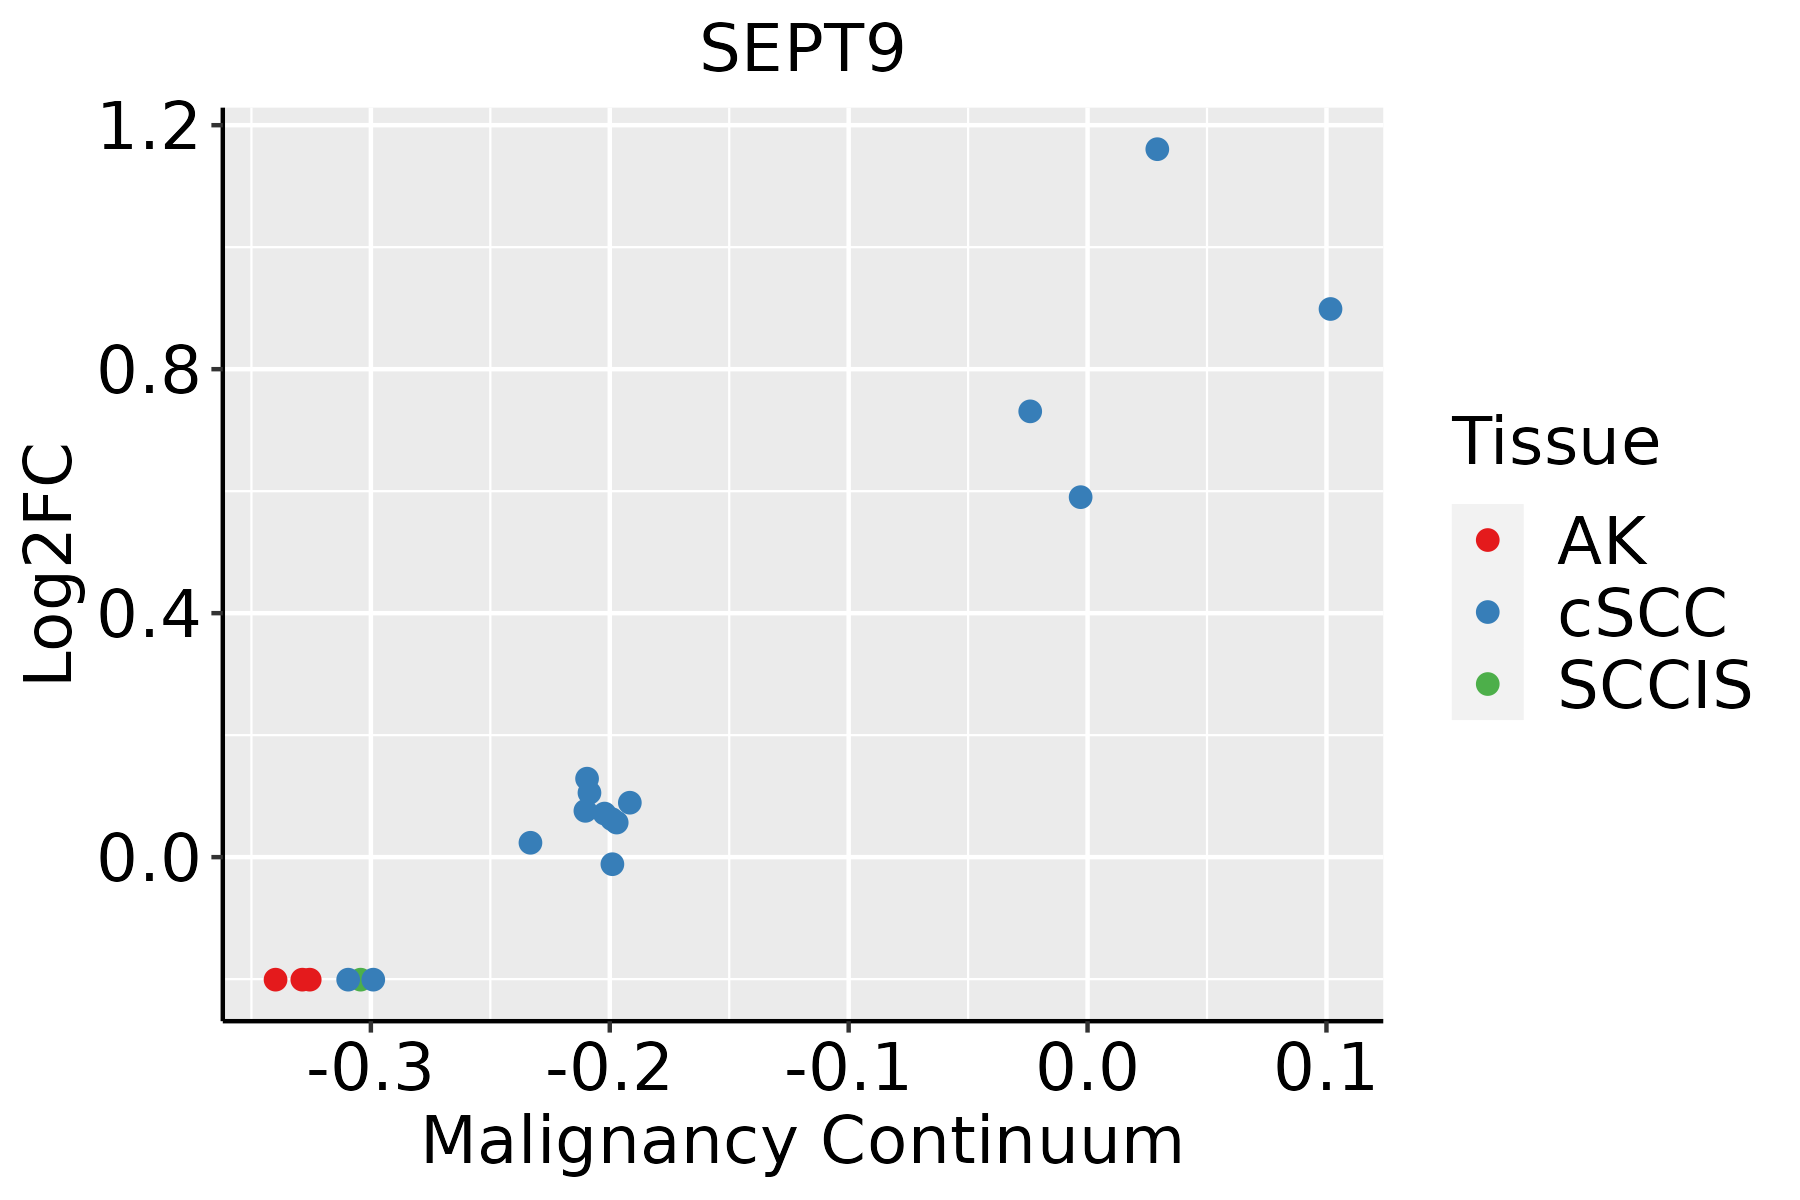
AK: Actinic keratosis
cSCC: Cutaneous squamous cell carcinoma
SCCIS:squamous cell carcinoma in situ
ThyroidThe image shows the transcriptomic changes along malignancy continuum.log2FC in expression of this searched gene in stem-like cells from each diseased tissue sample relative to stem-like cells in normal samples in each tissue plotted against the malignancy continuum. Samples are colored based on if they are from different disease stage.ATC: Anaplastic thyroid cancer
HT: Hashimoto's thyroiditis
PTC: Papillary thyroid cancer
∗log2FC in expression of this searched gene in stem-like cells from each diseased tissue sample relative to stem-like cells in normal samples in each tissue plotted against the malignancy continuum. Samples are colored based on if they are from different disease stage.

Top

Malignant transformation related pathway analysis

check buttonFind out the enriched GO biological processes and KEGG pathways involved in transition from healthy to precancer to cancer
check button Figure of enriched GO biological processes.
TissueDisease StageEnriched GO biological Processes
ColorectumADGO analysis - Figure of enriched GO biological processes: Top 15 enriched GO BP terms are showed in the bar plot of each disease state in each tissue. Each row represents a significant GO biological process which is colored according to the -log10(p.adjust).
ColorectumSERGO analysis - Figure of enriched GO biological processes: Top 15 enriched GO BP terms are showed in the bar plot of each disease state in each tissue. Each row represents a significant GO biological process which is colored according to the -log10(p.adjust).
ColorectumMSSGO analysis - Figure of enriched GO biological processes: Top 15 enriched GO BP terms are showed in the bar plot of each disease state in each tissue. Each row represents a significant GO biological process which is colored according to the -log10(p.adjust).
ColorectumMSI-HGO analysis - Figure of enriched GO biological processes: Top 15 enriched GO BP terms are showed in the bar plot of each disease state in each tissue. Each row represents a significant GO biological process which is colored according to the -log10(p.adjust).
ColorectumFAPGO analysis - Figure of enriched GO biological processes: Top 15 enriched GO BP terms are showed in the bar plot of each disease state in each tissue. Each row represents a significant GO biological process which is colored according to the -log10(p.adjust).
∗Top 15 enriched GO BP terms are showed in the bar plot of each disease state in each tissue. Each row represents a significant GO biological process which is colored according to the -log10(p.adjust).
Page: 1 2 3 4 5 6 7 8 9 

check button Enriched GO biological processes.
GO IDTissueDisease StageDescriptionGene RatioBg Ratiopvaluep.adjustCount
Page: 1 

check button Enriched KEGG pathways.
Pathway IDTissueDisease StageDescriptionGene RatioBg Ratiopvaluep.adjustqvalueCount
hsa0513120CervixCCShigellosis69/1267247/84657.64e-081.03e-066.10e-0769
hsa0510020CervixCCBacterial invasion of epithelial cells23/126777/84656.25e-042.93e-031.73e-0323
hsa05131110CervixCCShigellosis69/1267247/84657.64e-081.03e-066.10e-0769
hsa05100110CervixCCBacterial invasion of epithelial cells23/126777/84656.25e-042.93e-031.73e-0323
hsa05131ColorectumADShigellosis109/2092247/84651.09e-112.44e-101.55e-10109
hsa05100ColorectumADBacterial invasion of epithelial cells44/209277/84651.13e-092.22e-081.42e-0844
hsa051311ColorectumADShigellosis109/2092247/84651.09e-112.44e-101.55e-10109
hsa051001ColorectumADBacterial invasion of epithelial cells44/209277/84651.13e-092.22e-081.42e-0844
hsa051312ColorectumSERShigellosis87/1580247/84653.07e-107.27e-095.28e-0987
hsa051002ColorectumSERBacterial invasion of epithelial cells36/158077/84651.56e-083.45e-072.50e-0736
hsa051313ColorectumSERShigellosis87/1580247/84653.07e-107.27e-095.28e-0987
hsa051003ColorectumSERBacterial invasion of epithelial cells36/158077/84651.56e-083.45e-072.50e-0736
hsa0513126EndometriumAEHShigellosis78/1197247/84659.23e-132.00e-111.46e-1178
hsa0510026EndometriumAEHBacterial invasion of epithelial cells32/119777/84653.28e-095.91e-084.33e-0832
hsa05131111EndometriumAEHShigellosis78/1197247/84659.23e-132.00e-111.46e-1178
hsa05100111EndometriumAEHBacterial invasion of epithelial cells32/119777/84653.28e-095.91e-084.33e-0832
hsa0513127EndometriumEECShigellosis79/1237247/84651.80e-123.95e-112.95e-1179
hsa0510027EndometriumEECBacterial invasion of epithelial cells30/123777/84651.26e-071.88e-061.40e-0630
hsa0513136EndometriumEECShigellosis79/1237247/84651.80e-123.95e-112.95e-1179
hsa0510036EndometriumEECBacterial invasion of epithelial cells30/123777/84651.26e-071.88e-061.40e-0630
Page: 1 2 3 

Top

Cell-cell communication analysis

check buttonIdentification of potential cell-cell interactions between two cell types and their ligand-receptor pairs for different disease states
LigandReceptorLRpairPathwayTissueDisease Stage
Page: 1 

Top

Single-cell gene regulatory network inference analysis

check buttonFind out the significant the regulons (TFs) and the target genes of each regulon across cell types for different disease states
TFCell TypeTissueDisease StageTarget GeneRSSRegulon Activity
∗The dot plots of a searched regulon are shown for all cell subpopulations in each disease state of each tissue based on the regulon specific score inferred using pySCENIC and by calculating the average expression.
Page: 1 

Top

Somatic mutation of malignant transformation related genes

check buttonAnnotation of somatic variants for genes involved in malignant transformation
Hugo SymbolVariant ClassVariant ClassificationdbSNP RSHGVScHGVSpHGVSp ShortSWISSPROTBIOTYPESIFTPolyPhenTumor Sample BarcodeTissueHistologySexAgeStageTherapy TypesDrugsOutcome
SEPT9SNVMissense_Mutationrs745566208c.532N>Ap.Ala178Thrp.A178TQ9UHD8protein_codingtolerated_low_confidence(0.46)benign(0.024)TCGA-LL-A73Z-01Breastbreast invasive carcinomaFemale<65III/IVChemotherapyadriamycinPD
SEPT9SNVMissense_Mutationc.451G>Ap.Glu151Lysp.E151KQ9UHD8protein_codingdeleterious_low_confidence(0)possibly_damaging(0.696)TCGA-IR-A3LI-01Cervixcervical & endocervical cancerFemale<65I/IIChemotherapycisplatinCR
SEPT9SNVMissense_Mutationrs760752419c.1337C>Tp.Ala446Valp.A446VQ9UHD8protein_codingdeleterious(0.01)probably_damaging(0.998)TCGA-5M-AAT6-01Colorectumcolon adenocarcinomaFemale<65III/IVUnknownUnknownPD
SEPT9SNVMissense_Mutationrs866329694c.1003N>Tp.Arg335Cysp.R335CQ9UHD8protein_codingdeleterious(0)probably_damaging(0.959)TCGA-A6-2686-01Colorectumcolon adenocarcinomaFemale>=65I/IIUnknownUnknownSD
SEPT9SNVMissense_Mutationc.287N>Tp.Ser96Leup.S96LQ9UHD8protein_codingdeleterious_low_confidence(0.01)benign(0.079)TCGA-A6-6650-01Colorectumcolon adenocarcinomaFemale>=65I/IIUnknownUnknownSD
SEPT9SNVMissense_Mutationc.86G>Tp.Arg29Ilep.R29IQ9UHD8protein_codingdeleterious_low_confidence(0)probably_damaging(0.999)TCGA-AA-A010-01Colorectumcolon adenocarcinomaFemale<65I/IIChemotherapyfolinicCR
SEPT9SNVMissense_Mutationc.470N>Tp.Pro157Leup.P157LQ9UHD8protein_codingtolerated_low_confidence(0.13)possibly_damaging(0.84)TCGA-AD-6964-01Colorectumcolon adenocarcinomaMale<65III/IVChemotherapyfolfoxPD
SEPT9SNVMissense_Mutationrs773416606c.1711N>Ap.Ala571Thrp.A571TQ9UHD8protein_codingtolerated(0.19)benign(0.196)TCGA-F5-6814-01Colorectumrectum adenocarcinomaMale<65I/IIUnknownUnknownSD
SEPT9SNVMissense_Mutationrs748739459c.29N>Ap.Arg10Glnp.R10QQ9UHD8protein_codingtolerated_low_confidence(0.18)benign(0.02)TCGA-A5-A0G2-01Endometriumuterine corpus endometrioid carcinomaFemale<65III/IVUnknownUnknownSD
SEPT9SNVMissense_Mutationc.1090N>Tp.Pro364Serp.P364SQ9UHD8protein_codingdeleterious(0)probably_damaging(0.991)TCGA-A5-A0VP-01Endometriumuterine corpus endometrioid carcinomaFemale>=65I/IIUnknownUnknownSD
Page: 1 2 3 4 5 6 

Top

Related drugs of malignant transformation related genes

check buttonIdentification of chemicals and drugs interact with genes involved in malignant transfromation
(DGIdb 4.0)
Entrez IDSymbolCategoryInteraction TypesDrug Claim NameDrug NamePMIDs
Page: 1