
|
|||||
|
 | |
| |
| |
| |
| |
| |
|
Gene: SEPT8 |
Gene summary for SEPT8 |
| Gene information | Species | Human | Gene symbol | SEPT8 | Gene ID | 23176 |
| Gene name | septin 8 | |
| Gene Alias | SEP2 | |
| Cytomap | 5q31.1 | |
| Gene Type | protein-coding | GO ID | GO:0000910 | UniProtAcc | Q92599 |
Top |
Malignant transformation analysis |
| Identification of the aberrant gene expression in precancerous and cancerous lesions by comparing the gene expression of stem-like cells in diseased tissues with normal stem cells |
| Entrez ID | Symbol | Replicates | Species | Organ | Tissue | Adj P-value | Log2FC | Malignancy |
| 23176 | SEPT8 | C04 | Human | Oral cavity | OSCC | 4.66e-06 | 3.55e-01 | 0.2633 |
| 23176 | SEPT8 | C21 | Human | Oral cavity | OSCC | 1.96e-20 | 6.40e-01 | 0.2678 |
| 23176 | SEPT8 | C30 | Human | Oral cavity | OSCC | 4.23e-28 | 9.98e-01 | 0.3055 |
| 23176 | SEPT8 | C38 | Human | Oral cavity | OSCC | 3.26e-03 | 4.58e-01 | 0.172 |
| 23176 | SEPT8 | C43 | Human | Oral cavity | OSCC | 7.38e-12 | 2.68e-01 | 0.1704 |
| 23176 | SEPT8 | C46 | Human | Oral cavity | OSCC | 7.56e-05 | 1.84e-01 | 0.1673 |
| 23176 | SEPT8 | C51 | Human | Oral cavity | OSCC | 5.96e-06 | 3.88e-01 | 0.2674 |
| 23176 | SEPT8 | C06 | Human | Oral cavity | OSCC | 1.51e-06 | 8.91e-01 | 0.2699 |
| 23176 | SEPT8 | C08 | Human | Oral cavity | OSCC | 6.40e-06 | 1.72e-01 | 0.1919 |
| 23176 | SEPT8 | LN46 | Human | Oral cavity | OSCC | 1.86e-04 | 2.77e-01 | 0.1666 |
| 23176 | SEPT8 | SYSMH2 | Human | Oral cavity | OSCC | 4.45e-08 | 2.46e-01 | 0.2326 |
| 23176 | SEPT8 | SYSMH3 | Human | Oral cavity | OSCC | 1.09e-03 | 1.61e-01 | 0.2442 |
| 23176 | SEPT8 | PTC01 | Human | Thyroid | PTC | 6.00e-06 | 9.56e-02 | 0.1899 |
| 23176 | SEPT8 | PTC03 | Human | Thyroid | PTC | 8.72e-03 | 1.44e-01 | 0.1784 |
| 23176 | SEPT8 | PTC04 | Human | Thyroid | PTC | 5.29e-10 | 1.38e-01 | 0.1927 |
| 23176 | SEPT8 | PTC05 | Human | Thyroid | PTC | 3.75e-18 | 5.31e-01 | 0.2065 |
| 23176 | SEPT8 | PTC06 | Human | Thyroid | PTC | 2.49e-24 | 6.10e-01 | 0.2057 |
| 23176 | SEPT8 | PTC07 | Human | Thyroid | PTC | 1.91e-23 | 2.31e-01 | 0.2044 |
| 23176 | SEPT8 | ATC09 | Human | Thyroid | ATC | 1.15e-06 | 1.16e-01 | 0.2871 |
| 23176 | SEPT8 | ATC11 | Human | Thyroid | ATC | 1.25e-03 | 3.52e-01 | 0.3386 |
| Page: 1 2 |
| Tissue | Expression Dynamics | Abbreviation |
| Oral Cavity | 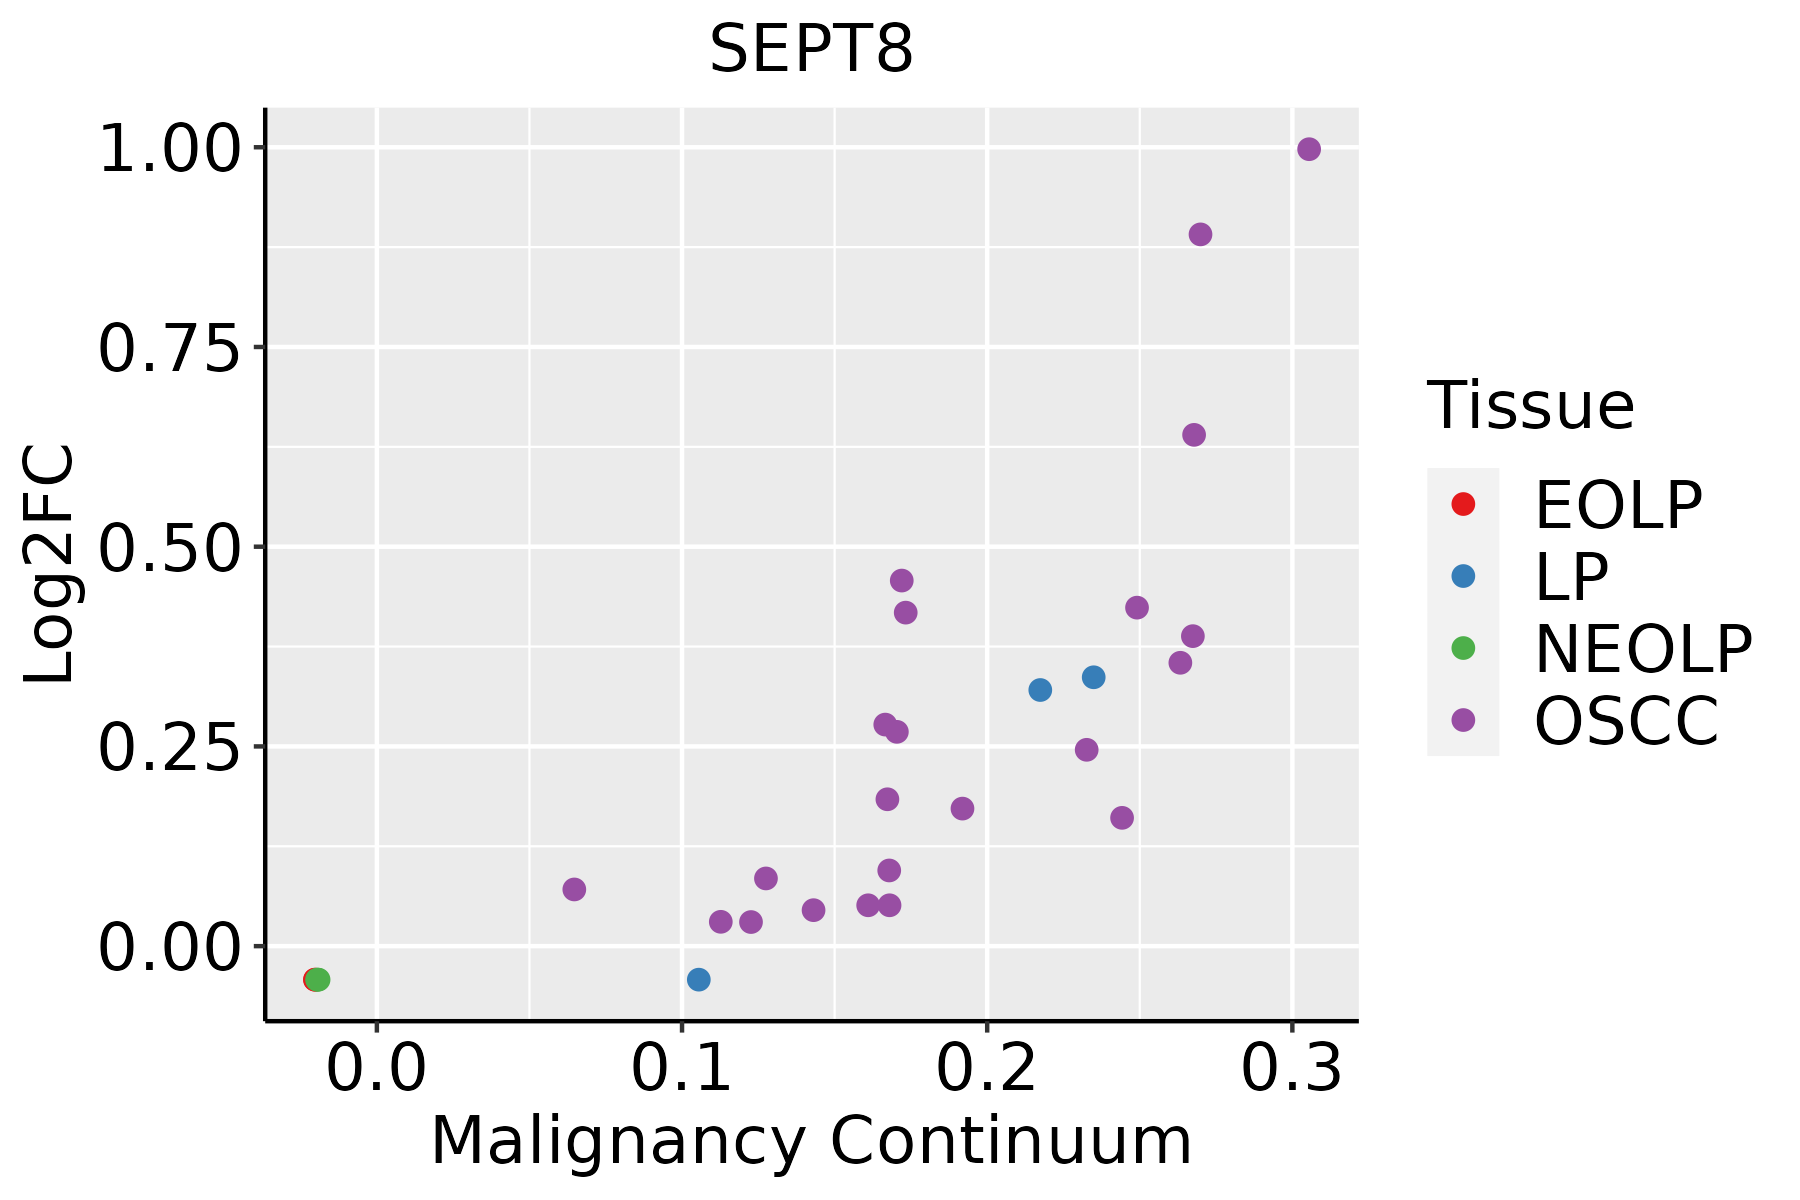 | EOLP: Erosive Oral lichen planus |
| LP: leukoplakia | ||
| NEOLP: Non-erosive oral lichen planus | ||
| OSCC: Oral squamous cell carcinoma | ||
| Thyroid | 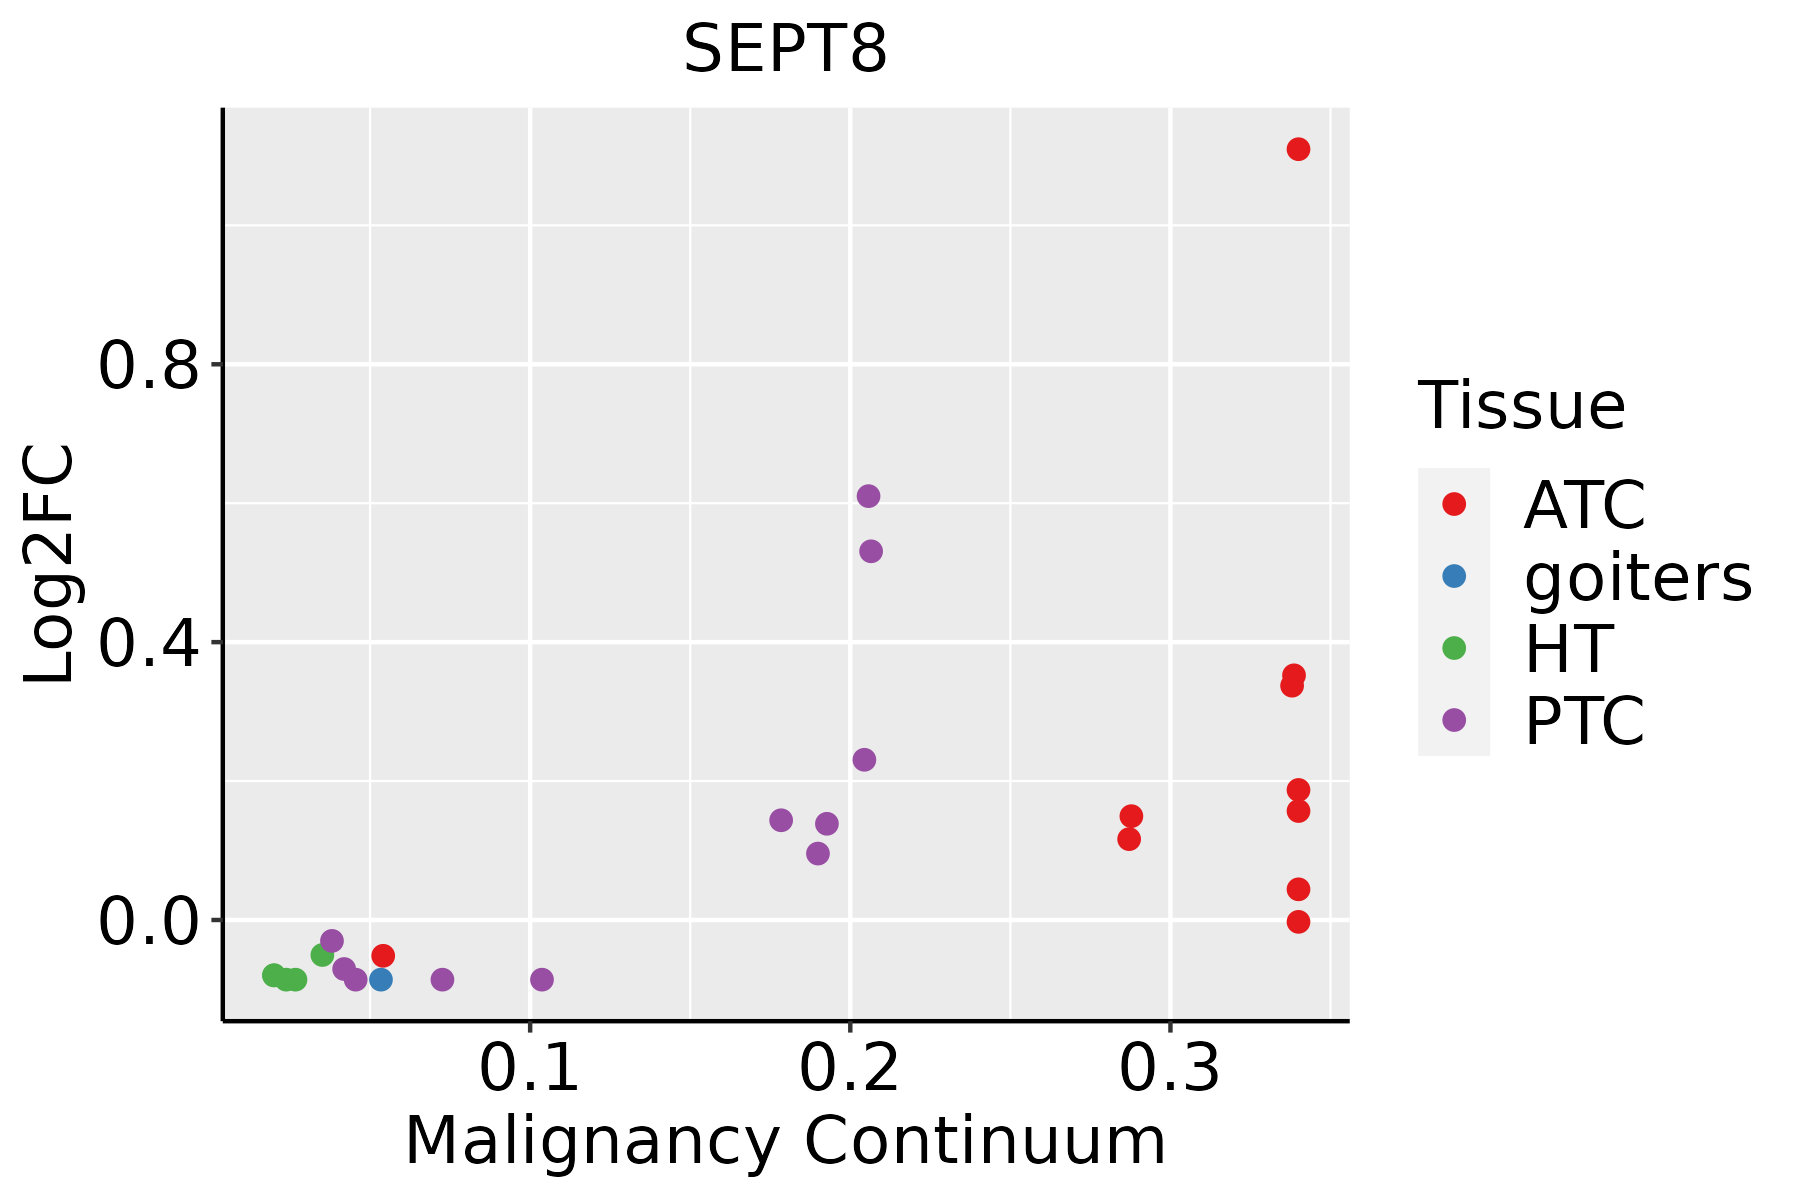 | ATC: Anaplastic thyroid cancer |
| HT: Hashimoto's thyroiditis | ||
| PTC: Papillary thyroid cancer |
| ∗log2FC in expression of this searched gene in stem-like cells from each diseased tissue sample relative to stem-like cells in normal samples in each tissue plotted against the malignancy continuum. Samples are colored based on if they are from different disease stage. |
Top |
Malignant transformation related pathway analysis |
| Find out the enriched GO biological processes and KEGG pathways involved in transition from healthy to precancer to cancer |
| Tissue | Disease Stage | Enriched GO biological Processes |
| Colorectum | AD |  |
| Colorectum | SER |  |
| Colorectum | MSS |  |
| Colorectum | MSI-H |  |
| Colorectum | FAP |  |
| ∗Top 15 enriched GO BP terms are showed in the bar plot of each disease state in each tissue. Each row represents a significant GO biological process which is colored according to the -log10(p.adjust). |
| Page: 1 2 3 4 5 6 7 8 9 |
| GO ID | Tissue | Disease Stage | Description | Gene Ratio | Bg Ratio | pvalue | p.adjust | Count |
| Page: 1 |
| Pathway ID | Tissue | Disease Stage | Description | Gene Ratio | Bg Ratio | pvalue | p.adjust | qvalue | Count |
| hsa05131 | Colorectum | AD | Shigellosis | 109/2092 | 247/8465 | 1.09e-11 | 2.44e-10 | 1.55e-10 | 109 |
| hsa05100 | Colorectum | AD | Bacterial invasion of epithelial cells | 44/2092 | 77/8465 | 1.13e-09 | 2.22e-08 | 1.42e-08 | 44 |
| hsa051311 | Colorectum | AD | Shigellosis | 109/2092 | 247/8465 | 1.09e-11 | 2.44e-10 | 1.55e-10 | 109 |
| hsa051001 | Colorectum | AD | Bacterial invasion of epithelial cells | 44/2092 | 77/8465 | 1.13e-09 | 2.22e-08 | 1.42e-08 | 44 |
| hsa051312 | Colorectum | SER | Shigellosis | 87/1580 | 247/8465 | 3.07e-10 | 7.27e-09 | 5.28e-09 | 87 |
| hsa051002 | Colorectum | SER | Bacterial invasion of epithelial cells | 36/1580 | 77/8465 | 1.56e-08 | 3.45e-07 | 2.50e-07 | 36 |
| hsa051313 | Colorectum | SER | Shigellosis | 87/1580 | 247/8465 | 3.07e-10 | 7.27e-09 | 5.28e-09 | 87 |
| hsa051003 | Colorectum | SER | Bacterial invasion of epithelial cells | 36/1580 | 77/8465 | 1.56e-08 | 3.45e-07 | 2.50e-07 | 36 |
| Page: 1 |
Top |
Cell-cell communication analysis |
| Identification of potential cell-cell interactions between two cell types and their ligand-receptor pairs for different disease states |
| Ligand | Receptor | LRpair | Pathway | Tissue | Disease Stage |
| Page: 1 |
Top |
Single-cell gene regulatory network inference analysis |
| Find out the significant the regulons (TFs) and the target genes of each regulon across cell types for different disease states |
| TF | Cell Type | Tissue | Disease Stage | Target Gene | RSS | Regulon Activity |
| ∗The dot plots of a searched regulon are shown for all cell subpopulations in each disease state of each tissue based on the regulon specific score inferred using pySCENIC and by calculating the average expression. |
| Page: 1 |
Top |
Somatic mutation of malignant transformation related genes |
| Annotation of somatic variants for genes involved in malignant transformation |
| Hugo Symbol | Variant Class | Variant Classification | dbSNP RS | HGVSc | HGVSp | HGVSp Short | SWISSPROT | BIOTYPE | SIFT | PolyPhen | Tumor Sample Barcode | Tissue | Histology | Sex | Age | Stage | Therapy Types | Drugs | Outcome |
| SEPT8 | SNV | Missense_Mutation | novel | c.1243N>A | p.Ala415Thr | p.A415T | Q92599 | protein_coding | tolerated(0.17) | benign(0.129) | TCGA-A2-A25E-01 | Breast | breast invasive carcinoma | Female | <65 | III/IV | Chemotherapy | cytoxan | PD |
| SEPT8 | SNV | Missense_Mutation | novel | c.1032G>A | p.Met344Ile | p.M344I | Q92599 | protein_coding | tolerated(0.06) | probably_damaging(0.958) | TCGA-A8-A08L-01 | Breast | breast invasive carcinoma | Female | >=65 | III/IV | Unknown | Unknown | SD |
| SEPT8 | SNV | Missense_Mutation | novel | c.58N>C | p.Ser20Pro | p.S20P | Q92599 | protein_coding | tolerated(0.24) | benign(0.265) | TCGA-A8-A09Z-01 | Breast | breast invasive carcinoma | Female | >=65 | I/II | Unknown | Unknown | SD |
| SEPT8 | SNV | Missense_Mutation | novel | c.1284N>T | p.Lys428Asn | p.K428N | Q92599 | protein_coding | deleterious_low_confidence(0) | probably_damaging(0.987) | TCGA-AN-A046-01 | Breast | breast invasive carcinoma | Female | >=65 | I/II | Unknown | Unknown | SD |
| SEPT8 | SNV | Missense_Mutation | c.1366N>T | p.Pro456Ser | p.P456S | Q92599 | protein_coding | deleterious_low_confidence(0) | benign(0.014) | TCGA-BH-A0E2-01 | Breast | breast invasive carcinoma | Female | <65 | III/IV | Chemotherapy | doxorubicin | SD | |
| SEPT8 | insertion | In_Frame_Ins | novel | c.1364_1365insTACCCAAAG | p.Glu455delinsAspThrGlnArg | p.E455delinsDTQR | Q92599 | protein_coding | TCGA-BH-A0E2-01 | Breast | breast invasive carcinoma | Female | <65 | III/IV | Chemotherapy | doxorubicin | SD | ||
| SEPT8 | SNV | Missense_Mutation | rs372810925 | c.556G>A | p.Ala186Thr | p.A186T | Q92599 | protein_coding | deleterious(0) | probably_damaging(0.985) | TCGA-VS-A94Z-01 | Cervix | cervical & endocervical cancer | Female | <65 | I/II | Chemotherapy | cisplatin | CR |
| SEPT8 | SNV | Missense_Mutation | novel | c.283G>A | p.Val95Met | p.V95M | Q92599 | protein_coding | deleterious(0) | probably_damaging(1) | TCGA-5M-AAT6-01 | Colorectum | colon adenocarcinoma | Female | <65 | III/IV | Unknown | Unknown | PD |
| SEPT8 | SNV | Missense_Mutation | novel | c.218A>C | p.Glu73Ala | p.E73A | Q92599 | protein_coding | tolerated(0.21) | probably_damaging(0.999) | TCGA-AA-3673-01 | Colorectum | colon adenocarcinoma | Female | <65 | I/II | Unknown | Unknown | SD |
| SEPT8 | SNV | Missense_Mutation | c.1366N>T | p.Pro456Ser | p.P456S | Q92599 | protein_coding | deleterious_low_confidence(0) | benign(0.014) | TCGA-AA-3989-01 | Colorectum | colon adenocarcinoma | Male | >=65 | III/IV | Unknown | Unknown | PD |
| Page: 1 2 3 4 5 |
Top |
Related drugs of malignant transformation related genes |
| Identification of chemicals and drugs interact with genes involved in malignant transfromation |
| (DGIdb 4.0) |
| Entrez ID | Symbol | Category | Interaction Types | Drug Claim Name | Drug Name | PMIDs |
| Page: 1 |

Copyright 2023-Present -The University of Texas Health Science Center at Houston |