
|
|||||
|
 | |
| |
| |
| |
| |
| |
|
Gene: SEPT6 |
Gene summary for SEPT6 |
| Gene information | Species | Human | Gene symbol | SEPT6 | Gene ID | 23157 |
| Gene name | septin 6 | |
| Gene Alias | SEP2 | |
| Cytomap | Xq24 | |
| Gene Type | protein-coding | GO ID | GO:0000003 | UniProtAcc | Q14141 |
Top |
Malignant transformation analysis |
| Identification of the aberrant gene expression in precancerous and cancerous lesions by comparing the gene expression of stem-like cells in diseased tissues with normal stem cells |
| Entrez ID | Symbol | Replicates | Species | Organ | Tissue | Adj P-value | Log2FC | Malignancy |
| 23157 | SEPT6 | P2T-E | Human | Esophagus | ESCC | 4.51e-31 | 5.10e-01 | 0.1177 |
| 23157 | SEPT6 | P4T-E | Human | Esophagus | ESCC | 5.59e-15 | 2.48e-01 | 0.1323 |
| 23157 | SEPT6 | P5T-E | Human | Esophagus | ESCC | 3.14e-11 | 1.29e-01 | 0.1327 |
| 23157 | SEPT6 | P8T-E | Human | Esophagus | ESCC | 1.70e-13 | 3.65e-01 | 0.0889 |
| 23157 | SEPT6 | P9T-E | Human | Esophagus | ESCC | 1.97e-02 | 1.59e-01 | 0.1131 |
| 23157 | SEPT6 | P10T-E | Human | Esophagus | ESCC | 8.78e-03 | 6.93e-02 | 0.116 |
| 23157 | SEPT6 | P11T-E | Human | Esophagus | ESCC | 2.21e-08 | 4.22e-01 | 0.1426 |
| 23157 | SEPT6 | P12T-E | Human | Esophagus | ESCC | 8.73e-10 | 9.12e-02 | 0.1122 |
| 23157 | SEPT6 | P15T-E | Human | Esophagus | ESCC | 7.21e-03 | 3.78e-02 | 0.1149 |
| 23157 | SEPT6 | P16T-E | Human | Esophagus | ESCC | 2.40e-10 | 1.23e-01 | 0.1153 |
| 23157 | SEPT6 | P17T-E | Human | Esophagus | ESCC | 6.90e-06 | 3.30e-01 | 0.1278 |
| 23157 | SEPT6 | P19T-E | Human | Esophagus | ESCC | 8.06e-03 | 1.74e-01 | 0.1662 |
| 23157 | SEPT6 | P21T-E | Human | Esophagus | ESCC | 6.82e-16 | 2.56e-01 | 0.1617 |
| 23157 | SEPT6 | P22T-E | Human | Esophagus | ESCC | 2.20e-16 | 1.82e-01 | 0.1236 |
| 23157 | SEPT6 | P23T-E | Human | Esophagus | ESCC | 3.50e-07 | 1.35e-01 | 0.108 |
| 23157 | SEPT6 | P24T-E | Human | Esophagus | ESCC | 3.31e-07 | 9.95e-02 | 0.1287 |
| 23157 | SEPT6 | P26T-E | Human | Esophagus | ESCC | 9.02e-08 | 1.36e-01 | 0.1276 |
| 23157 | SEPT6 | P27T-E | Human | Esophagus | ESCC | 5.72e-22 | 1.15e-01 | 0.1055 |
| 23157 | SEPT6 | P31T-E | Human | Esophagus | ESCC | 1.57e-05 | 2.53e-02 | 0.1251 |
| 23157 | SEPT6 | P32T-E | Human | Esophagus | ESCC | 1.54e-14 | 2.95e-01 | 0.1666 |
| Page: 1 2 3 4 |
| Tissue | Expression Dynamics | Abbreviation |
| Esophagus | 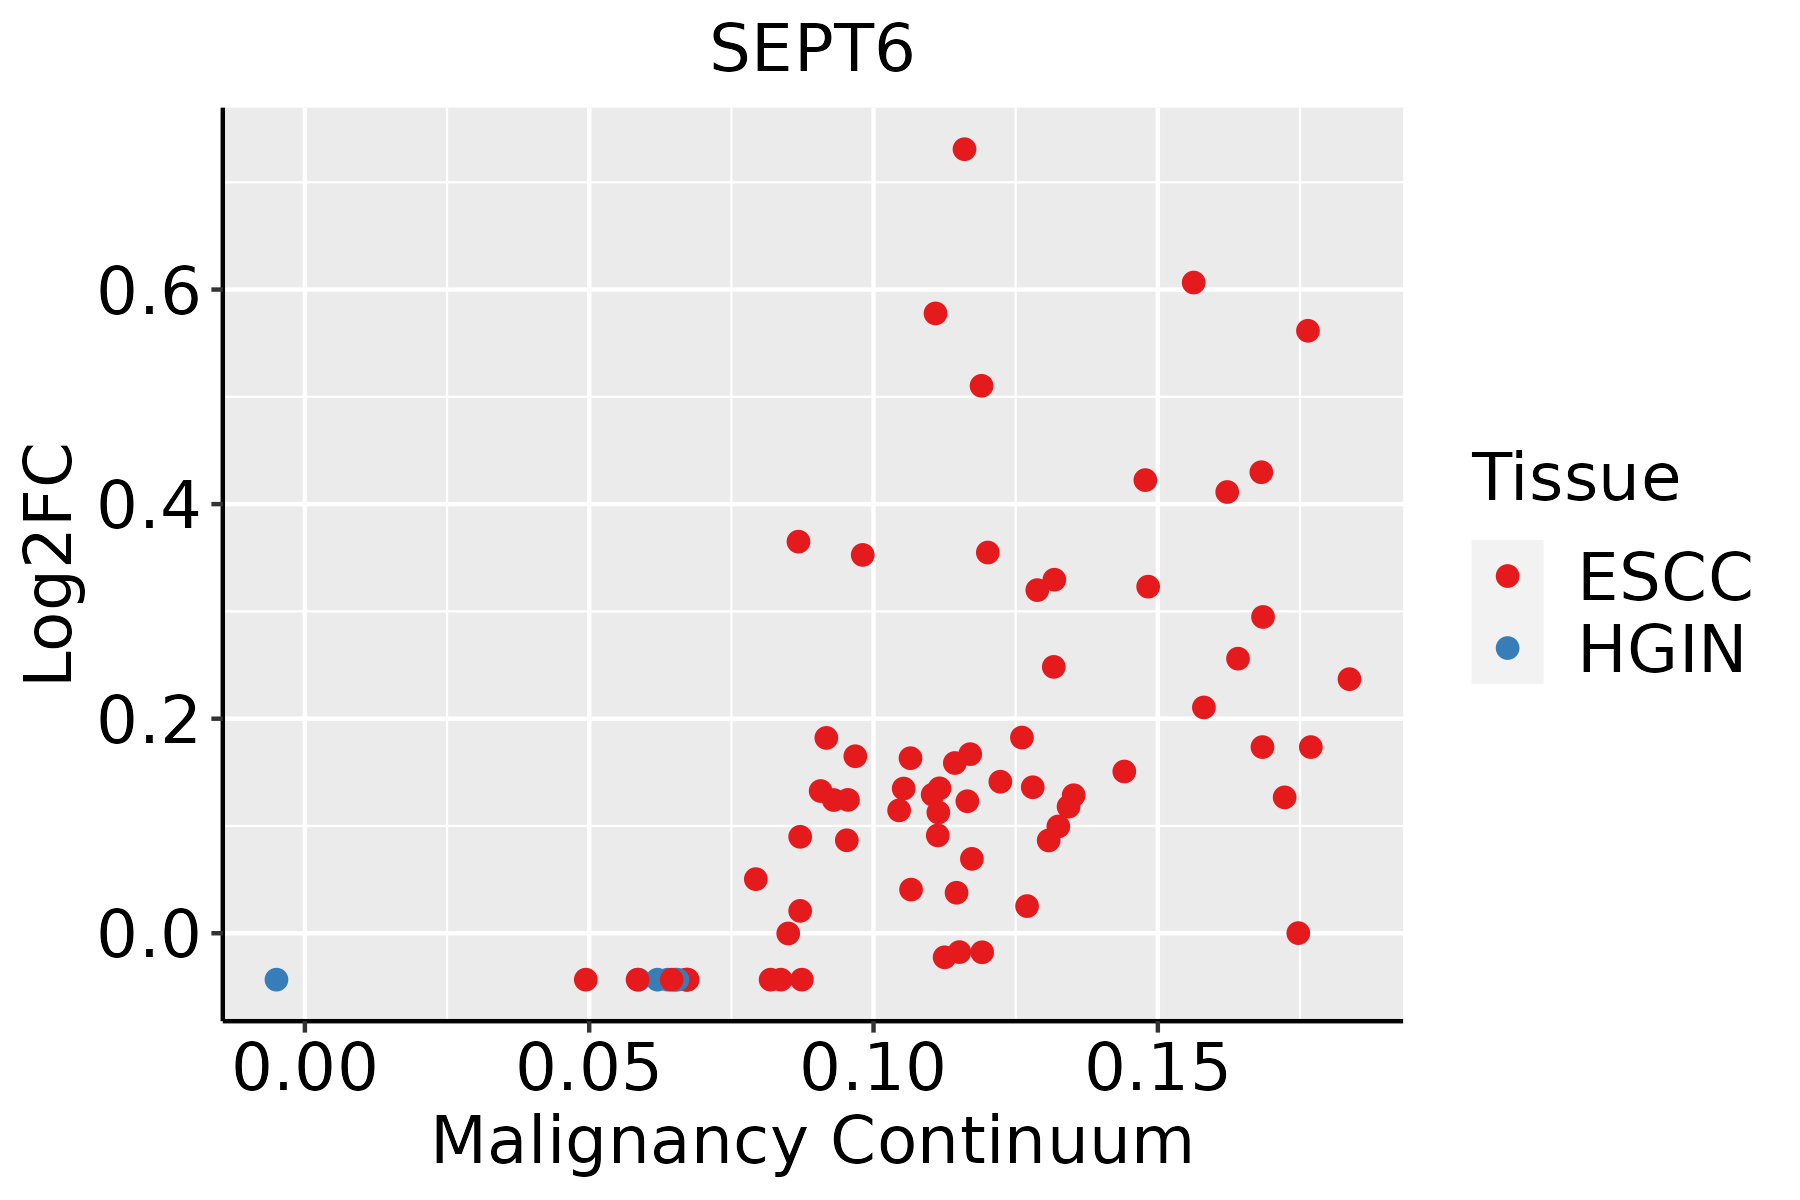 | ESCC: Esophageal squamous cell carcinoma |
| HGIN: High-grade intraepithelial neoplasias | ||
| LGIN: Low-grade intraepithelial neoplasias | ||
| Liver |  | HCC: Hepatocellular carcinoma |
| NAFLD: Non-alcoholic fatty liver disease | ||
| Prostate | 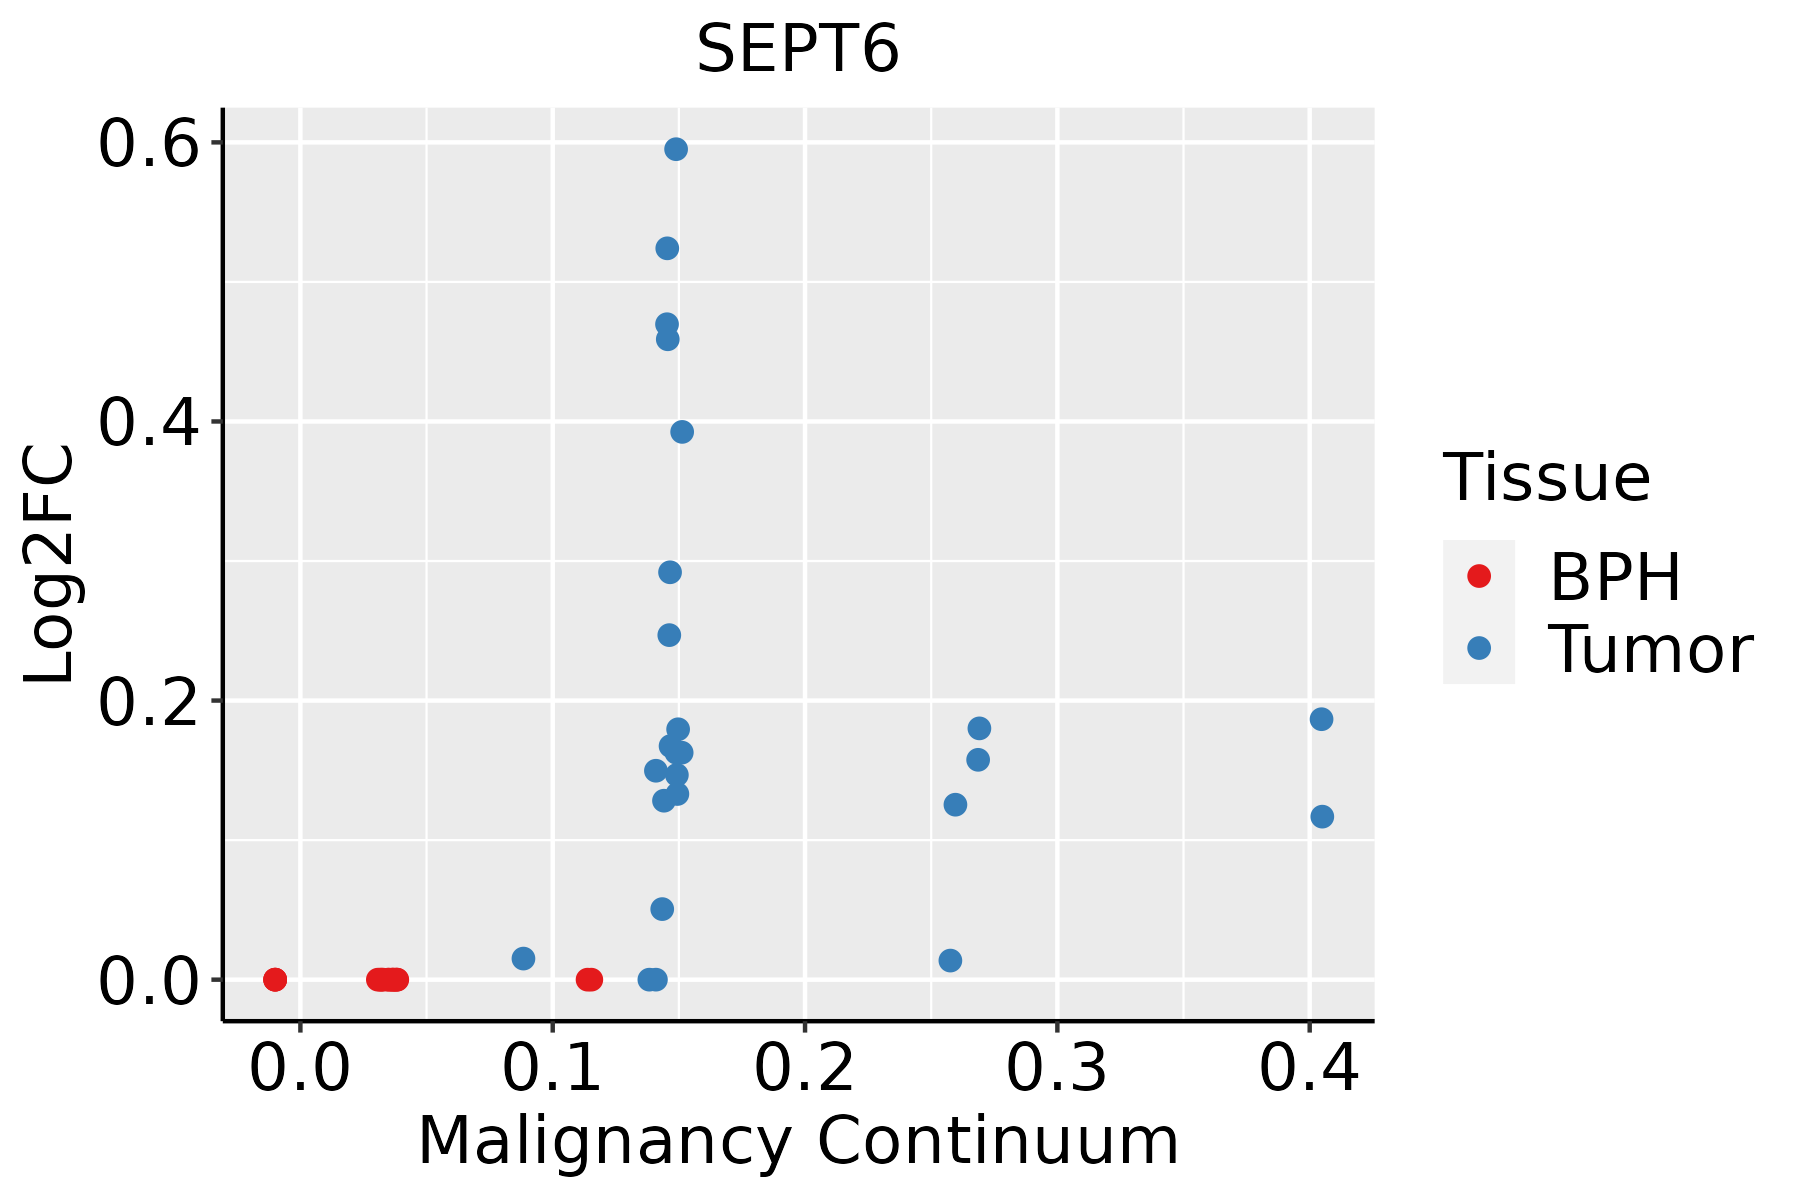 | BPH: Benign Prostatic Hyperplasia |
| Thyroid | 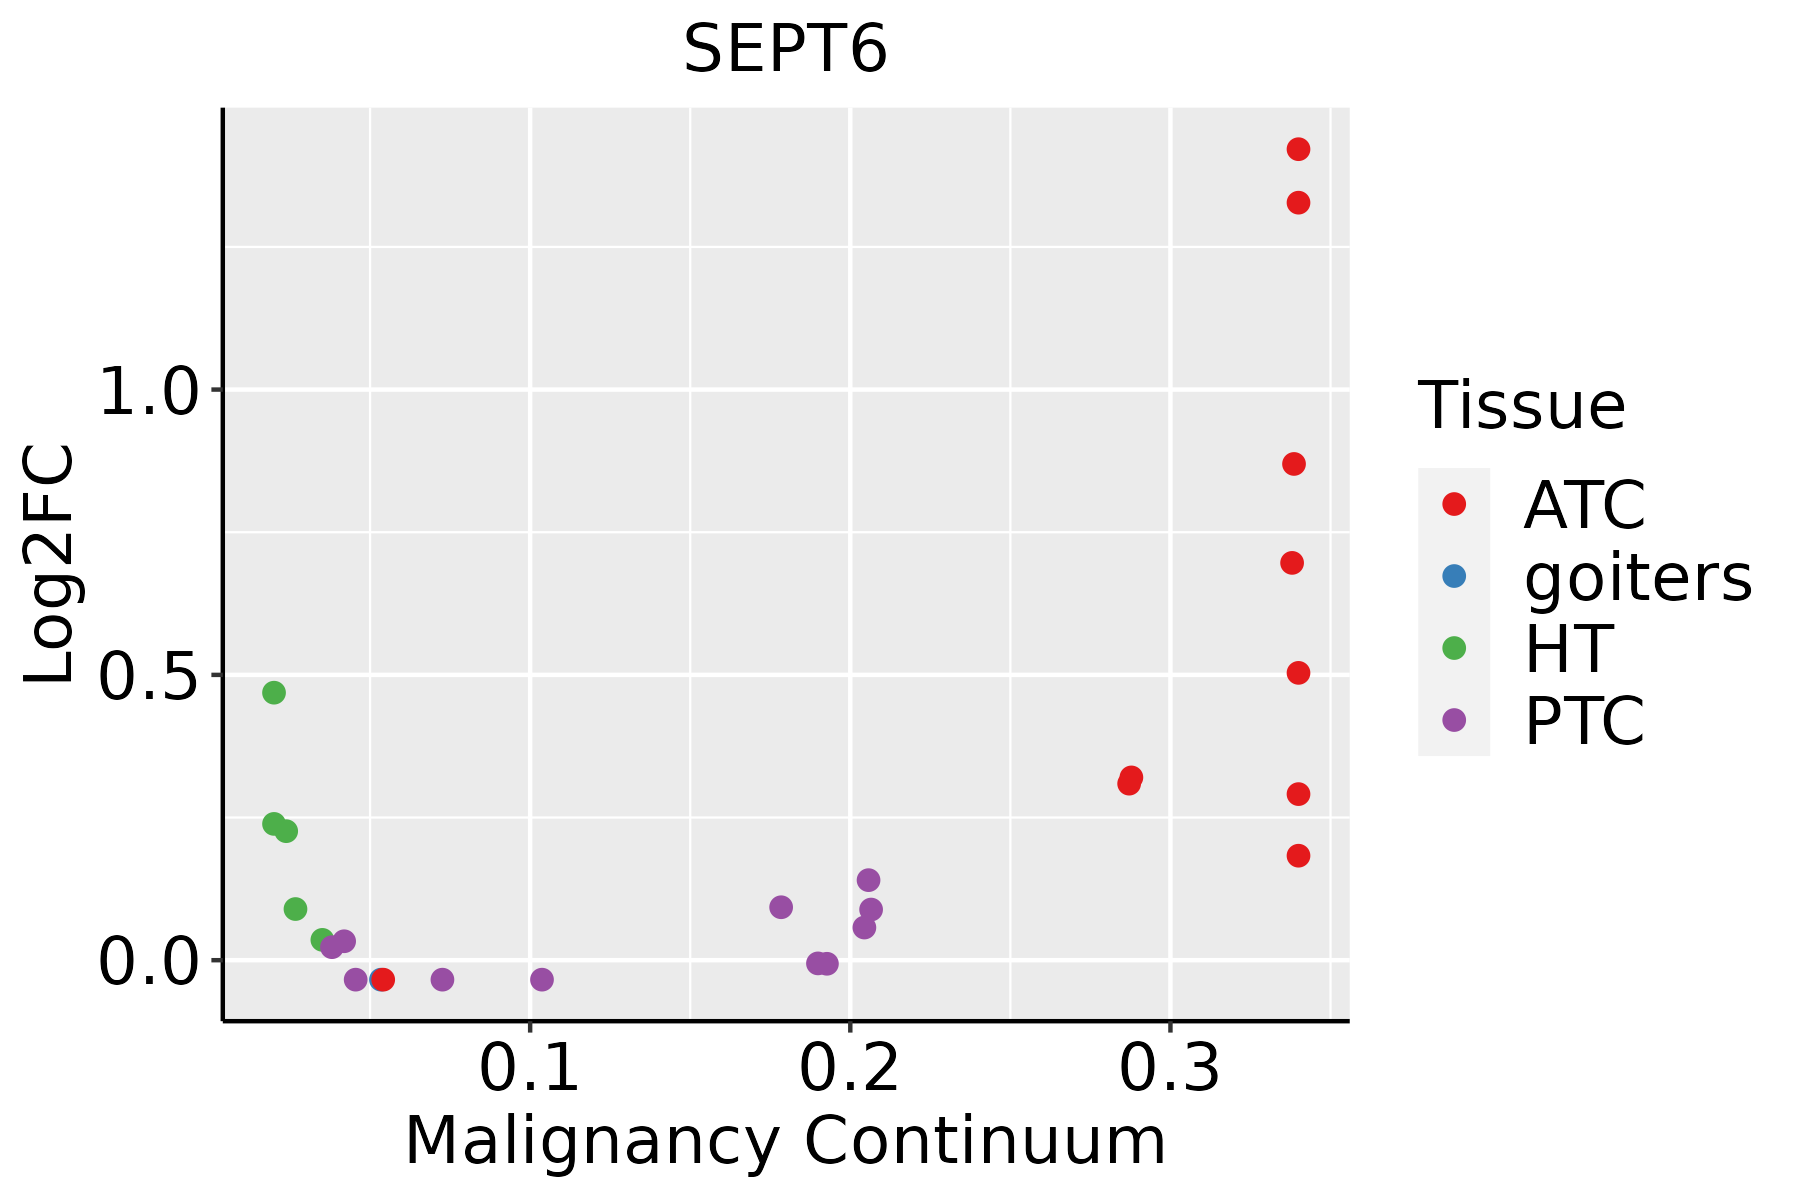 | ATC: Anaplastic thyroid cancer |
| HT: Hashimoto's thyroiditis | ||
| PTC: Papillary thyroid cancer |
| ∗log2FC in expression of this searched gene in stem-like cells from each diseased tissue sample relative to stem-like cells in normal samples in each tissue plotted against the malignancy continuum. Samples are colored based on if they are from different disease stage. |
Top |
Malignant transformation related pathway analysis |
| Find out the enriched GO biological processes and KEGG pathways involved in transition from healthy to precancer to cancer |
| Tissue | Disease Stage | Enriched GO biological Processes |
| Colorectum | AD |  |
| Colorectum | SER |  |
| Colorectum | MSS |  |
| Colorectum | MSI-H |  |
| Colorectum | FAP |  |
| ∗Top 15 enriched GO BP terms are showed in the bar plot of each disease state in each tissue. Each row represents a significant GO biological process which is colored according to the -log10(p.adjust). |
| Page: 1 2 3 4 5 6 7 8 9 |
| GO ID | Tissue | Disease Stage | Description | Gene Ratio | Bg Ratio | pvalue | p.adjust | Count |
| Page: 1 |
| Pathway ID | Tissue | Disease Stage | Description | Gene Ratio | Bg Ratio | pvalue | p.adjust | qvalue | Count |
| hsa0513139 | Esophagus | HGIN | Shigellosis | 71/1383 | 247/8465 | 4.89e-07 | 7.98e-06 | 6.34e-06 | 71 |
| hsa0510039 | Esophagus | HGIN | Bacterial invasion of epithelial cells | 30/1383 | 77/8465 | 1.49e-06 | 2.31e-05 | 1.84e-05 | 30 |
| hsa05131114 | Esophagus | HGIN | Shigellosis | 71/1383 | 247/8465 | 4.89e-07 | 7.98e-06 | 6.34e-06 | 71 |
| hsa05100114 | Esophagus | HGIN | Bacterial invasion of epithelial cells | 30/1383 | 77/8465 | 1.49e-06 | 2.31e-05 | 1.84e-05 | 30 |
| hsa05131211 | Esophagus | ESCC | Shigellosis | 176/4205 | 247/8465 | 2.27e-12 | 4.01e-11 | 2.05e-11 | 176 |
| hsa05100211 | Esophagus | ESCC | Bacterial invasion of epithelial cells | 59/4205 | 77/8465 | 1.05e-06 | 6.76e-06 | 3.46e-06 | 59 |
| hsa05131310 | Esophagus | ESCC | Shigellosis | 176/4205 | 247/8465 | 2.27e-12 | 4.01e-11 | 2.05e-11 | 176 |
| hsa05100310 | Esophagus | ESCC | Bacterial invasion of epithelial cells | 59/4205 | 77/8465 | 1.05e-06 | 6.76e-06 | 3.46e-06 | 59 |
| Page: 1 |
Top |
Cell-cell communication analysis |
| Identification of potential cell-cell interactions between two cell types and their ligand-receptor pairs for different disease states |
| Ligand | Receptor | LRpair | Pathway | Tissue | Disease Stage |
| Page: 1 |
Top |
Single-cell gene regulatory network inference analysis |
| Find out the significant the regulons (TFs) and the target genes of each regulon across cell types for different disease states |
| TF | Cell Type | Tissue | Disease Stage | Target Gene | RSS | Regulon Activity |
| ∗The dot plots of a searched regulon are shown for all cell subpopulations in each disease state of each tissue based on the regulon specific score inferred using pySCENIC and by calculating the average expression. |
| Page: 1 |
Top |
Somatic mutation of malignant transformation related genes |
| Annotation of somatic variants for genes involved in malignant transformation |
| Hugo Symbol | Variant Class | Variant Classification | dbSNP RS | HGVSc | HGVSp | HGVSp Short | SWISSPROT | BIOTYPE | SIFT | PolyPhen | Tumor Sample Barcode | Tissue | Histology | Sex | Age | Stage | Therapy Types | Drugs | Outcome |
| SEPT6 | SNV | Missense_Mutation | novel | c.1300N>A | p.Glu434Lys | p.E434K | Q14141 | protein_coding | deleterious_low_confidence(0.02) | benign(0.055) | TCGA-3C-AALI-01 | Breast | breast invasive carcinoma | Female | <65 | I/II | Unspecific | Poly E | Complete Response |
| SEPT6 | SNV | Missense_Mutation | c.940N>C | p.Asp314His | p.D314H | Q14141 | protein_coding | deleterious(0.01) | probably_damaging(0.999) | TCGA-AC-A23H-01 | Breast | breast invasive carcinoma | Female | >=65 | I/II | Unknown | Unknown | PD | |
| SEPT6 | SNV | Missense_Mutation | rs756379839 | c.44G>A | p.Arg15Gln | p.R15Q | Q14141 | protein_coding | deleterious(0.01) | probably_damaging(0.98) | TCGA-PL-A8LZ-01 | Breast | breast invasive carcinoma | Female | <65 | III/IV | Chemotherapy | paclitaxel | SD |
| SEPT6 | insertion | Frame_Shift_Ins | novel | c.1018_1019insCACCTGTAGTCCCAGCTACTTGGGAGACTGAGGCAGA | p.Glu340AlafsTer42 | p.E340Afs*42 | Q14141 | protein_coding | TCGA-AO-A0JB-01 | Breast | breast invasive carcinoma | Female | <65 | III/IV | Chemotherapy | cyclophosphamide | SD | ||
| SEPT6 | insertion | Nonsense_Mutation | novel | c.1015_1016insGAGTTTAAGACCAGCCTGGGCAACATACTGAGACCCTGTTT | p.Glu339GlyfsTer3 | p.E339Gfs*3 | Q14141 | protein_coding | TCGA-BH-A0HF-01 | Breast | breast invasive carcinoma | Female | >=65 | I/II | Hormone Therapy | arimidex | SD | ||
| SEPT6 | SNV | Missense_Mutation | novel | c.334G>A | p.Glu112Lys | p.E112K | Q14141 | protein_coding | deleterious(0.04) | benign(0.217) | TCGA-C5-A1BL-01 | Cervix | cervical & endocervical cancer | Female | <65 | I/II | Unknown | Unknown | SD |
| SEPT6 | SNV | Missense_Mutation | rs770681536 | c.1202N>T | p.Thr401Met | p.T401M | Q14141 | protein_coding | deleterious(0.02) | possibly_damaging(0.61) | TCGA-DS-A1OD-01 | Cervix | cervical & endocervical cancer | Female | <65 | I/II | Chemotherapy | cisplatin | SD |
| SEPT6 | SNV | Missense_Mutation | c.37N>A | p.Gly13Ser | p.G13S | Q14141 | protein_coding | tolerated(0.68) | benign(0.097) | TCGA-A6-A565-01 | Colorectum | colon adenocarcinoma | Female | <65 | III/IV | Unspecific | 5FU | PD | |
| SEPT6 | SNV | Missense_Mutation | rs145877420 | c.473N>T | p.Thr158Met | p.T158M | Q14141 | protein_coding | deleterious(0) | probably_damaging(1) | TCGA-AA-3947-01 | Colorectum | colon adenocarcinoma | Female | <65 | I/II | Unknown | Unknown | SD |
| SEPT6 | SNV | Missense_Mutation | rs866977085 | c.569C>T | p.Ser190Leu | p.S190L | Q14141 | protein_coding | deleterious(0) | benign(0.311) | TCGA-CA-6717-01 | Colorectum | colon adenocarcinoma | Male | <65 | I/II | Chemotherapy | oxaliplatin | CR |
| Page: 1 2 3 4 5 6 |
Top |
Related drugs of malignant transformation related genes |
| Identification of chemicals and drugs interact with genes involved in malignant transfromation |
| (DGIdb 4.0) |
| Entrez ID | Symbol | Category | Interaction Types | Drug Claim Name | Drug Name | PMIDs |
| Page: 1 |

Copyright 2023-Present -The University of Texas Health Science Center at Houston |