
|
|||||
|
 | |
| |
| |
| |
| |
| |
|
Gene: SEPHS2 |
Gene summary for SEPHS2 |
| Gene information | Species | Human | Gene symbol | SEPHS2 | Gene ID | 22928 |
| Gene name | selenophosphate synthetase 2 | |
| Gene Alias | SPS2 | |
| Cytomap | 16p11.2 | |
| Gene Type | protein-coding | GO ID | GO:0001887 | UniProtAcc | Q99611 |
Top |
Malignant transformation analysis |
| Identification of the aberrant gene expression in precancerous and cancerous lesions by comparing the gene expression of stem-like cells in diseased tissues with normal stem cells |
| Entrez ID | Symbol | Replicates | Species | Organ | Tissue | Adj P-value | Log2FC | Malignancy |
| 22928 | SEPHS2 | GSM4909281 | Human | Breast | IDC | 8.88e-05 | 2.25e-01 | 0.21 |
| 22928 | SEPHS2 | GSM4909285 | Human | Breast | IDC | 7.53e-08 | 3.06e-01 | 0.21 |
| 22928 | SEPHS2 | GSM4909290 | Human | Breast | IDC | 3.95e-04 | 3.12e-01 | 0.2096 |
| 22928 | SEPHS2 | GSM4909293 | Human | Breast | IDC | 2.87e-04 | 1.93e-01 | 0.1581 |
| 22928 | SEPHS2 | GSM4909298 | Human | Breast | IDC | 1.62e-07 | 2.71e-01 | 0.1551 |
| 22928 | SEPHS2 | GSM4909304 | Human | Breast | IDC | 1.35e-03 | 2.15e-01 | 0.1636 |
| 22928 | SEPHS2 | GSM4909305 | Human | Breast | IDC | 1.05e-04 | 3.26e-01 | 0.0436 |
| 22928 | SEPHS2 | GSM4909306 | Human | Breast | IDC | 5.71e-29 | 6.60e-01 | 0.1564 |
| 22928 | SEPHS2 | GSM4909308 | Human | Breast | IDC | 8.70e-07 | 2.86e-01 | 0.158 |
| 22928 | SEPHS2 | GSM4909311 | Human | Breast | IDC | 3.41e-03 | -7.81e-02 | 0.1534 |
| 22928 | SEPHS2 | GSM4909312 | Human | Breast | IDC | 1.23e-02 | 1.42e-01 | 0.1552 |
| 22928 | SEPHS2 | GSM4909317 | Human | Breast | IDC | 1.33e-14 | 4.40e-01 | 0.1355 |
| 22928 | SEPHS2 | GSM4909319 | Human | Breast | IDC | 8.49e-11 | 5.40e-02 | 0.1563 |
| 22928 | SEPHS2 | GSM4909321 | Human | Breast | IDC | 9.13e-05 | 1.79e-01 | 0.1559 |
| 22928 | SEPHS2 | brca1 | Human | Breast | Precancer | 2.10e-03 | -1.77e-01 | -0.0338 |
| 22928 | SEPHS2 | brca3 | Human | Breast | Precancer | 7.77e-03 | -1.79e-01 | -0.0263 |
| 22928 | SEPHS2 | P1 | Human | Breast | IDC | 2.37e-03 | 7.72e-02 | 0.1527 |
| 22928 | SEPHS2 | DCIS2 | Human | Breast | DCIS | 1.72e-49 | 2.24e-01 | 0.0085 |
| 22928 | SEPHS2 | HTA11_2487_2000001011 | Human | Colorectum | SER | 1.40e-17 | 5.97e-01 | -0.1808 |
| 22928 | SEPHS2 | HTA11_1938_2000001011 | Human | Colorectum | AD | 7.74e-14 | 5.44e-01 | -0.0811 |
| Page: 1 2 3 4 5 6 7 |
| Tissue | Expression Dynamics | Abbreviation |
| Breast | 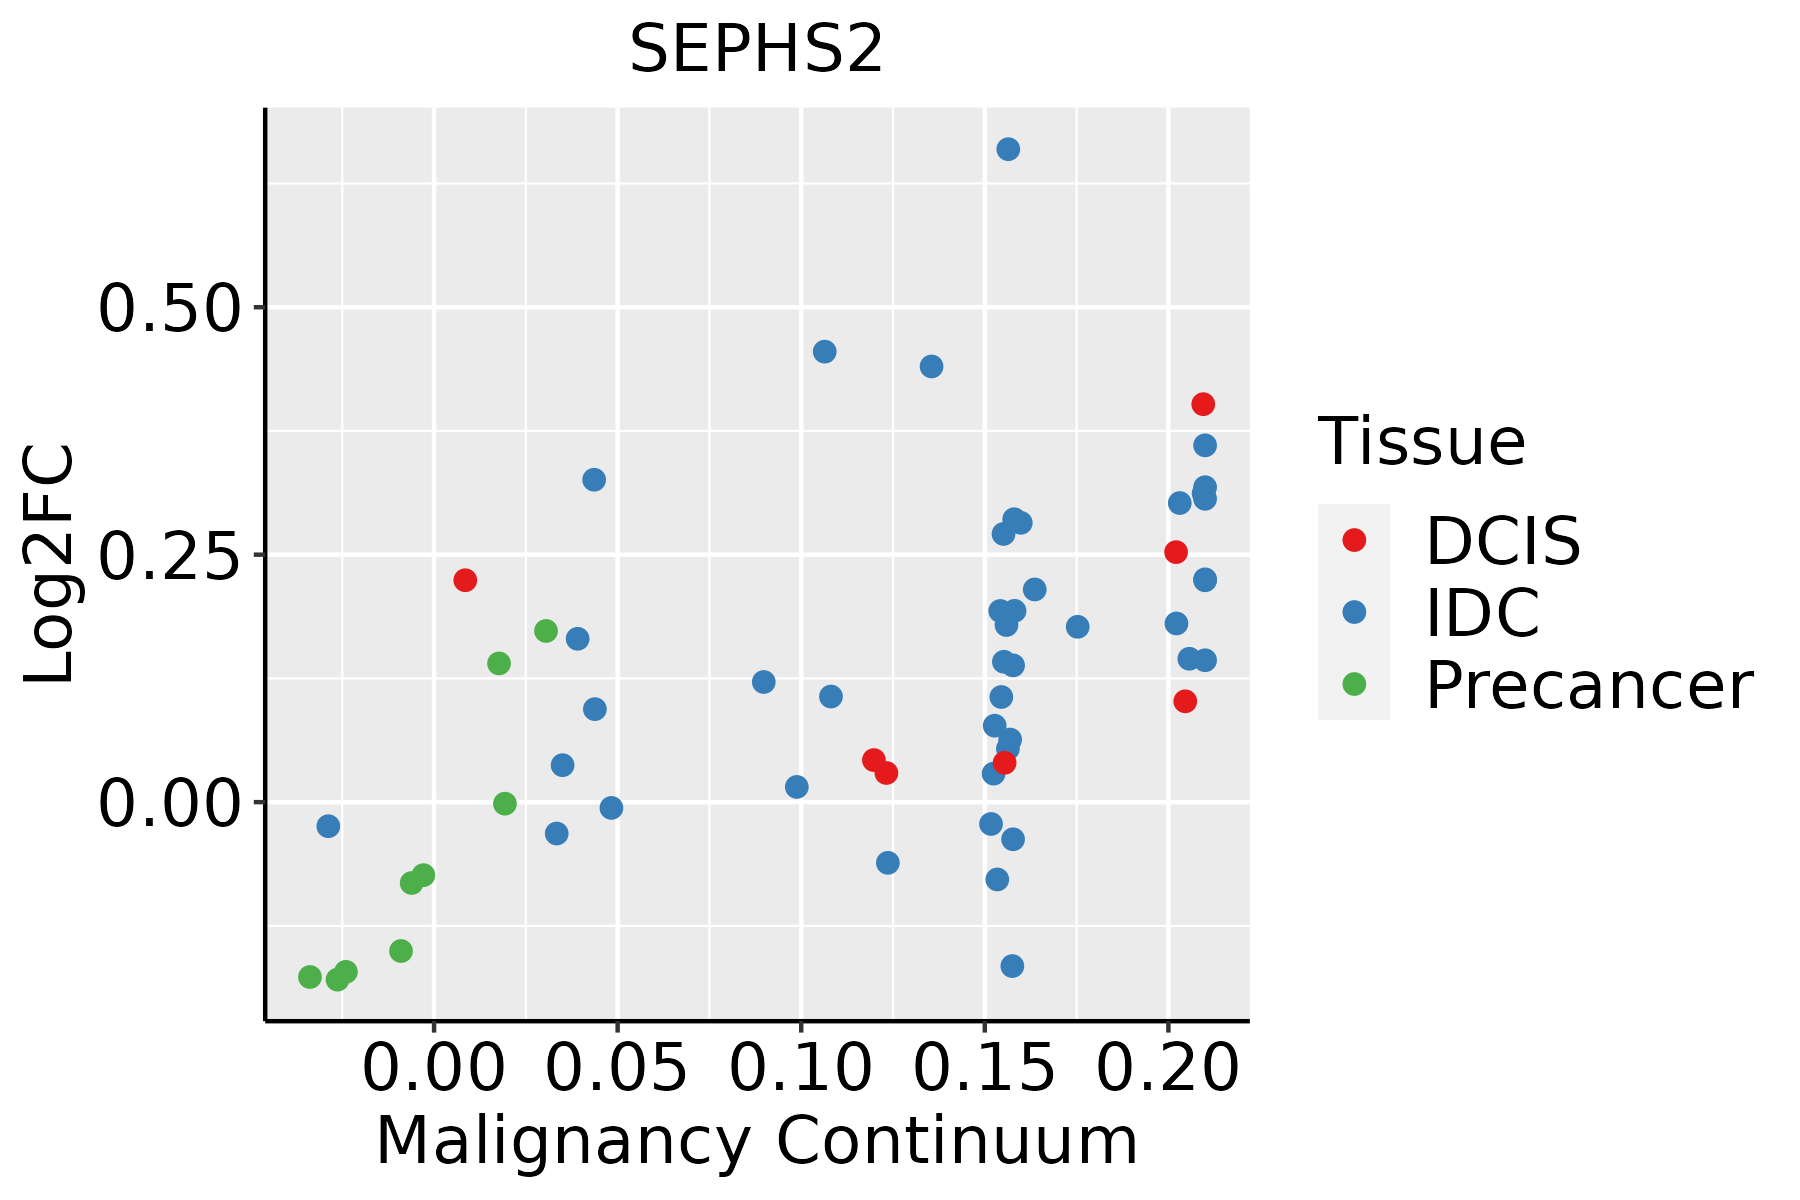 | IDC: Invasive ductal carcinoma |
| DCIS: Ductal carcinoma in situ | ||
| Precancer(BRCA1-mut): Precancerous lesion from BRCA1 mutation carriers | ||
| Colorectum (GSE201348) |  | FAP: Familial adenomatous polyposis |
| CRC: Colorectal cancer | ||
| Colorectum (HTA11) |  | AD: Adenomas |
| SER: Sessile serrated lesions | ||
| MSI-H: Microsatellite-high colorectal cancer | ||
| MSS: Microsatellite stable colorectal cancer | ||
| Esophagus | 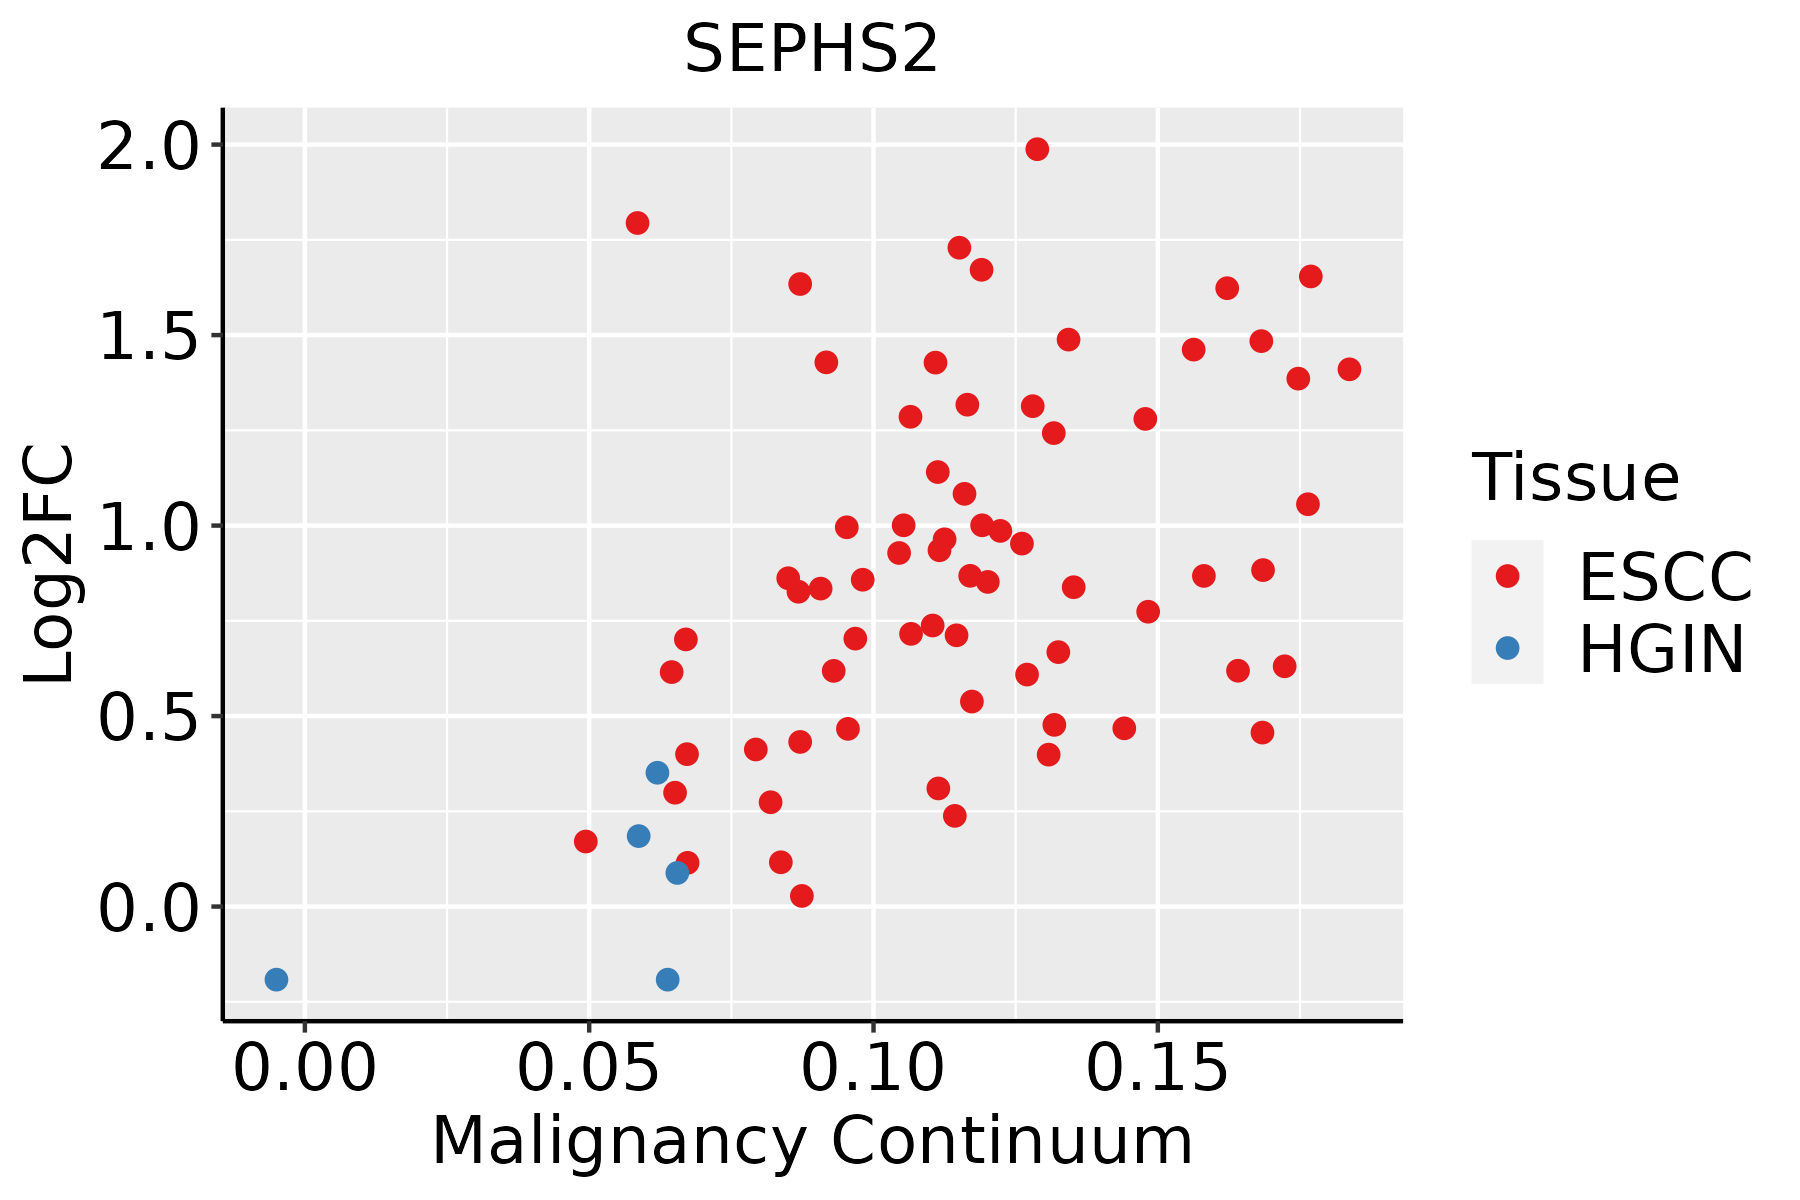 | ESCC: Esophageal squamous cell carcinoma |
| HGIN: High-grade intraepithelial neoplasias | ||
| LGIN: Low-grade intraepithelial neoplasias | ||
| Liver |  | HCC: Hepatocellular carcinoma |
| NAFLD: Non-alcoholic fatty liver disease | ||
| Skin |  | AK: Actinic keratosis |
| cSCC: Cutaneous squamous cell carcinoma | ||
| SCCIS:squamous cell carcinoma in situ |
| ∗log2FC in expression of this searched gene in stem-like cells from each diseased tissue sample relative to stem-like cells in normal samples in each tissue plotted against the malignancy continuum. Samples are colored based on if they are from different disease stage. |
Top |
Malignant transformation related pathway analysis |
| Find out the enriched GO biological processes and KEGG pathways involved in transition from healthy to precancer to cancer |
| Tissue | Disease Stage | Enriched GO biological Processes |
| Colorectum | AD |  |
| Colorectum | SER |  |
| Colorectum | MSS |  |
| Colorectum | MSI-H |  |
| Colorectum | FAP |  |
| ∗Top 15 enriched GO BP terms are showed in the bar plot of each disease state in each tissue. Each row represents a significant GO biological process which is colored according to the -log10(p.adjust). |
| Page: 1 2 3 4 5 6 7 8 9 |
| GO ID | Tissue | Disease Stage | Description | Gene Ratio | Bg Ratio | pvalue | p.adjust | Count |
| GO:00463946 | Breast | Precancer | carboxylic acid biosynthetic process | 32/1080 | 314/18723 | 1.30e-03 | 1.38e-02 | 32 |
| GO:00160536 | Breast | Precancer | organic acid biosynthetic process | 32/1080 | 316/18723 | 1.44e-03 | 1.50e-02 | 32 |
| GO:001605313 | Breast | IDC | organic acid biosynthetic process | 39/1434 | 316/18723 | 2.13e-03 | 1.99e-02 | 39 |
| GO:004639413 | Breast | IDC | carboxylic acid biosynthetic process | 38/1434 | 314/18723 | 3.39e-03 | 2.83e-02 | 38 |
| GO:001605322 | Breast | DCIS | organic acid biosynthetic process | 38/1390 | 316/18723 | 2.22e-03 | 2.04e-02 | 38 |
| GO:004639422 | Breast | DCIS | carboxylic acid biosynthetic process | 37/1390 | 314/18723 | 3.56e-03 | 2.92e-02 | 37 |
| GO:0006520 | Colorectum | AD | cellular amino acid metabolic process | 81/3918 | 284/18723 | 1.37e-03 | 1.19e-02 | 81 |
| GO:00065201 | Colorectum | SER | cellular amino acid metabolic process | 61/2897 | 284/18723 | 4.20e-03 | 3.41e-02 | 61 |
| GO:0046394 | Colorectum | MSS | carboxylic acid biosynthetic process | 76/3467 | 314/18723 | 6.71e-03 | 4.38e-02 | 76 |
| GO:0016053 | Colorectum | MSS | organic acid biosynthetic process | 76/3467 | 316/18723 | 7.88e-03 | 4.84e-02 | 76 |
| GO:00086525 | Esophagus | ESCC | cellular amino acid biosynthetic process | 51/8552 | 76/18723 | 1.30e-04 | 8.88e-04 | 51 |
| GO:00463948 | Esophagus | ESCC | carboxylic acid biosynthetic process | 175/8552 | 314/18723 | 1.98e-04 | 1.26e-03 | 175 |
| GO:00160538 | Esophagus | ESCC | organic acid biosynthetic process | 175/8552 | 316/18723 | 3.04e-04 | 1.82e-03 | 175 |
| GO:19016075 | Esophagus | ESCC | alpha-amino acid biosynthetic process | 45/8552 | 68/18723 | 5.13e-04 | 2.84e-03 | 45 |
| GO:00160535 | Liver | NAFLD | organic acid biosynthetic process | 77/1882 | 316/18723 | 1.03e-13 | 6.69e-11 | 77 |
| GO:00463945 | Liver | NAFLD | carboxylic acid biosynthetic process | 75/1882 | 314/18723 | 6.37e-13 | 3.39e-10 | 75 |
| GO:00065203 | Liver | NAFLD | cellular amino acid metabolic process | 63/1882 | 284/18723 | 1.14e-09 | 2.17e-07 | 63 |
| GO:00086523 | Liver | NAFLD | cellular amino acid biosynthetic process | 26/1882 | 76/18723 | 1.00e-08 | 1.33e-06 | 26 |
| GO:19016053 | Liver | NAFLD | alpha-amino acid metabolic process | 46/1882 | 195/18723 | 2.74e-08 | 2.86e-06 | 46 |
| GO:19016073 | Liver | NAFLD | alpha-amino acid biosynthetic process | 22/1882 | 68/18723 | 4.13e-07 | 2.62e-05 | 22 |
| Page: 1 2 |
| Pathway ID | Tissue | Disease Stage | Description | Gene Ratio | Bg Ratio | pvalue | p.adjust | qvalue | Count |
| Page: 1 |
Top |
Cell-cell communication analysis |
| Identification of potential cell-cell interactions between two cell types and their ligand-receptor pairs for different disease states |
| Ligand | Receptor | LRpair | Pathway | Tissue | Disease Stage |
| Page: 1 |
Top |
Single-cell gene regulatory network inference analysis |
| Find out the significant the regulons (TFs) and the target genes of each regulon across cell types for different disease states |
| TF | Cell Type | Tissue | Disease Stage | Target Gene | RSS | Regulon Activity |
| ∗The dot plots of a searched regulon are shown for all cell subpopulations in each disease state of each tissue based on the regulon specific score inferred using pySCENIC and by calculating the average expression. |
| Page: 1 |
Top |
Somatic mutation of malignant transformation related genes |
| Annotation of somatic variants for genes involved in malignant transformation |
| Hugo Symbol | Variant Class | Variant Classification | dbSNP RS | HGVSc | HGVSp | HGVSp Short | SWISSPROT | BIOTYPE | SIFT | PolyPhen | Tumor Sample Barcode | Tissue | Histology | Sex | Age | Stage | Therapy Types | Drugs | Outcome |
| SEPHS2 | SNV | Missense_Mutation | c.1210N>A | p.Val404Ile | p.V404I | Q99611 | protein_coding | tolerated(1) | benign(0.062) | TCGA-AN-A0FZ-01 | Breast | breast invasive carcinoma | Female | <65 | III/IV | Unknown | Unknown | SD | |
| SEPHS2 | SNV | Missense_Mutation | novel | c.549N>C | p.Met183Ile | p.M183I | Q99611 | protein_coding | deleterious(0.04) | possibly_damaging(0.734) | TCGA-PE-A5DE-01 | Breast | breast invasive carcinoma | Female | <65 | I/II | Chemotherapy | taxotere | CR |
| SEPHS2 | deletion | Frame_Shift_Del | novel | c.1307delC | p.Ala436ValfsTer? | p.A436Vfs*? | Q99611 | protein_coding | TCGA-EW-A2FV-01 | Breast | breast invasive carcinoma | Female | <65 | III/IV | Chemotherapy | docetaxel | SD | ||
| SEPHS2 | SNV | Missense_Mutation | c.730G>A | p.Val244Ile | p.V244I | Q99611 | protein_coding | tolerated(0.46) | benign(0.041) | TCGA-2W-A8YY-01 | Cervix | cervical & endocervical cancer | Female | <65 | I/II | Chemotherapy | cisplatin | CR | |
| SEPHS2 | SNV | Missense_Mutation | rs766949987 | c.565N>A | p.Glu189Lys | p.E189K | Q99611 | protein_coding | tolerated(0.08) | benign(0.01) | TCGA-DS-A0VL-01 | Cervix | cervical & endocervical cancer | Female | <65 | I/II | Unknown | Unknown | SD |
| SEPHS2 | SNV | Missense_Mutation | c.1052N>T | p.Ala351Val | p.A351V | Q99611 | protein_coding | tolerated(0.33) | benign(0.05) | TCGA-EK-A2R7-01 | Cervix | cervical & endocervical cancer | Female | <65 | I/II | Unknown | Unknown | SD | |
| SEPHS2 | SNV | Missense_Mutation | c.1036A>G | p.Ile346Val | p.I346V | Q99611 | protein_coding | tolerated(0.7) | benign(0.059) | TCGA-AA-3510-01 | Colorectum | colon adenocarcinoma | Male | >=65 | I/II | Unknown | Unknown | SD | |
| SEPHS2 | SNV | Missense_Mutation | c.1262G>A | p.Arg421Gln | p.R421Q | Q99611 | protein_coding | tolerated(0.1) | benign(0.048) | TCGA-AA-3977-01 | Colorectum | colon adenocarcinoma | Male | >=65 | I/II | Unknown | Unknown | SD | |
| SEPHS2 | SNV | Missense_Mutation | c.1240N>A | p.Ala414Thr | p.A414T | Q99611 | protein_coding | deleterious(0) | probably_damaging(0.993) | TCGA-AA-A00N-01 | Colorectum | colon adenocarcinoma | Male | >=65 | I/II | Unknown | Unknown | PD | |
| SEPHS2 | SNV | Missense_Mutation | c.708N>A | p.Phe236Leu | p.F236L | Q99611 | protein_coding | tolerated(0.16) | benign(0.034) | TCGA-AA-A00N-01 | Colorectum | colon adenocarcinoma | Male | >=65 | I/II | Unknown | Unknown | PD |
| Page: 1 2 3 4 |
Top |
Related drugs of malignant transformation related genes |
| Identification of chemicals and drugs interact with genes involved in malignant transfromation |
| (DGIdb 4.0) |
| Entrez ID | Symbol | Category | Interaction Types | Drug Claim Name | Drug Name | PMIDs |
| Page: 1 |

Copyright 2023-Present -The University of Texas Health Science Center at Houston |