
|
|||||
|
 | |
| |
| |
| |
| |
| |
|
Gene: SEPHS1 |
Gene summary for SEPHS1 |
| Gene information | Species | Human | Gene symbol | SEPHS1 | Gene ID | 22929 |
| Gene name | selenophosphate synthetase 1 | |
| Gene Alias | SELD | |
| Cytomap | 10p13 | |
| Gene Type | protein-coding | GO ID | GO:0006082 | UniProtAcc | P49903 |
Top |
Malignant transformation analysis |
| Identification of the aberrant gene expression in precancerous and cancerous lesions by comparing the gene expression of stem-like cells in diseased tissues with normal stem cells |
| Entrez ID | Symbol | Replicates | Species | Organ | Tissue | Adj P-value | Log2FC | Malignancy |
| 22929 | SEPHS1 | LZE4T | Human | Esophagus | ESCC | 8.79e-04 | 9.99e-02 | 0.0811 |
| 22929 | SEPHS1 | LZE8T | Human | Esophagus | ESCC | 2.55e-03 | 1.05e-01 | 0.067 |
| 22929 | SEPHS1 | LZE24T | Human | Esophagus | ESCC | 1.22e-12 | 2.48e-01 | 0.0596 |
| 22929 | SEPHS1 | LZE6T | Human | Esophagus | ESCC | 4.00e-03 | 2.19e-01 | 0.0845 |
| 22929 | SEPHS1 | P2T-E | Human | Esophagus | ESCC | 1.26e-21 | 4.18e-01 | 0.1177 |
| 22929 | SEPHS1 | P4T-E | Human | Esophagus | ESCC | 1.21e-19 | 4.40e-01 | 0.1323 |
| 22929 | SEPHS1 | P5T-E | Human | Esophagus | ESCC | 1.02e-17 | 3.54e-01 | 0.1327 |
| 22929 | SEPHS1 | P8T-E | Human | Esophagus | ESCC | 2.06e-16 | 2.72e-01 | 0.0889 |
| 22929 | SEPHS1 | P9T-E | Human | Esophagus | ESCC | 2.71e-03 | 5.25e-02 | 0.1131 |
| 22929 | SEPHS1 | P10T-E | Human | Esophagus | ESCC | 4.80e-13 | 2.73e-01 | 0.116 |
| 22929 | SEPHS1 | P11T-E | Human | Esophagus | ESCC | 3.66e-04 | 2.18e-01 | 0.1426 |
| 22929 | SEPHS1 | P12T-E | Human | Esophagus | ESCC | 1.20e-15 | 2.97e-01 | 0.1122 |
| 22929 | SEPHS1 | P15T-E | Human | Esophagus | ESCC | 4.21e-15 | 3.81e-01 | 0.1149 |
| 22929 | SEPHS1 | P16T-E | Human | Esophagus | ESCC | 3.37e-24 | 3.61e-01 | 0.1153 |
| 22929 | SEPHS1 | P17T-E | Human | Esophagus | ESCC | 8.15e-08 | 2.96e-01 | 0.1278 |
| 22929 | SEPHS1 | P20T-E | Human | Esophagus | ESCC | 8.71e-10 | 1.34e-01 | 0.1124 |
| 22929 | SEPHS1 | P21T-E | Human | Esophagus | ESCC | 7.62e-23 | 4.15e-01 | 0.1617 |
| 22929 | SEPHS1 | P22T-E | Human | Esophagus | ESCC | 2.15e-09 | 1.19e-01 | 0.1236 |
| 22929 | SEPHS1 | P23T-E | Human | Esophagus | ESCC | 5.35e-14 | 1.52e-01 | 0.108 |
| 22929 | SEPHS1 | P24T-E | Human | Esophagus | ESCC | 8.25e-12 | 2.70e-01 | 0.1287 |
| Page: 1 2 3 4 5 |
| Tissue | Expression Dynamics | Abbreviation |
| Esophagus |  | ESCC: Esophageal squamous cell carcinoma |
| HGIN: High-grade intraepithelial neoplasias | ||
| LGIN: Low-grade intraepithelial neoplasias | ||
| Liver |  | HCC: Hepatocellular carcinoma |
| NAFLD: Non-alcoholic fatty liver disease | ||
| Oral Cavity | 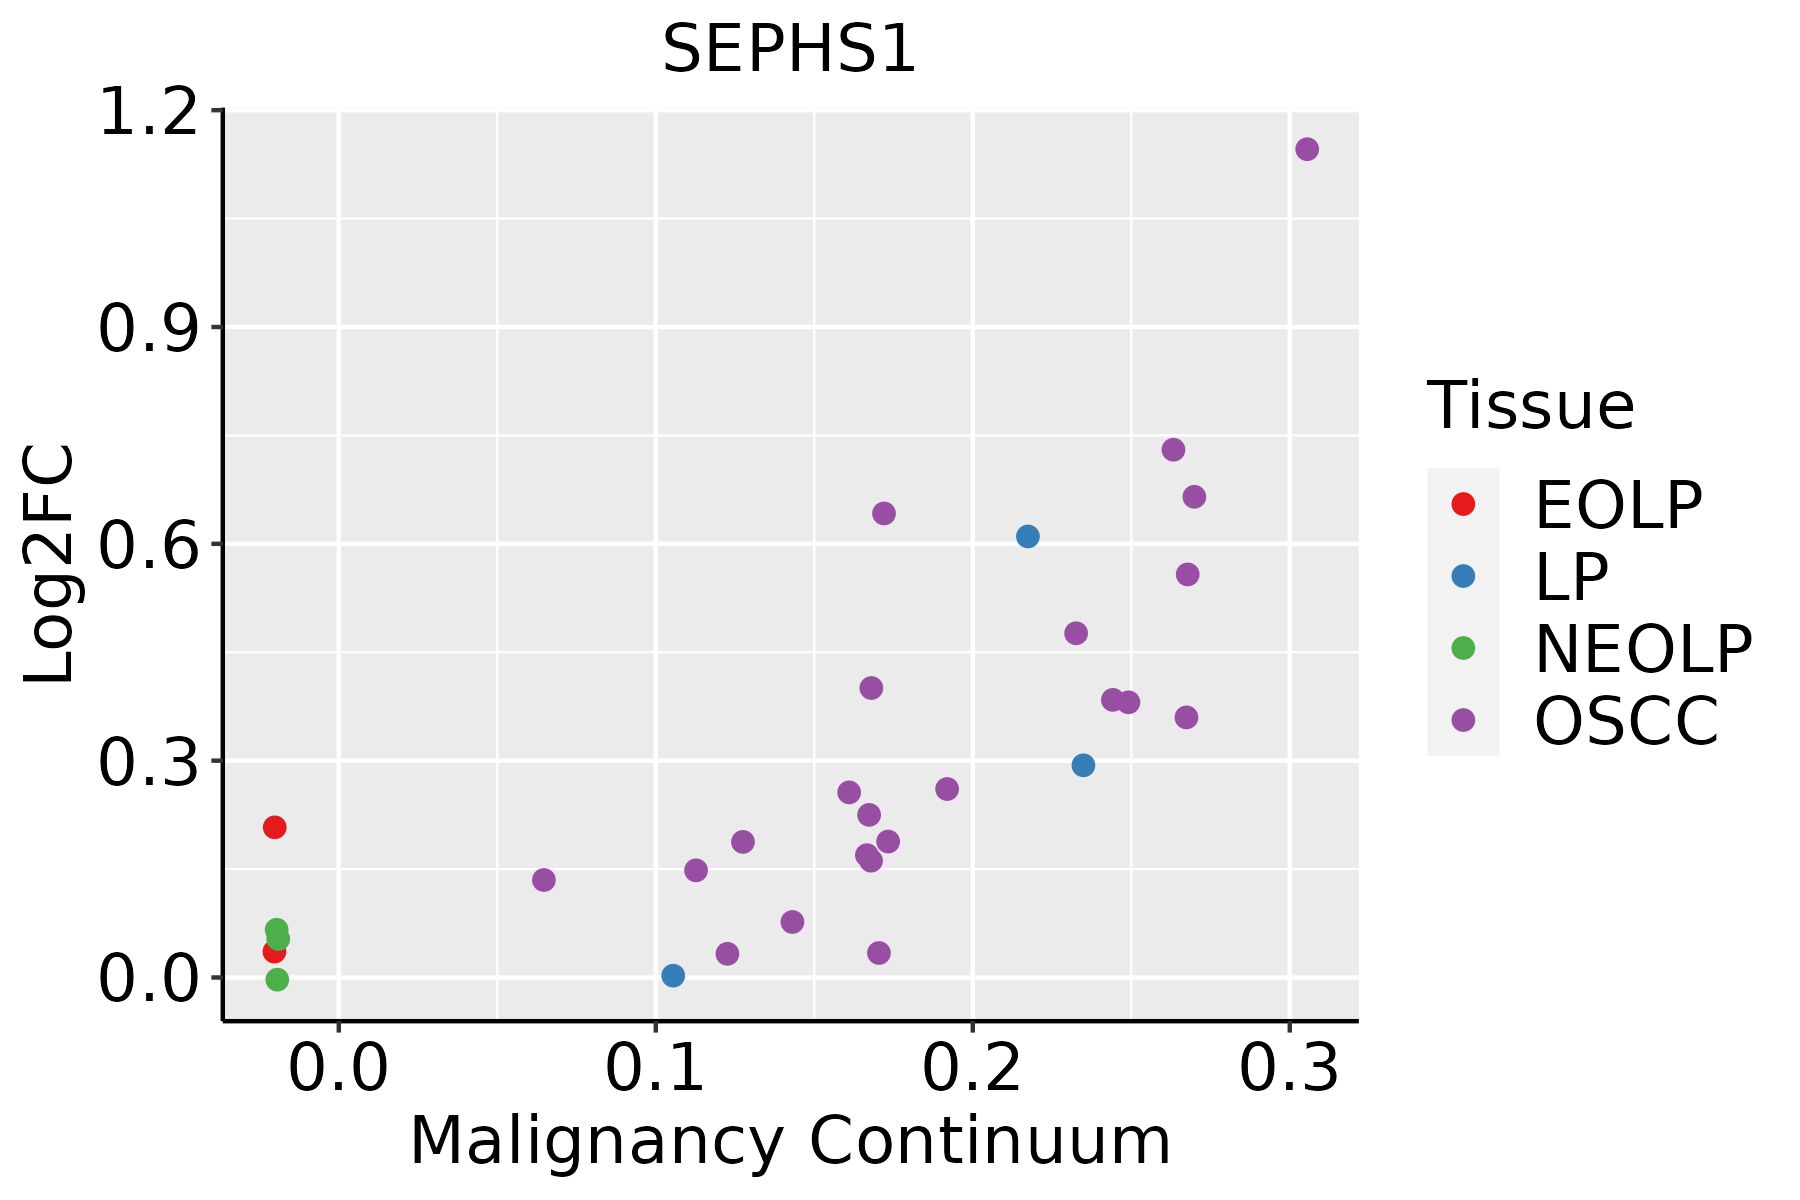 | EOLP: Erosive Oral lichen planus |
| LP: leukoplakia | ||
| NEOLP: Non-erosive oral lichen planus | ||
| OSCC: Oral squamous cell carcinoma | ||
| Skin | 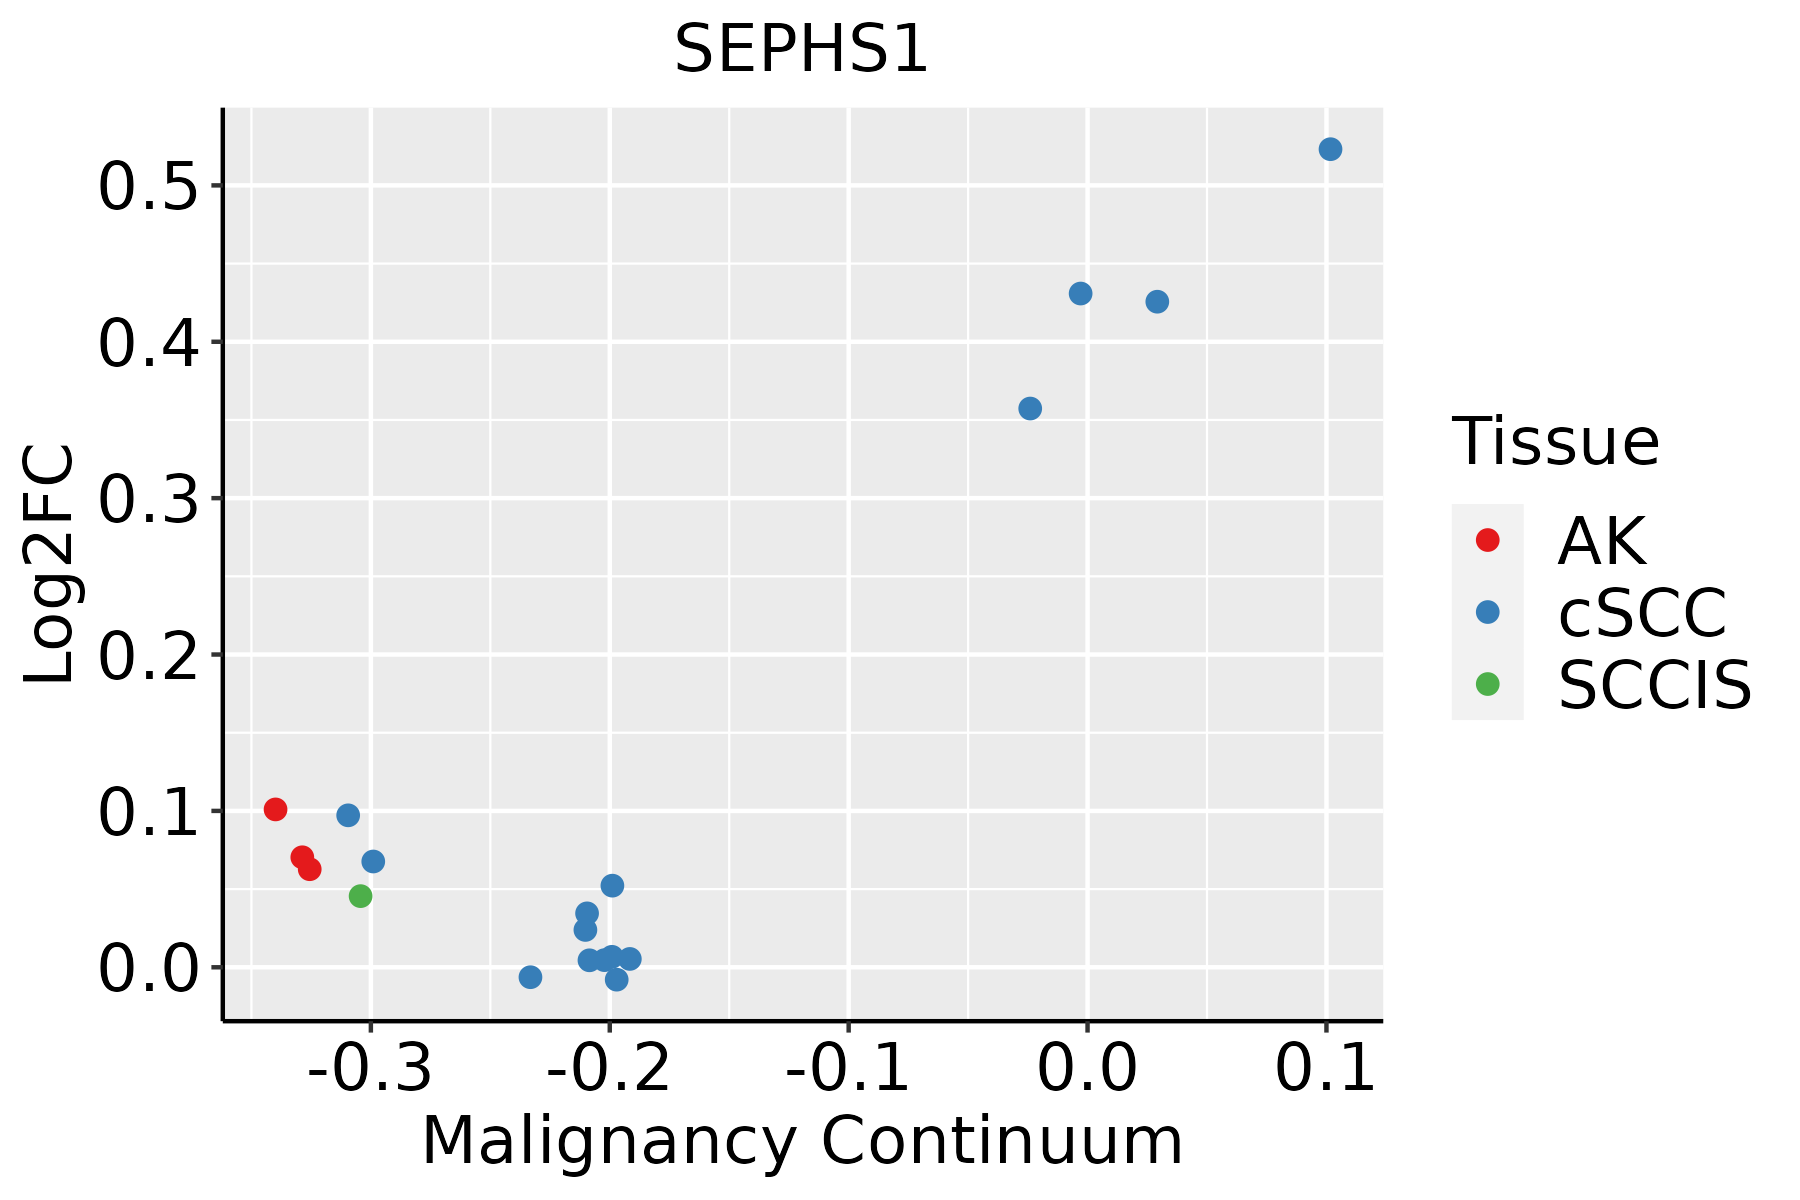 | AK: Actinic keratosis |
| cSCC: Cutaneous squamous cell carcinoma | ||
| SCCIS:squamous cell carcinoma in situ |
| ∗log2FC in expression of this searched gene in stem-like cells from each diseased tissue sample relative to stem-like cells in normal samples in each tissue plotted against the malignancy continuum. Samples are colored based on if they are from different disease stage. |
Top |
Malignant transformation related pathway analysis |
| Find out the enriched GO biological processes and KEGG pathways involved in transition from healthy to precancer to cancer |
| Tissue | Disease Stage | Enriched GO biological Processes |
| Colorectum | AD |  |
| Colorectum | SER |  |
| Colorectum | MSS |  |
| Colorectum | MSI-H |  |
| Colorectum | FAP |  |
| ∗Top 15 enriched GO BP terms are showed in the bar plot of each disease state in each tissue. Each row represents a significant GO biological process which is colored according to the -log10(p.adjust). |
| Page: 1 2 3 4 5 6 7 8 9 |
| GO ID | Tissue | Disease Stage | Description | Gene Ratio | Bg Ratio | pvalue | p.adjust | Count |
| GO:00086525 | Esophagus | ESCC | cellular amino acid biosynthetic process | 51/8552 | 76/18723 | 1.30e-04 | 8.88e-04 | 51 |
| GO:00463948 | Esophagus | ESCC | carboxylic acid biosynthetic process | 175/8552 | 314/18723 | 1.98e-04 | 1.26e-03 | 175 |
| GO:00160538 | Esophagus | ESCC | organic acid biosynthetic process | 175/8552 | 316/18723 | 3.04e-04 | 1.82e-03 | 175 |
| GO:19016075 | Esophagus | ESCC | alpha-amino acid biosynthetic process | 45/8552 | 68/18723 | 5.13e-04 | 2.84e-03 | 45 |
| GO:001605321 | Liver | HCC | organic acid biosynthetic process | 200/7958 | 316/18723 | 5.24e-14 | 3.22e-12 | 200 |
| GO:004639421 | Liver | HCC | carboxylic acid biosynthetic process | 198/7958 | 314/18723 | 1.19e-13 | 6.78e-12 | 198 |
| GO:00086522 | Liver | HCC | cellular amino acid biosynthetic process | 58/7958 | 76/18723 | 1.98e-09 | 5.63e-08 | 58 |
| GO:19016052 | Liver | HCC | alpha-amino acid metabolic process | 124/7958 | 195/18723 | 2.07e-09 | 5.79e-08 | 124 |
| GO:19016072 | Liver | HCC | alpha-amino acid biosynthetic process | 53/7958 | 68/18723 | 2.62e-09 | 7.16e-08 | 53 |
| GO:00065202 | Liver | HCC | cellular amino acid metabolic process | 167/7958 | 284/18723 | 1.91e-08 | 4.56e-07 | 167 |
| GO:00090692 | Liver | HCC | serine family amino acid metabolic process | 29/7958 | 40/18723 | 1.17e-04 | 9.87e-04 | 29 |
| GO:00160537 | Oral cavity | OSCC | organic acid biosynthetic process | 155/7305 | 316/18723 | 1.64e-04 | 1.13e-03 | 155 |
| GO:00463947 | Oral cavity | OSCC | carboxylic acid biosynthetic process | 154/7305 | 314/18723 | 1.73e-04 | 1.19e-03 | 154 |
| GO:00086524 | Oral cavity | OSCC | cellular amino acid biosynthetic process | 42/7305 | 76/18723 | 2.93e-03 | 1.27e-02 | 42 |
| GO:19016074 | Oral cavity | OSCC | alpha-amino acid biosynthetic process | 37/7305 | 68/18723 | 7.09e-03 | 2.63e-02 | 37 |
| GO:190160711 | Oral cavity | LP | alpha-amino acid biosynthetic process | 28/4623 | 68/18723 | 2.01e-03 | 1.49e-02 | 28 |
| GO:000865211 | Oral cavity | LP | cellular amino acid biosynthetic process | 30/4623 | 76/18723 | 3.07e-03 | 2.09e-02 | 30 |
| GO:19016076 | Skin | cSCC | alpha-amino acid biosynthetic process | 30/4864 | 68/18723 | 8.91e-04 | 6.10e-03 | 30 |
| GO:00086526 | Skin | cSCC | cellular amino acid biosynthetic process | 30/4864 | 76/18723 | 6.79e-03 | 3.29e-02 | 30 |
| Page: 1 |
| Pathway ID | Tissue | Disease Stage | Description | Gene Ratio | Bg Ratio | pvalue | p.adjust | qvalue | Count |
| Page: 1 |
Top |
Cell-cell communication analysis |
| Identification of potential cell-cell interactions between two cell types and their ligand-receptor pairs for different disease states |
| Ligand | Receptor | LRpair | Pathway | Tissue | Disease Stage |
| Page: 1 |
Top |
Single-cell gene regulatory network inference analysis |
| Find out the significant the regulons (TFs) and the target genes of each regulon across cell types for different disease states |
| TF | Cell Type | Tissue | Disease Stage | Target Gene | RSS | Regulon Activity |
| ∗The dot plots of a searched regulon are shown for all cell subpopulations in each disease state of each tissue based on the regulon specific score inferred using pySCENIC and by calculating the average expression. |
| Page: 1 |
Top |
Somatic mutation of malignant transformation related genes |
| Annotation of somatic variants for genes involved in malignant transformation |
| Hugo Symbol | Variant Class | Variant Classification | dbSNP RS | HGVSc | HGVSp | HGVSp Short | SWISSPROT | BIOTYPE | SIFT | PolyPhen | Tumor Sample Barcode | Tissue | Histology | Sex | Age | Stage | Therapy Types | Drugs | Outcome |
| SEPHS1 | SNV | Missense_Mutation | c.17C>G | p.Ser6Cys | p.S6C | P49903 | protein_coding | tolerated(0.05) | possibly_damaging(0.706) | TCGA-AC-A23H-01 | Breast | breast invasive carcinoma | Female | >=65 | I/II | Unknown | Unknown | PD | |
| SEPHS1 | SNV | Missense_Mutation | c.86N>T | p.Thr29Ile | p.T29I | P49903 | protein_coding | tolerated(0.09) | benign(0.045) | TCGA-BH-A0B3-01 | Breast | breast invasive carcinoma | Female | <65 | I/II | Chemotherapy | cyclophosphamide | SD | |
| SEPHS1 | SNV | Missense_Mutation | novel | c.400G>A | p.Asp134Asn | p.D134N | P49903 | protein_coding | deleterious(0.02) | benign(0.025) | TCGA-2W-A8YY-01 | Cervix | cervical & endocervical cancer | Female | <65 | I/II | Chemotherapy | cisplatin | CR |
| SEPHS1 | SNV | Missense_Mutation | c.13N>A | p.Glu5Lys | p.E5K | P49903 | protein_coding | tolerated(1) | benign(0) | TCGA-DS-A0VK-01 | Cervix | cervical & endocervical cancer | Female | <65 | I/II | Chemotherapy | carboplatin | PD | |
| SEPHS1 | SNV | Missense_Mutation | c.734C>T | p.Ala245Val | p.A245V | P49903 | protein_coding | deleterious(0.01) | benign(0.3) | TCGA-VS-A94Z-01 | Cervix | cervical & endocervical cancer | Female | <65 | I/II | Chemotherapy | cisplatin | CR | |
| SEPHS1 | SNV | Missense_Mutation | c.1112G>A | p.Arg371Gln | p.R371Q | P49903 | protein_coding | tolerated(0.11) | benign(0.012) | TCGA-AA-A01S-01 | Colorectum | colon adenocarcinoma | Female | <65 | III/IV | Unknown | Unknown | SD | |
| SEPHS1 | SNV | Missense_Mutation | c.953C>T | p.Pro318Leu | p.P318L | P49903 | protein_coding | deleterious(0.02) | possibly_damaging(0.873) | TCGA-AZ-4308-01 | Colorectum | colon adenocarcinoma | Female | <65 | III/IV | Targeted Molecular therapy | avastin | CR | |
| SEPHS1 | SNV | Missense_Mutation | novel | c.89G>A | p.Gly30Asp | p.G30D | P49903 | protein_coding | deleterious(0) | probably_damaging(0.918) | TCGA-AZ-4315-01 | Colorectum | colon adenocarcinoma | Male | <65 | I/II | Unknown | Unknown | SD |
| SEPHS1 | SNV | Missense_Mutation | c.221N>A | p.Pro74His | p.P74H | P49903 | protein_coding | deleterious(0) | probably_damaging(0.994) | TCGA-CM-5861-01 | Colorectum | colon adenocarcinoma | Female | <65 | I/II | Unknown | Unknown | PD | |
| SEPHS1 | SNV | Missense_Mutation | c.1085N>A | p.Arg362His | p.R362H | P49903 | protein_coding | deleterious(0.02) | benign(0.124) | TCGA-CM-6171-01 | Colorectum | colon adenocarcinoma | Female | >=65 | I/II | Unknown | Unknown | SD |
| Page: 1 2 3 4 5 |
Top |
Related drugs of malignant transformation related genes |
| Identification of chemicals and drugs interact with genes involved in malignant transfromation |
| (DGIdb 4.0) |
| Entrez ID | Symbol | Category | Interaction Types | Drug Claim Name | Drug Name | PMIDs |
| Page: 1 |

Copyright 2023-Present -The University of Texas Health Science Center at Houston |