| Tissue | Expression Dynamics | Abbreviation |
| Cervix | 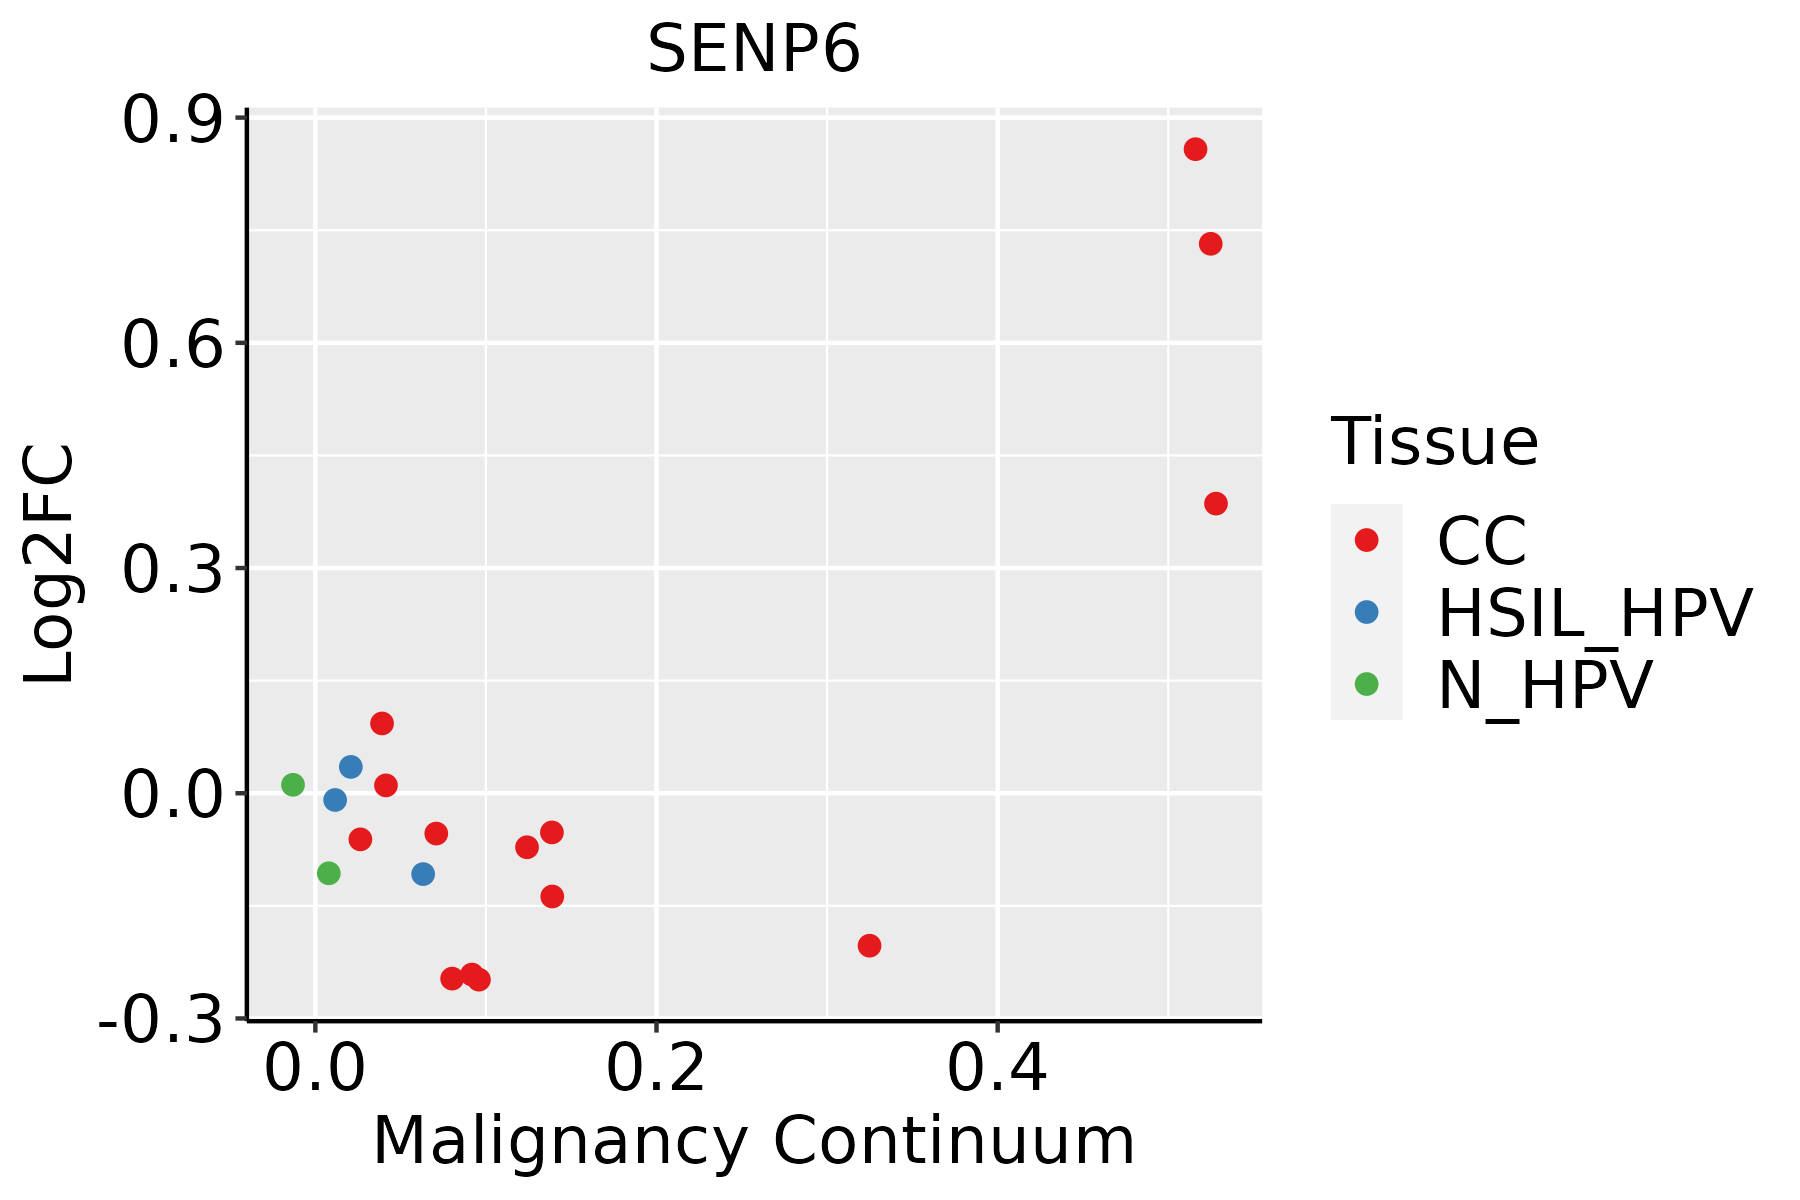 | CC: Cervix cancer |
| HSIL_HPV: HPV-infected high-grade squamous intraepithelial lesions |
| N_HPV: HPV-infected normal cervix |
| Colorectum (GSE201348) |  | FAP: Familial adenomatous polyposis |
| CRC: Colorectal cancer |
| Colorectum (HTA11) | 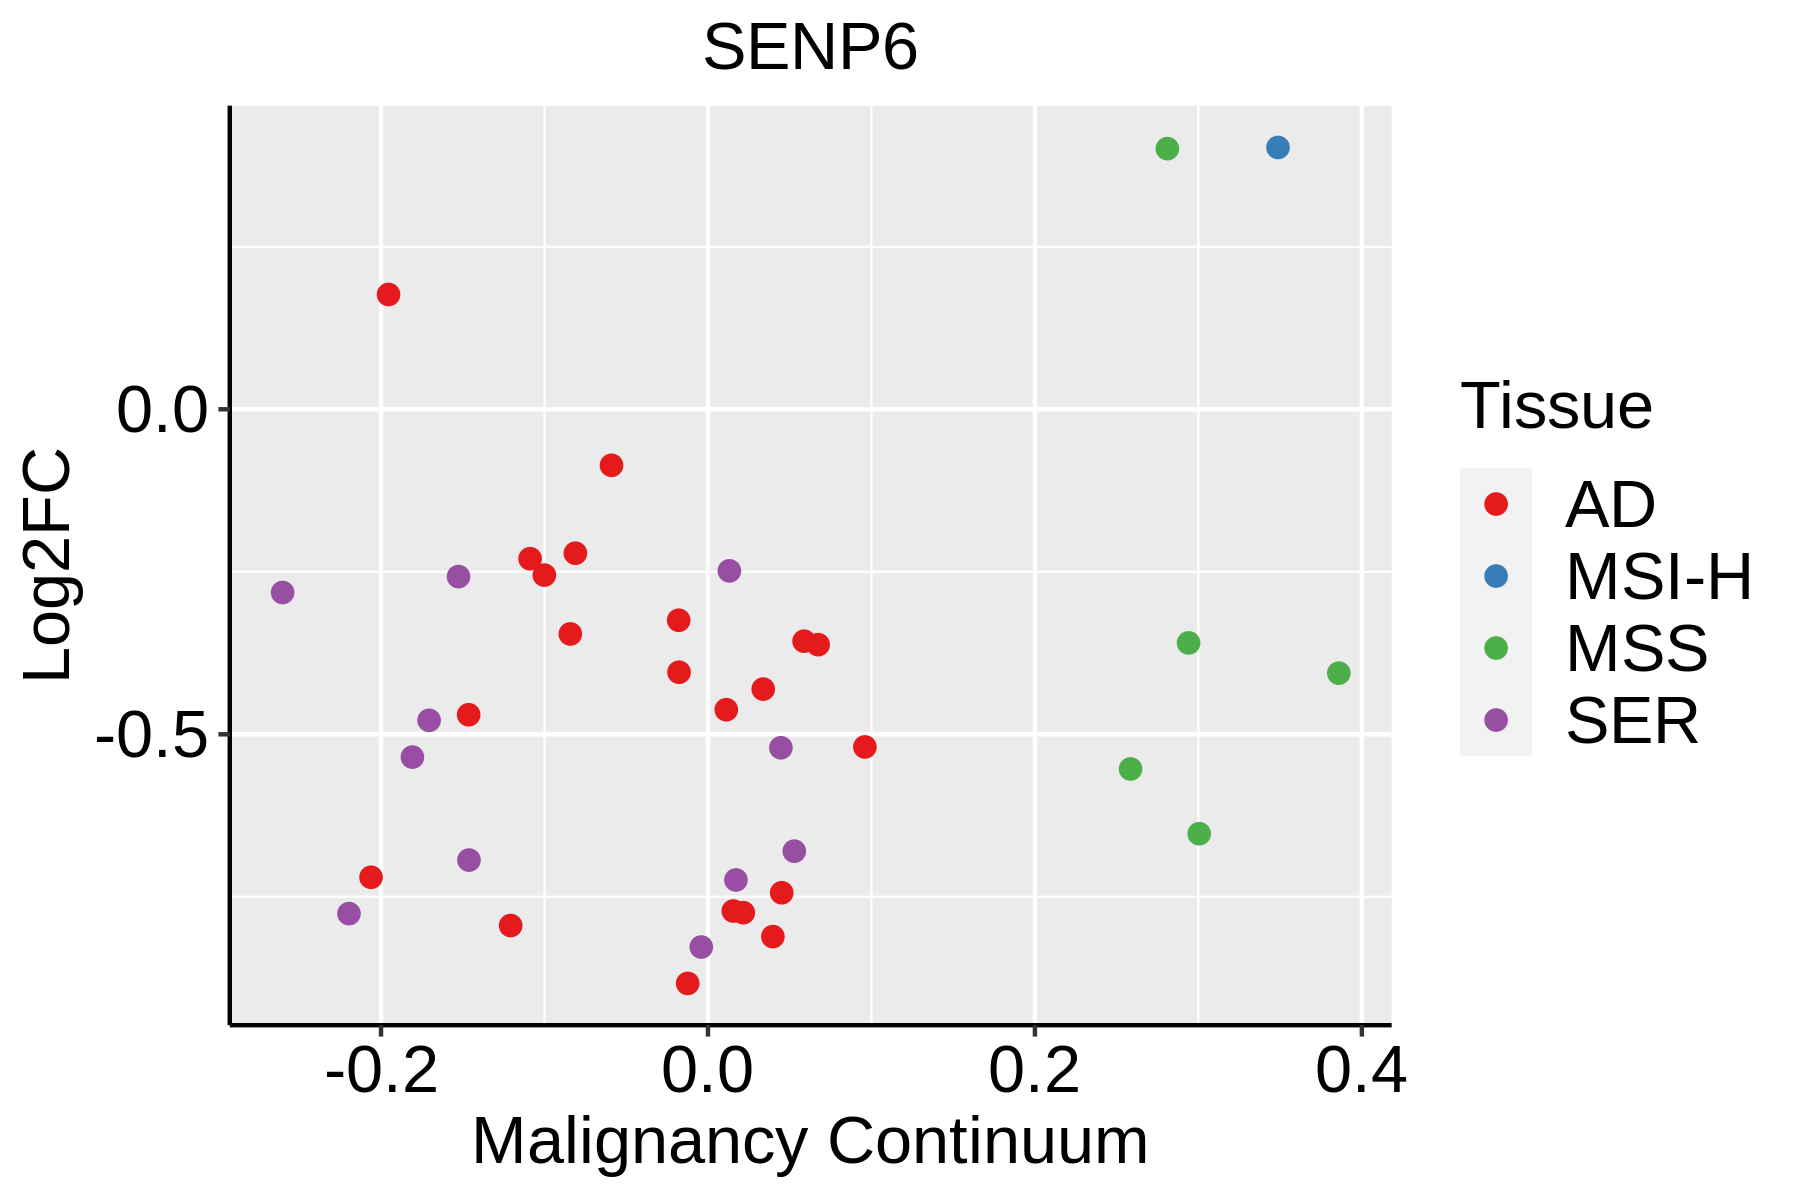 | AD: Adenomas |
| SER: Sessile serrated lesions |
| MSI-H: Microsatellite-high colorectal cancer |
| MSS: Microsatellite stable colorectal cancer |
| Esophagus | 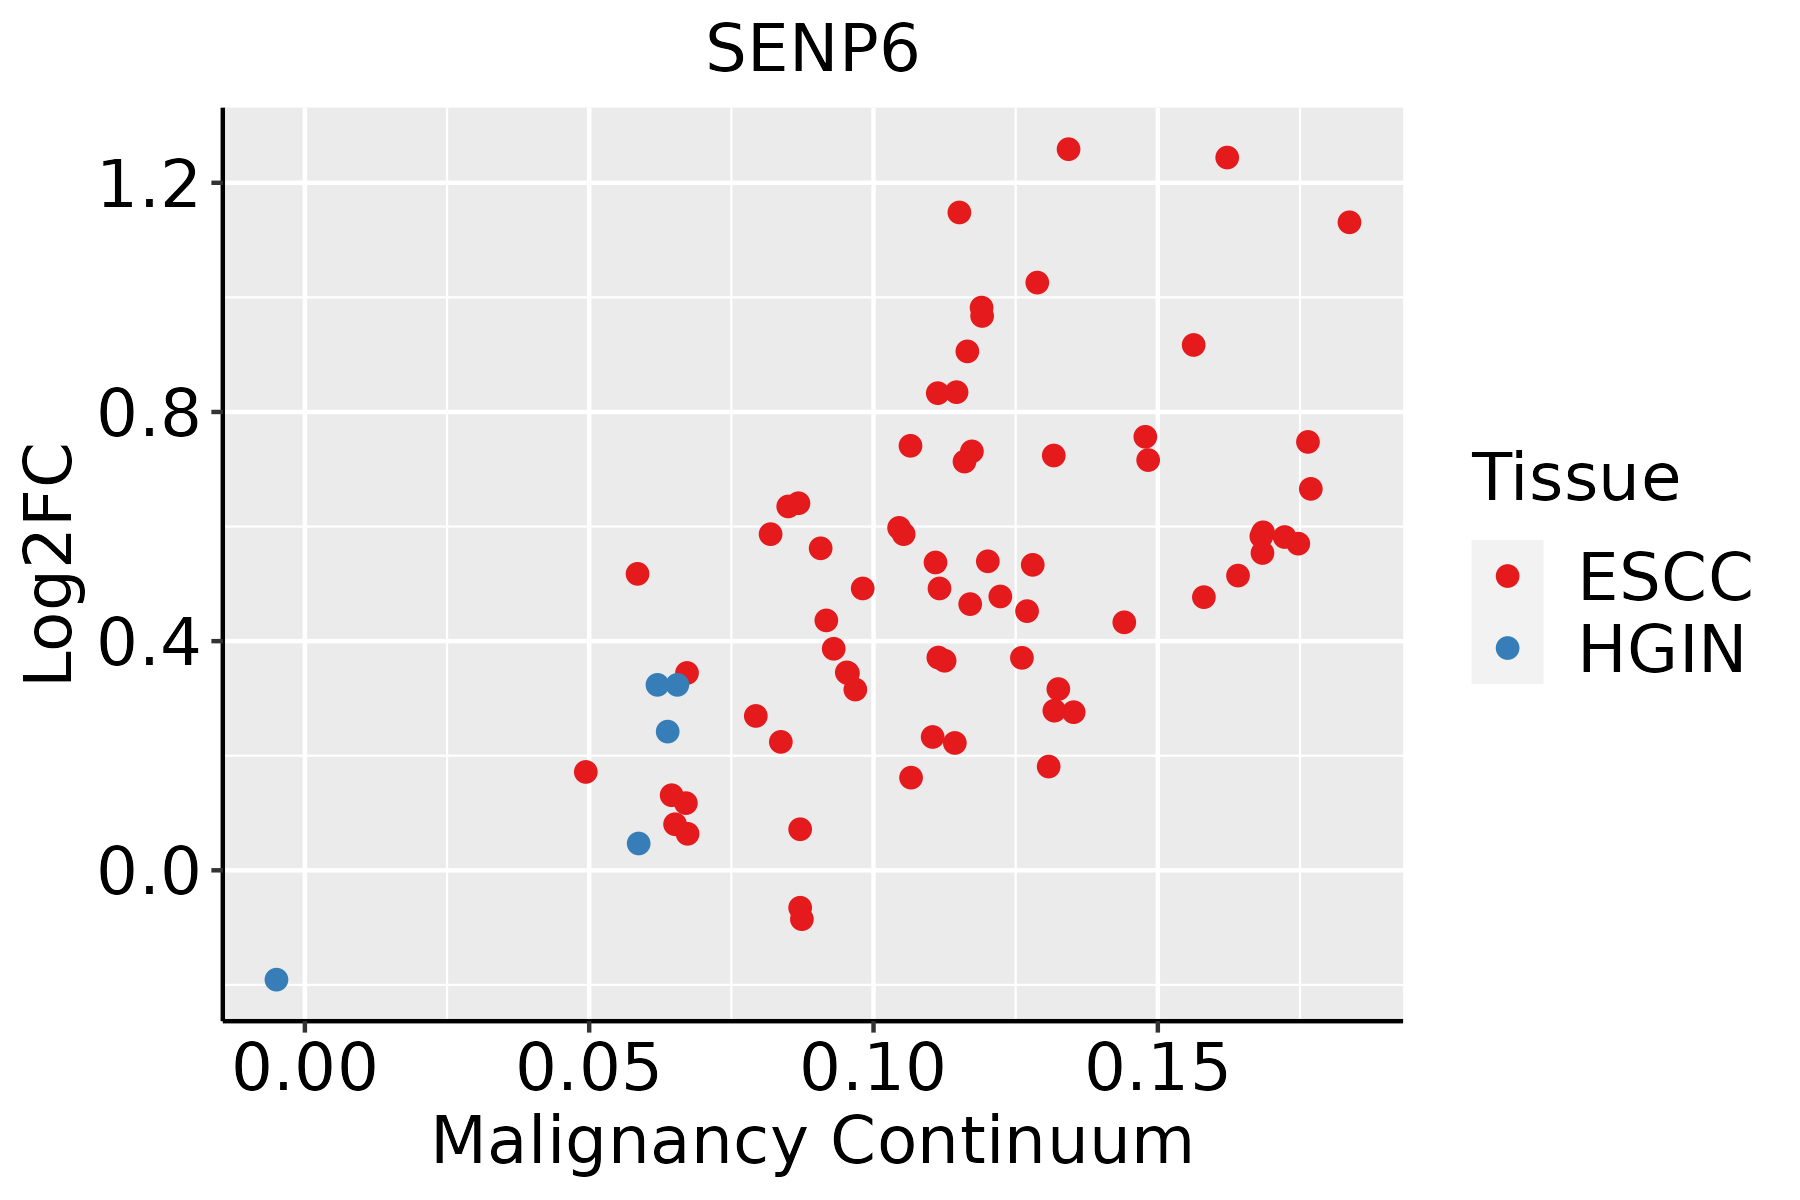 | ESCC: Esophageal squamous cell carcinoma |
| HGIN: High-grade intraepithelial neoplasias |
| LGIN: Low-grade intraepithelial neoplasias |
| Liver |  | HCC: Hepatocellular carcinoma |
| NAFLD: Non-alcoholic fatty liver disease |
| Lung | 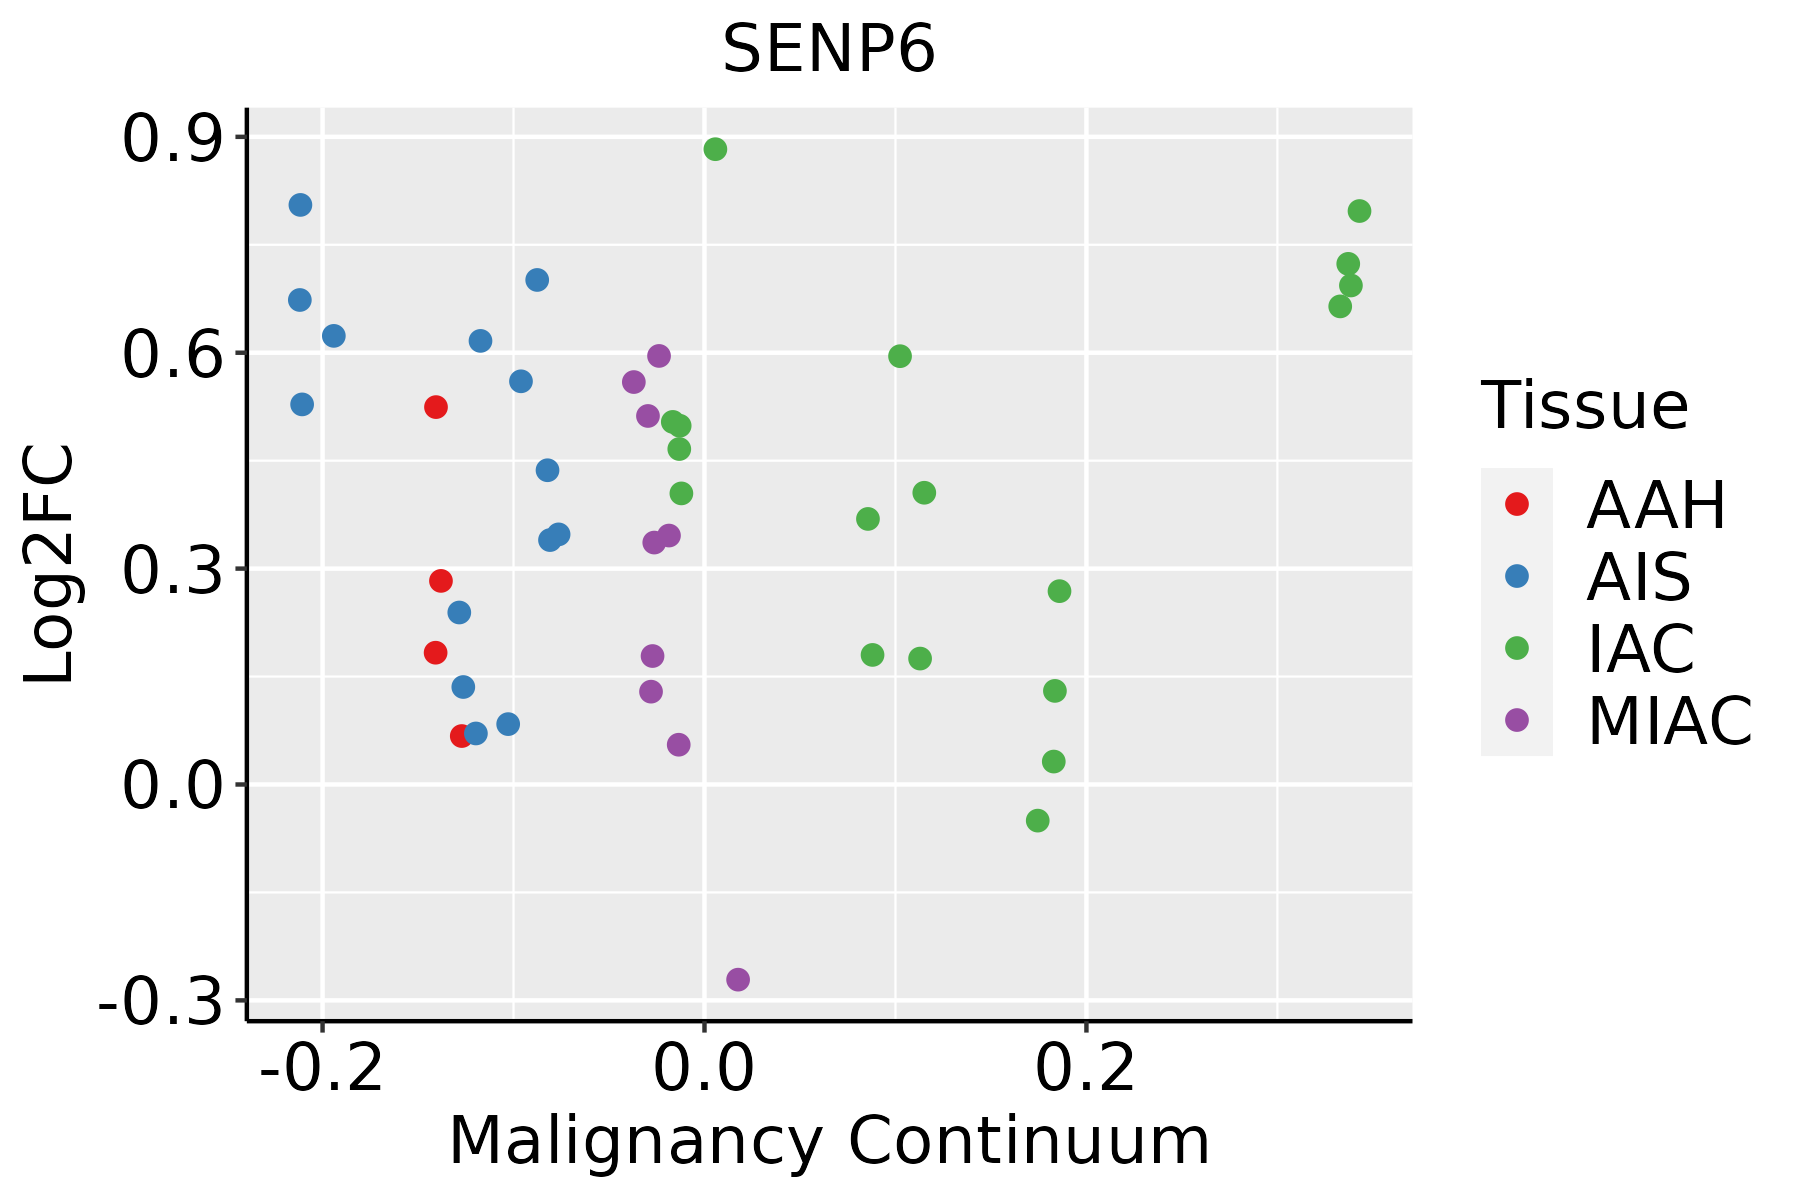 | AAH: Atypical adenomatous hyperplasia |
| AIS: Adenocarcinoma in situ |
| IAC: Invasive lung adenocarcinoma |
| MIA: Minimally invasive adenocarcinoma |
| Oral Cavity |  | EOLP: Erosive Oral lichen planus |
| LP: leukoplakia |
| NEOLP: Non-erosive oral lichen planus |
| OSCC: Oral squamous cell carcinoma |
| Prostate |  | BPH: Benign Prostatic Hyperplasia |
| Skin |  | AK: Actinic keratosis |
| cSCC: Cutaneous squamous cell carcinoma |
| SCCIS:squamous cell carcinoma in situ |
| Thyroid |  | ATC: Anaplastic thyroid cancer |
| HT: Hashimoto's thyroiditis |
| PTC: Papillary thyroid cancer |
| GO ID | Tissue | Disease Stage | Description | Gene Ratio | Bg Ratio | pvalue | p.adjust | Count |
| GO:004325410 | Cervix | CC | regulation of protein-containing complex assembly | 96/2311 | 428/18723 | 2.91e-09 | 3.05e-07 | 96 |
| GO:19021153 | Cervix | CC | regulation of organelle assembly | 40/2311 | 186/18723 | 2.92e-04 | 3.15e-03 | 40 |
| GO:00705074 | Cervix | CC | regulation of microtubule cytoskeleton organization | 32/2311 | 148/18723 | 1.02e-03 | 8.51e-03 | 32 |
| GO:00182054 | Cervix | CC | peptidyl-lysine modification | 62/2311 | 376/18723 | 1.04e-02 | 4.97e-02 | 62 |
| GO:0043254 | Colorectum | AD | regulation of protein-containing complex assembly | 148/3918 | 428/18723 | 2.64e-11 | 3.18e-09 | 148 |
| GO:0033044 | Colorectum | AD | regulation of chromosome organization | 60/3918 | 187/18723 | 2.25e-04 | 2.94e-03 | 60 |
| GO:0007051 | Colorectum | AD | spindle organization | 58/3918 | 184/18723 | 4.71e-04 | 5.20e-03 | 58 |
| GO:0051225 | Colorectum | AD | spindle assembly | 37/3918 | 117/18723 | 4.32e-03 | 2.96e-02 | 37 |
| GO:0070507 | Colorectum | AD | regulation of microtubule cytoskeleton organization | 44/3918 | 148/18723 | 7.05e-03 | 4.31e-02 | 44 |
| GO:0090169 | Colorectum | AD | regulation of spindle assembly | 11/3918 | 25/18723 | 7.89e-03 | 4.73e-02 | 11 |
| GO:00432541 | Colorectum | SER | regulation of protein-containing complex assembly | 119/2897 | 428/18723 | 3.34e-11 | 5.86e-09 | 119 |
| GO:00901691 | Colorectum | SER | regulation of spindle assembly | 10/2897 | 25/18723 | 2.70e-03 | 2.44e-02 | 10 |
| GO:0090224 | Colorectum | SER | regulation of spindle organization | 13/2897 | 39/18723 | 4.39e-03 | 3.51e-02 | 13 |
| GO:00432542 | Colorectum | MSS | regulation of protein-containing complex assembly | 130/3467 | 428/18723 | 1.38e-09 | 1.03e-07 | 130 |
| GO:00330441 | Colorectum | MSS | regulation of chromosome organization | 55/3467 | 187/18723 | 1.86e-04 | 2.63e-03 | 55 |
| GO:00070511 | Colorectum | MSS | spindle organization | 53/3467 | 184/18723 | 4.23e-04 | 5.19e-03 | 53 |
| GO:00512251 | Colorectum | MSS | spindle assembly | 33/3467 | 117/18723 | 6.68e-03 | 4.38e-02 | 33 |
| GO:00432544 | Colorectum | FAP | regulation of protein-containing complex assembly | 101/2622 | 428/18723 | 5.18e-08 | 4.07e-06 | 101 |
| GO:00330442 | Colorectum | FAP | regulation of chromosome organization | 46/2622 | 187/18723 | 7.41e-05 | 1.36e-03 | 46 |
| GO:00070512 | Colorectum | FAP | spindle organization | 41/2622 | 184/18723 | 1.50e-03 | 1.34e-02 | 41 |
| Hugo Symbol | Variant Class | Variant Classification | dbSNP RS | HGVSc | HGVSp | HGVSp Short | SWISSPROT | BIOTYPE | SIFT | PolyPhen | Tumor Sample Barcode | Tissue | Histology | Sex | Age | Stage | Therapy Types | Drugs | Outcome |
| SENP6 | SNV | Missense_Mutation | | c.1471C>G | p.Leu491Val | p.L491V | Q9GZR1 | protein_coding | deleterious(0) | probably_damaging(0.996) | TCGA-A2-A0YH-01 | Breast | breast invasive carcinoma | Female | <65 | III/IV | Chemotherapy | adriamycin | SD |
| SENP6 | SNV | Missense_Mutation | rs550031341 | c.1316N>T | p.Ser439Phe | p.S439F | Q9GZR1 | protein_coding | deleterious(0.01) | possibly_damaging(0.45) | TCGA-AC-A2B8-01 | Breast | breast invasive carcinoma | Female | >=65 | I/II | Chemotherapy | chemo | PD |
| SENP6 | SNV | Missense_Mutation | novel | c.3139C>T | p.Leu1047Phe | p.L1047F | Q9GZR1 | protein_coding | tolerated(0.13) | benign(0.051) | TCGA-AN-A046-01 | Breast | breast invasive carcinoma | Female | >=65 | I/II | Unknown | Unknown | SD |
| SENP6 | SNV | Missense_Mutation | novel | c.1543N>G | p.Gln515Glu | p.Q515E | Q9GZR1 | protein_coding | tolerated(0.3) | benign(0.003) | TCGA-BH-A0B6-01 | Breast | breast invasive carcinoma | Female | <65 | I/II | Unknown | Unknown | SD |
| SENP6 | insertion | Frame_Shift_Ins | novel | c.2597_2598insAGCTGGAATGCTGTGGCACAATCTCGGCTCACTGCAACCTCTGCCTC | p.His866GlnfsTer50 | p.H866Qfs*50 | Q9GZR1 | protein_coding | | | TCGA-A8-A07R-01 | Breast | breast invasive carcinoma | Female | >=65 | III/IV | Ancillary | zoledronic | SD |
| SENP6 | insertion | In_Frame_Ins | novel | c.2667_2668insTATGTTATT | p.Lys889_Ser890insTyrValIle | p.K889_S890insYVI | Q9GZR1 | protein_coding | | | TCGA-AR-A0U2-01 | Breast | breast invasive carcinoma | Female | <65 | III/IV | Hormone Therapy | tamoxiphen | PD |
| SENP6 | SNV | Missense_Mutation | | c.1126N>A | p.Glu376Lys | p.E376K | Q9GZR1 | protein_coding | tolerated(0.09) | possibly_damaging(0.544) | TCGA-C5-A901-01 | Cervix | cervical & endocervical cancer | Female | <65 | I/II | Unknown | Unknown | SD |
| SENP6 | SNV | Missense_Mutation | | c.1276N>G | p.Gln426Glu | p.Q426E | Q9GZR1 | protein_coding | tolerated(0.08) | benign(0.08) | TCGA-DS-A0VM-01 | Cervix | cervical & endocervical cancer | Female | <65 | I/II | Chemotherapy | cisplatin | PD |
| SENP6 | SNV | Missense_Mutation | novel | c.1355N>G | p.Val452Gly | p.V452G | Q9GZR1 | protein_coding | deleterious(0) | possibly_damaging(0.791) | TCGA-MA-AA43-01 | Cervix | cervical & endocervical cancer | Female | <65 | III/IV | Unknown | Unknown | SD |
| SENP6 | SNV | Missense_Mutation | novel | c.2254G>C | p.Glu752Gln | p.E752Q | Q9GZR1 | protein_coding | tolerated(0.91) | benign(0.241) | TCGA-VS-A9U6-01 | Cervix | cervical & endocervical cancer | Female | <65 | I/II | Chemotherapy | cisplatin | PD |
| Entrez ID | Symbol | Category | Interaction Types | Drug Claim Name | Drug Name | PMIDs |
| 26054 | SENP6 | ENZYME, PROTEASE, DRUGGABLE GENOME | | GNF-PF-1702 | CHEMBL600313 | |
| 26054 | SENP6 | ENZYME, PROTEASE, DRUGGABLE GENOME | | CID 4101591 | CHEMBL428789 | |
| 26054 | SENP6 | ENZYME, PROTEASE, DRUGGABLE GENOME | | DNDI1417156 | CHEMBL1504679 | |
| 26054 | SENP6 | ENZYME, PROTEASE, DRUGGABLE GENOME | | DIHYDROXANTHOHUMOL | DIHYDROXANTHOHUMOL | |
| 26054 | SENP6 | ENZYME, PROTEASE, DRUGGABLE GENOME | | IPRIFLAVONE | IPRIFLAVONE | |
| 26054 | SENP6 | ENZYME, PROTEASE, DRUGGABLE GENOME | | XANTHOANGELOL B | XANTHOANGELOL B | |
| 26054 | SENP6 | ENZYME, PROTEASE, DRUGGABLE GENOME | | 4-PHENYLAMINO-[1,2]NAPHTHOQUINONE | CHEMBL299853 | |
| 26054 | SENP6 | ENZYME, PROTEASE, DRUGGABLE GENOME | | 6,4'-DIHYDROXYFLAVONE | CHEMBL484663 | |
| 26054 | SENP6 | ENZYME, PROTEASE, DRUGGABLE GENOME | | 2-(4-NITROBENZYLSULFANYL)BENZOXAZOLE | CHEMBL412603 | |
| 26054 | SENP6 | ENZYME, PROTEASE, DRUGGABLE GENOME | | BAS-0338868 | CHEMBL378903 | |


