| Tissue | Expression Dynamics | Abbreviation |
| Cervix | 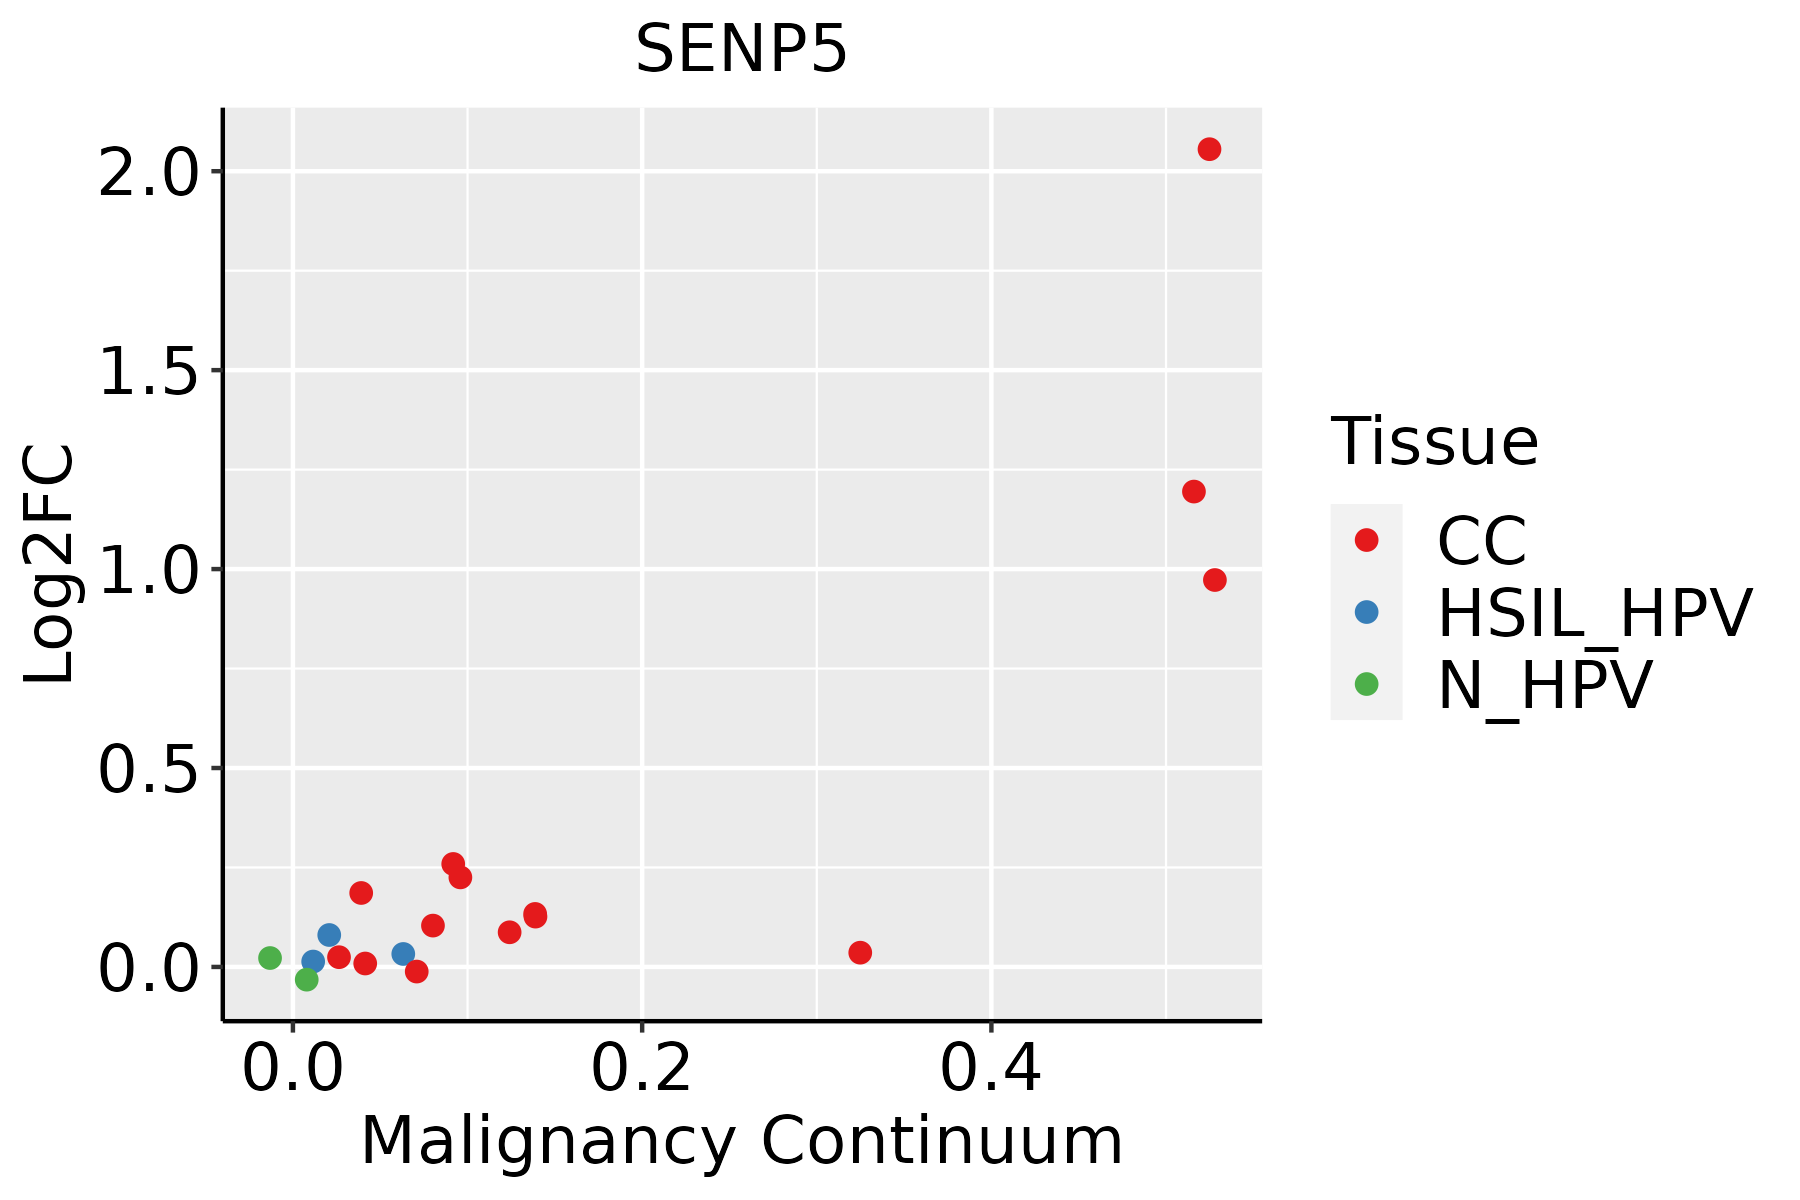 | CC: Cervix cancer |
| HSIL_HPV: HPV-infected high-grade squamous intraepithelial lesions |
| N_HPV: HPV-infected normal cervix |
| Esophagus |  | ESCC: Esophageal squamous cell carcinoma |
| HGIN: High-grade intraepithelial neoplasias |
| LGIN: Low-grade intraepithelial neoplasias |
| Liver | 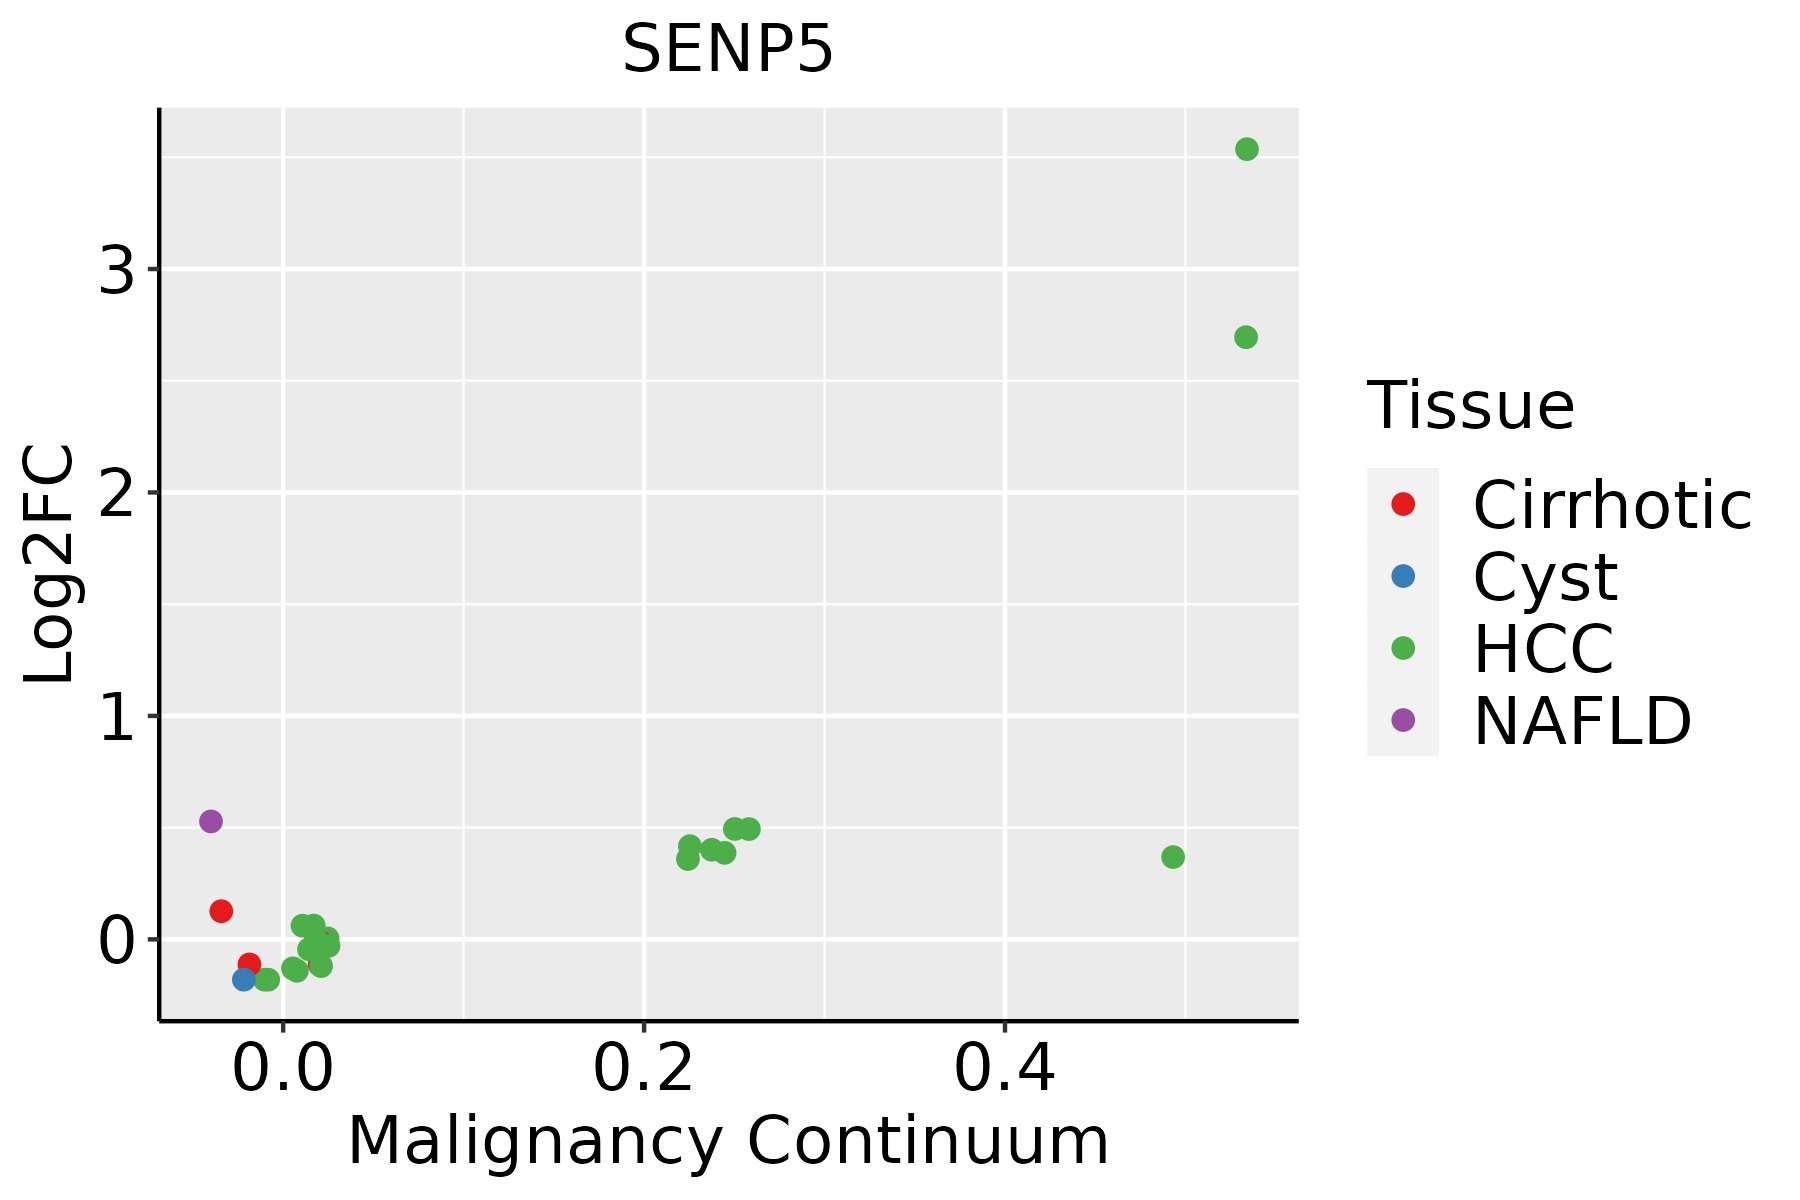 | HCC: Hepatocellular carcinoma |
| NAFLD: Non-alcoholic fatty liver disease |
| Oral Cavity | 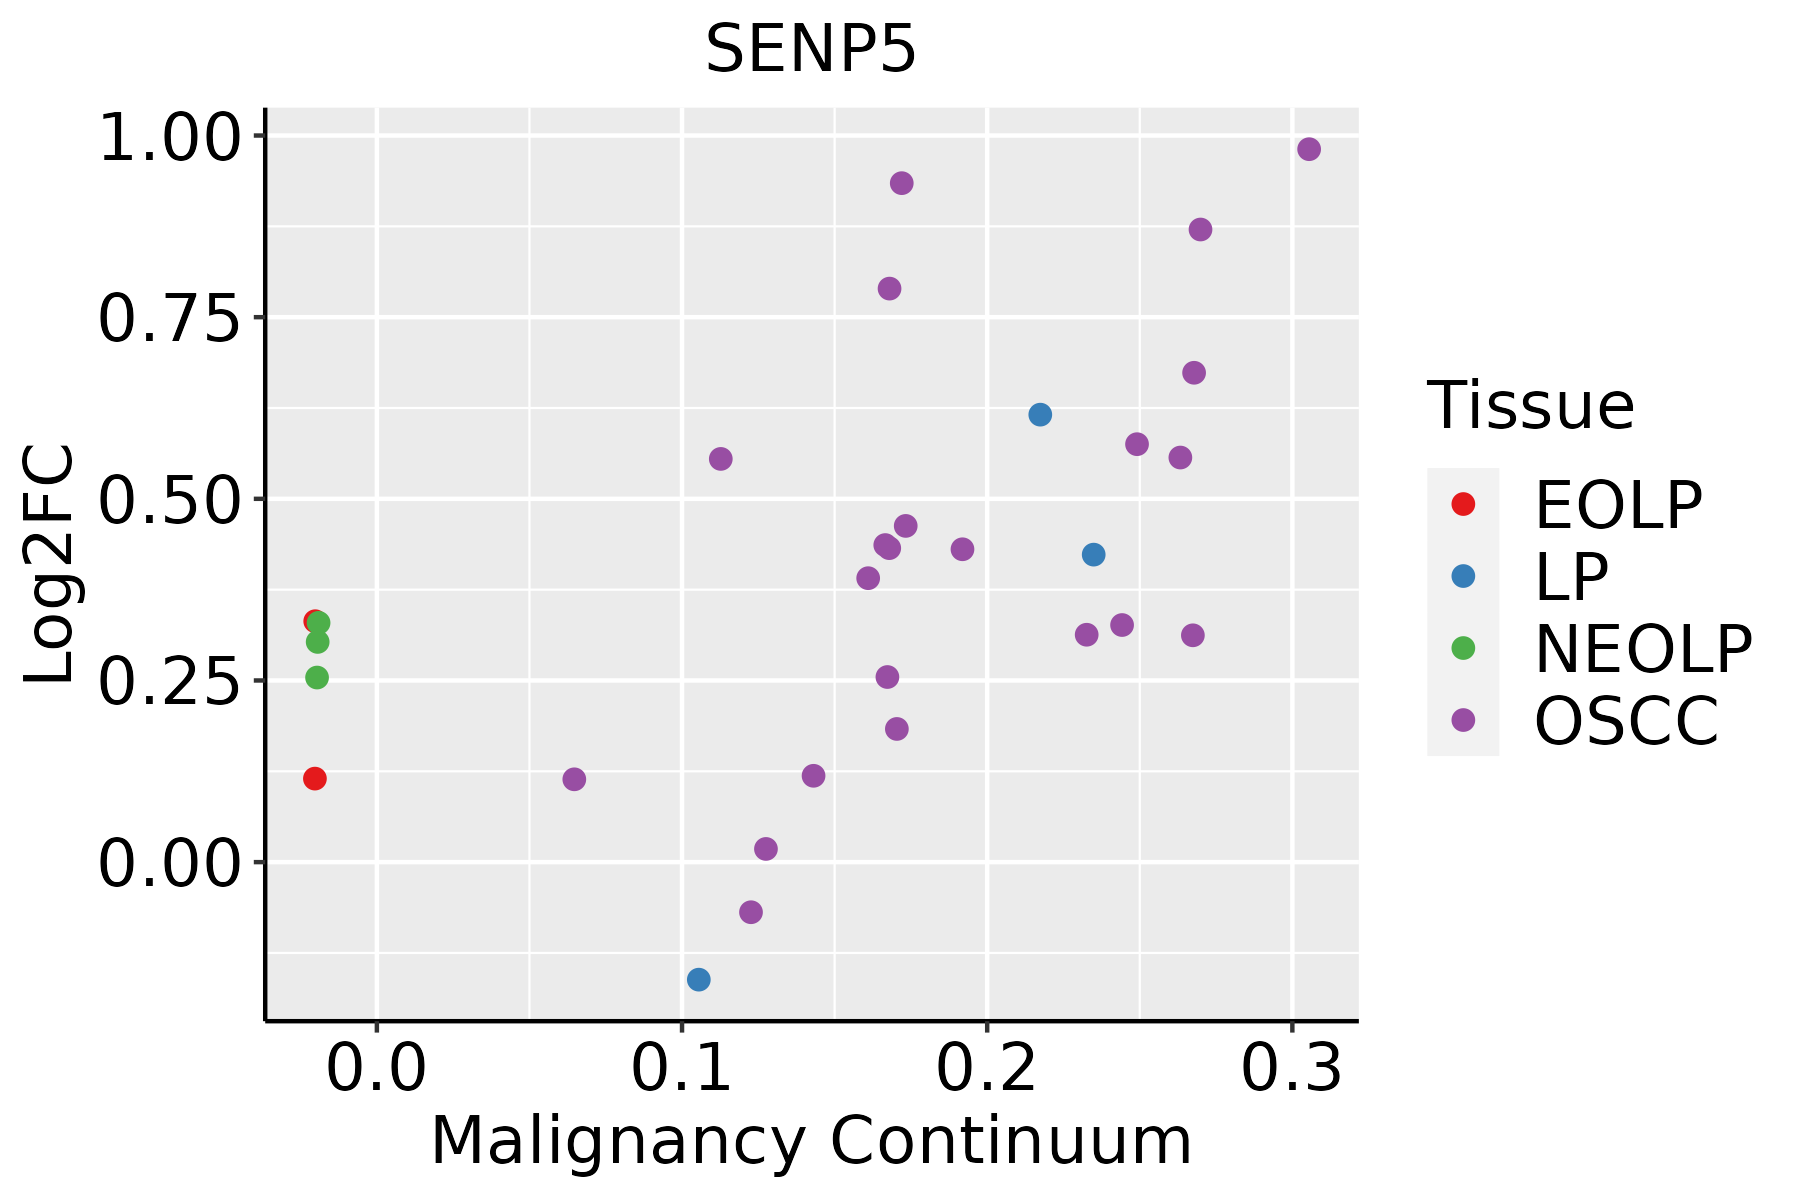 | EOLP: Erosive Oral lichen planus |
| LP: leukoplakia |
| NEOLP: Non-erosive oral lichen planus |
| OSCC: Oral squamous cell carcinoma |
| Skin | 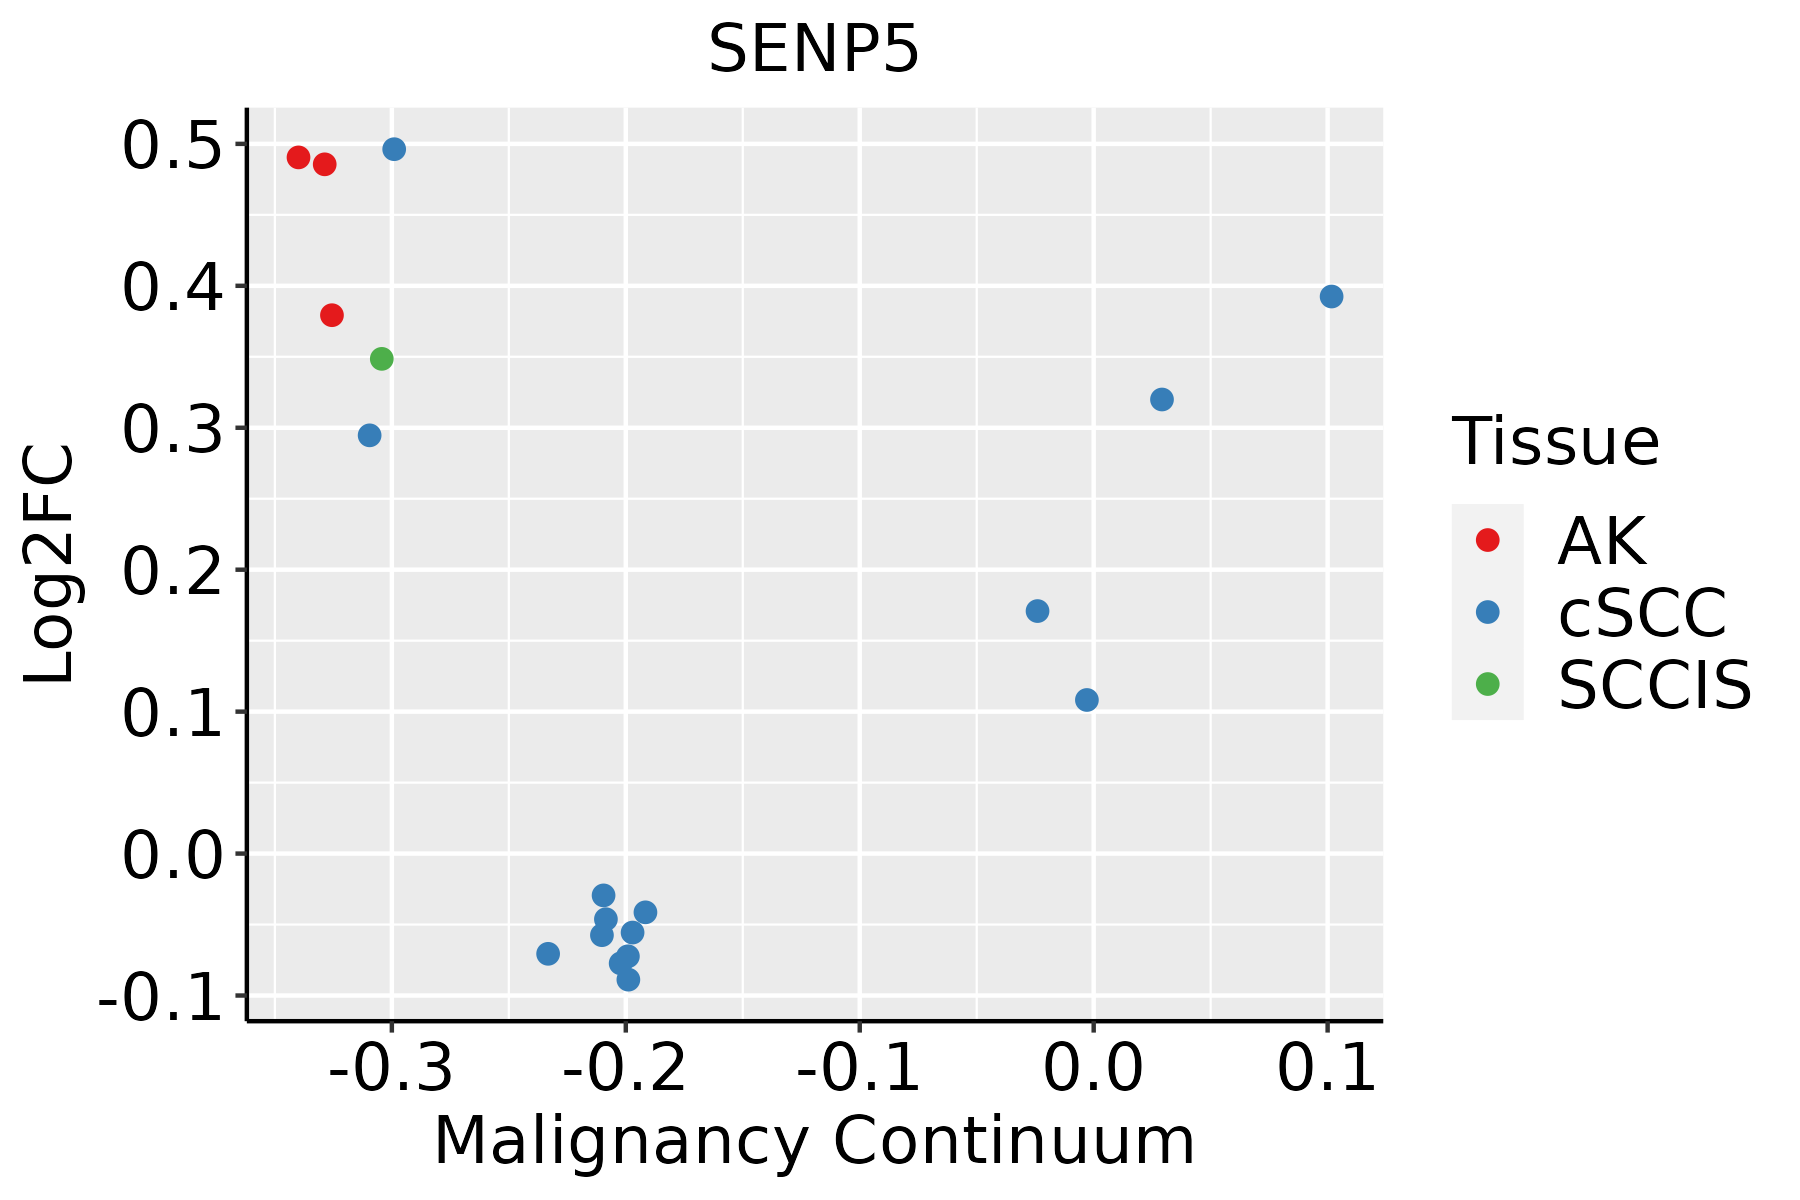 | AK: Actinic keratosis |
| cSCC: Cutaneous squamous cell carcinoma |
| SCCIS:squamous cell carcinoma in situ |
| Thyroid |  | ATC: Anaplastic thyroid cancer |
| HT: Hashimoto's thyroiditis |
| PTC: Papillary thyroid cancer |
| GO ID | Tissue | Disease Stage | Description | Gene Ratio | Bg Ratio | pvalue | p.adjust | Count |
| GO:00182054 | Cervix | CC | peptidyl-lysine modification | 62/2311 | 376/18723 | 1.04e-02 | 4.97e-02 | 62 |
| GO:00182057 | Esophagus | HGIN | peptidyl-lysine modification | 88/2587 | 376/18723 | 2.99e-07 | 1.39e-05 | 88 |
| GO:00706463 | Esophagus | HGIN | protein modification by small protein removal | 34/2587 | 157/18723 | 4.68e-03 | 4.02e-02 | 34 |
| GO:001820514 | Esophagus | ESCC | peptidyl-lysine modification | 259/8552 | 376/18723 | 3.90e-20 | 5.26e-18 | 259 |
| GO:007064612 | Esophagus | ESCC | protein modification by small protein removal | 95/8552 | 157/18723 | 1.25e-04 | 8.56e-04 | 95 |
| GO:0018205 | Liver | NAFLD | peptidyl-lysine modification | 65/1882 | 376/18723 | 9.42e-06 | 3.02e-04 | 65 |
| GO:0070646 | Liver | NAFLD | protein modification by small protein removal | 29/1882 | 157/18723 | 9.11e-04 | 1.09e-02 | 29 |
| GO:00182052 | Liver | HCC | peptidyl-lysine modification | 230/7958 | 376/18723 | 1.51e-13 | 8.32e-12 | 230 |
| GO:00706461 | Liver | HCC | protein modification by small protein removal | 91/7958 | 157/18723 | 6.50e-05 | 5.92e-04 | 91 |
| GO:00182056 | Oral cavity | OSCC | peptidyl-lysine modification | 216/7305 | 376/18723 | 2.32e-13 | 1.16e-11 | 216 |
| GO:00706462 | Oral cavity | OSCC | protein modification by small protein removal | 77/7305 | 157/18723 | 6.55e-03 | 2.43e-02 | 77 |
| GO:001820521 | Oral cavity | EOLP | peptidyl-lysine modification | 72/2218 | 376/18723 | 2.38e-05 | 3.56e-04 | 72 |
| GO:007064611 | Oral cavity | EOLP | protein modification by small protein removal | 33/2218 | 157/18723 | 7.04e-04 | 5.78e-03 | 33 |
| GO:001820531 | Oral cavity | NEOLP | peptidyl-lysine modification | 64/2005 | 376/18723 | 1.21e-04 | 1.43e-03 | 64 |
| GO:00182058 | Skin | AK | peptidyl-lysine modification | 66/1910 | 376/18723 | 7.80e-06 | 1.72e-04 | 66 |
| GO:001820515 | Skin | cSCC | peptidyl-lysine modification | 137/4864 | 376/18723 | 4.09e-06 | 6.09e-05 | 137 |
| GO:00706464 | Skin | cSCC | protein modification by small protein removal | 55/4864 | 157/18723 | 7.29e-03 | 3.46e-02 | 55 |
| GO:00182059 | Thyroid | PTC | peptidyl-lysine modification | 188/5968 | 376/18723 | 1.34e-13 | 7.09e-12 | 188 |
| GO:00706465 | Thyroid | PTC | protein modification by small protein removal | 71/5968 | 157/18723 | 3.03e-04 | 2.12e-03 | 71 |
| GO:001820516 | Thyroid | ATC | peptidyl-lysine modification | 193/6293 | 376/18723 | 6.92e-13 | 3.06e-11 | 193 |
| Hugo Symbol | Variant Class | Variant Classification | dbSNP RS | HGVSc | HGVSp | HGVSp Short | SWISSPROT | BIOTYPE | SIFT | PolyPhen | Tumor Sample Barcode | Tissue | Histology | Sex | Age | Stage | Therapy Types | Drugs | Outcome |
| SENP5 | SNV | Missense_Mutation | novel | c.799N>G | p.Trp267Gly | p.W267G | Q96HI0 | protein_coding | deleterious(0.03) | probably_damaging(0.996) | TCGA-A8-A08H-01 | Breast | breast invasive carcinoma | Female | >=65 | I/II | Unknown | Unknown | SD |
| SENP5 | SNV | Missense_Mutation | | c.1205N>C | p.Gln402Pro | p.Q402P | Q96HI0 | protein_coding | tolerated(0.24) | benign(0.026) | TCGA-A8-A09N-01 | Breast | breast invasive carcinoma | Female | <65 | III/IV | Unknown | Unknown | SD |
| SENP5 | SNV | Missense_Mutation | rs369618833 | c.1430N>G | p.Lys477Arg | p.K477R | Q96HI0 | protein_coding | tolerated(0.08) | benign(0.054) | TCGA-AN-A0AK-01 | Breast | breast invasive carcinoma | Female | >=65 | I/II | Unknown | Unknown | SD |
| SENP5 | insertion | In_Frame_Ins | novel | c.1244_1245insTATGGAAGCTGA | p.Val415_Ser416insMetGluAlaGlu | p.V415_S416insMEAE | Q96HI0 | protein_coding | | | TCGA-A2-A0CT-01 | Breast | breast invasive carcinoma | Female | >=65 | I/II | Chemotherapy | cytoxan | SD |
| SENP5 | insertion | Frame_Shift_Ins | novel | c.1246_1247insGGGGAAGGGC | p.Ser416TrpfsTer12 | p.S416Wfs*12 | Q96HI0 | protein_coding | | | TCGA-A2-A0CT-01 | Breast | breast invasive carcinoma | Female | >=65 | I/II | Chemotherapy | cytoxan | SD |
| SENP5 | insertion | Frame_Shift_Ins | novel | c.953_954insAGCTCATGCAAGGTTTATCATCCTAA | p.Thr319AlafsTer31 | p.T319Afs*31 | Q96HI0 | protein_coding | | | TCGA-A2-A0D1-01 | Breast | breast invasive carcinoma | Female | >=65 | I/II | Chemotherapy | taxotere | SD |
| SENP5 | insertion | Nonsense_Mutation | novel | c.657_658insTGCCTCTGCTTCTGAGCCTTTCTGCTTTCTG | p.Asn220CysfsTer5 | p.N220Cfs*5 | Q96HI0 | protein_coding | | | TCGA-A2-A0EQ-01 | Breast | breast invasive carcinoma | Female | <65 | I/II | Chemotherapy | adriamycin | SD |
| SENP5 | insertion | Nonsense_Mutation | novel | c.1438_1439insCCTTCCCCAGAACCTAAAGACCCTTCTTGTCGGC | p.Asn480ThrfsTer6 | p.N480Tfs*6 | Q96HI0 | protein_coding | | | TCGA-AN-A03X-01 | Breast | breast invasive carcinoma | Female | >=65 | I/II | Unknown | Unknown | SD |
| SENP5 | insertion | Frame_Shift_Ins | novel | c.1354_1355insC | p.Ile452ThrfsTer3 | p.I452Tfs*3 | Q96HI0 | protein_coding | | | TCGA-AO-A0J5-01 | Breast | breast invasive carcinoma | Female | <65 | III/IV | Other, specify in notesBisphosphonate | zoledronic | PD |
| SENP5 | insertion | In_Frame_Ins | novel | c.1356_1357insCAGAACCAAAAGCAAGGTTTGCAAGCTAAGAAAAGC | p.Ile452_Leu453insGlnAsnGlnLysGlnGlyLeuGlnAlaLysLysSer | p.I452_L453insQNQKQGLQAKKS | Q96HI0 | protein_coding | | | TCGA-AO-A0J5-01 | Breast | breast invasive carcinoma | Female | <65 | III/IV | Other, specify in notesBisphosphonate | zoledronic | PD |


