
|
|||||
|
 | |
| |
| |
| |
| |
| |
|
Gene: SENP2 |
Gene summary for SENP2 |
| Gene information | Species | Human | Gene symbol | SENP2 | Gene ID | 59343 |
| Gene name | SUMO specific peptidase 2 | |
| Gene Alias | AXAM2 | |
| Cytomap | 3q27.2 | |
| Gene Type | protein-coding | GO ID | GO:0006403 | UniProtAcc | Q9HC62 |
Top |
Malignant transformation analysis |
| Identification of the aberrant gene expression in precancerous and cancerous lesions by comparing the gene expression of stem-like cells in diseased tissues with normal stem cells |
| Entrez ID | Symbol | Replicates | Species | Organ | Tissue | Adj P-value | Log2FC | Malignancy |
| 59343 | SENP2 | EEC-subject3 | Human | Endometrium | EEC | 2.05e-02 | -3.18e-02 | -0.2525 |
| 59343 | SENP2 | GSM6177620_NYU_UCEC1_lib1_lib1 | Human | Endometrium | EEC | 2.95e-07 | -2.95e-02 | -0.1869 |
| 59343 | SENP2 | GSM6177620_NYU_UCEC1_lib3_lib3 | Human | Endometrium | EEC | 3.87e-05 | -1.32e-02 | -0.1883 |
| 59343 | SENP2 | GSM6177621_NYU_UCEC2_lib1_lib1 | Human | Endometrium | EEC | 5.17e-03 | 2.70e-02 | -0.1934 |
| 59343 | SENP2 | GSM6177622_NYU_UCEC3_lib1_lib1 | Human | Endometrium | EEC | 9.12e-09 | -1.01e-02 | -0.1917 |
| 59343 | SENP2 | GSM6177622_NYU_UCEC3_lib2_lib2 | Human | Endometrium | EEC | 2.15e-08 | 2.34e-02 | -0.1916 |
| 59343 | SENP2 | LZE2T | Human | Esophagus | ESCC | 1.04e-03 | 3.45e-01 | 0.082 |
| 59343 | SENP2 | LZE4T | Human | Esophagus | ESCC | 5.14e-05 | 2.47e-01 | 0.0811 |
| 59343 | SENP2 | LZE7T | Human | Esophagus | ESCC | 1.13e-06 | 4.06e-01 | 0.0667 |
| 59343 | SENP2 | LZE8T | Human | Esophagus | ESCC | 1.47e-04 | 9.69e-02 | 0.067 |
| 59343 | SENP2 | LZE20T | Human | Esophagus | ESCC | 3.49e-04 | 1.16e-01 | 0.0662 |
| 59343 | SENP2 | LZE24T | Human | Esophagus | ESCC | 6.86e-14 | 4.80e-01 | 0.0596 |
| 59343 | SENP2 | P1T-E | Human | Esophagus | ESCC | 7.10e-08 | 4.55e-01 | 0.0875 |
| 59343 | SENP2 | P2T-E | Human | Esophagus | ESCC | 2.58e-61 | 1.03e+00 | 0.1177 |
| 59343 | SENP2 | P4T-E | Human | Esophagus | ESCC | 2.07e-29 | 7.02e-01 | 0.1323 |
| 59343 | SENP2 | P5T-E | Human | Esophagus | ESCC | 1.02e-04 | 1.79e-01 | 0.1327 |
| 59343 | SENP2 | P8T-E | Human | Esophagus | ESCC | 7.54e-29 | 4.17e-01 | 0.0889 |
| 59343 | SENP2 | P9T-E | Human | Esophagus | ESCC | 6.43e-13 | 3.15e-01 | 0.1131 |
| 59343 | SENP2 | P10T-E | Human | Esophagus | ESCC | 2.40e-21 | 4.55e-01 | 0.116 |
| 59343 | SENP2 | P11T-E | Human | Esophagus | ESCC | 4.00e-05 | 3.19e-01 | 0.1426 |
| Page: 1 2 3 4 5 6 |
| Tissue | Expression Dynamics | Abbreviation |
| Endometrium | 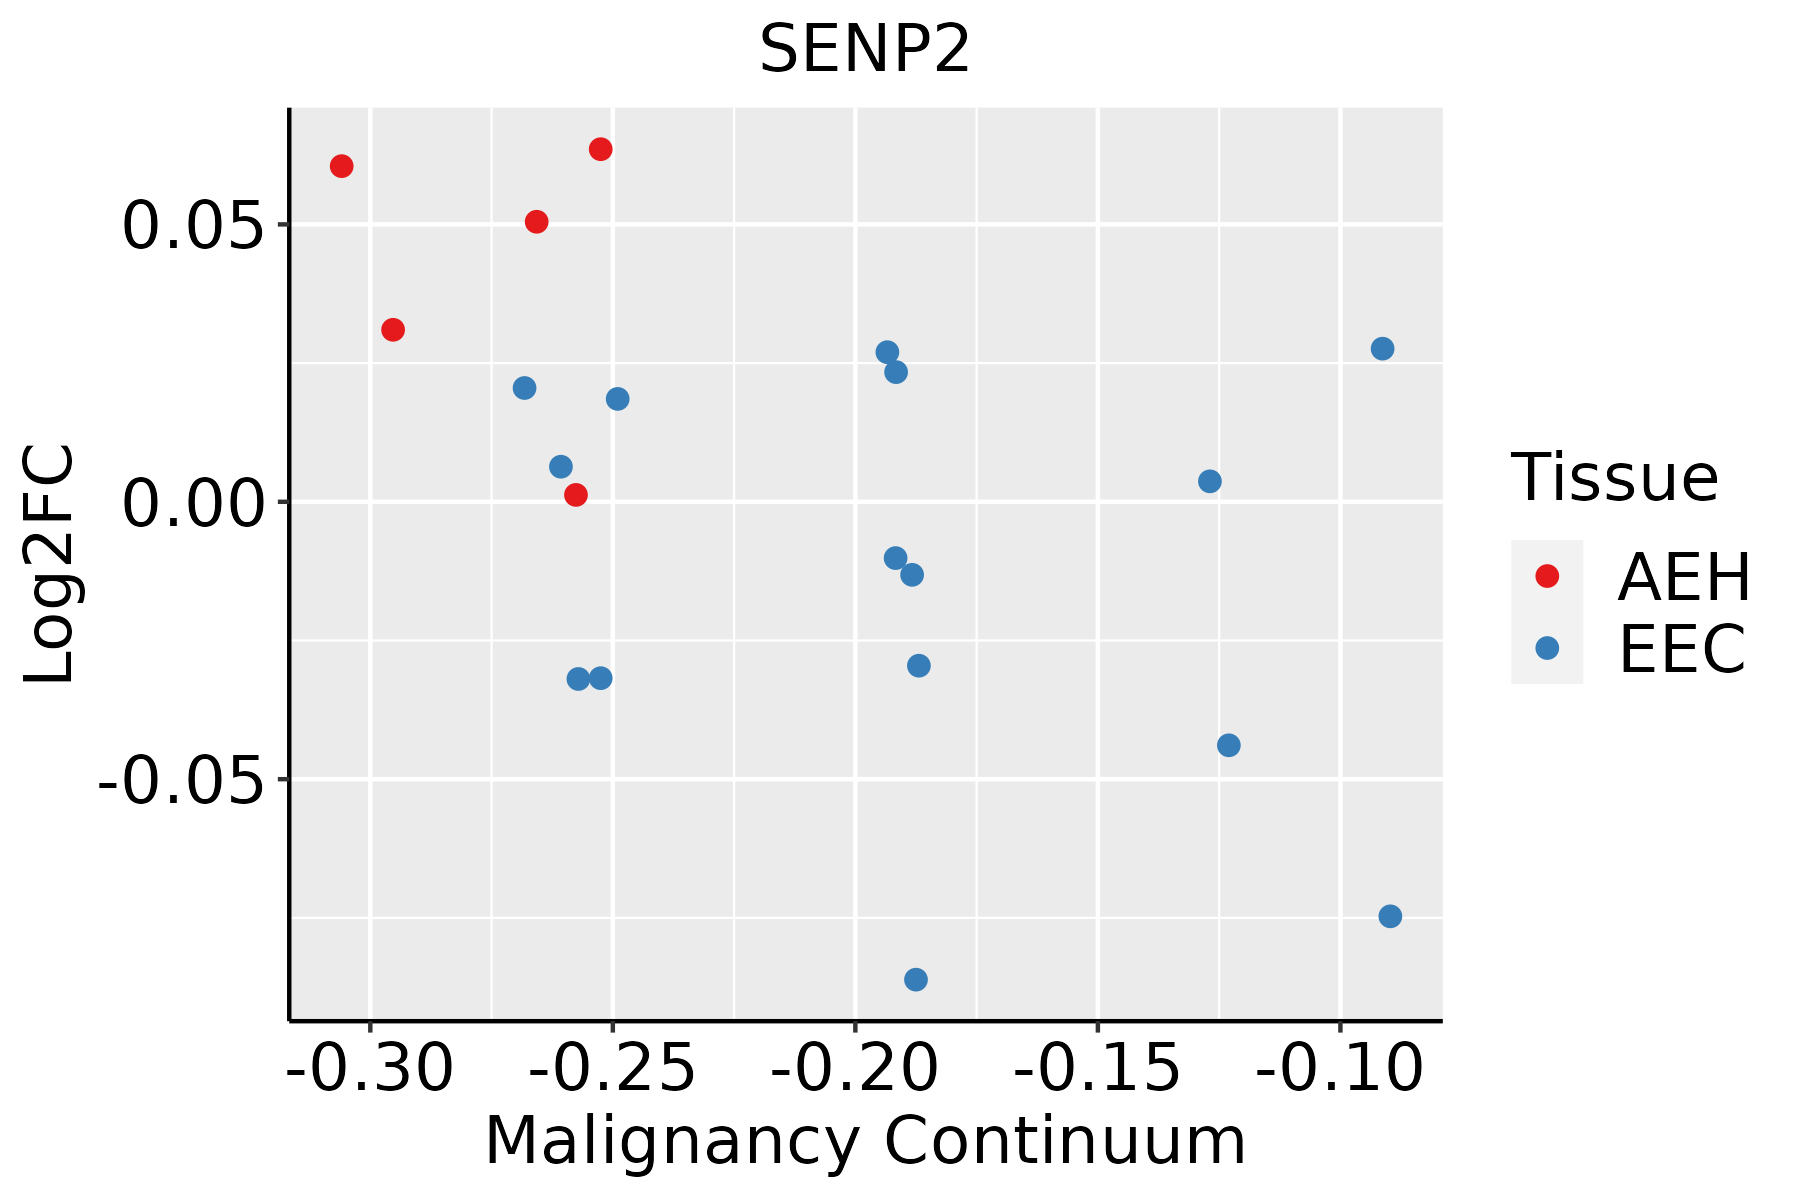 | AEH: Atypical endometrial hyperplasia |
| EEC: Endometrioid Cancer | ||
| Esophagus | 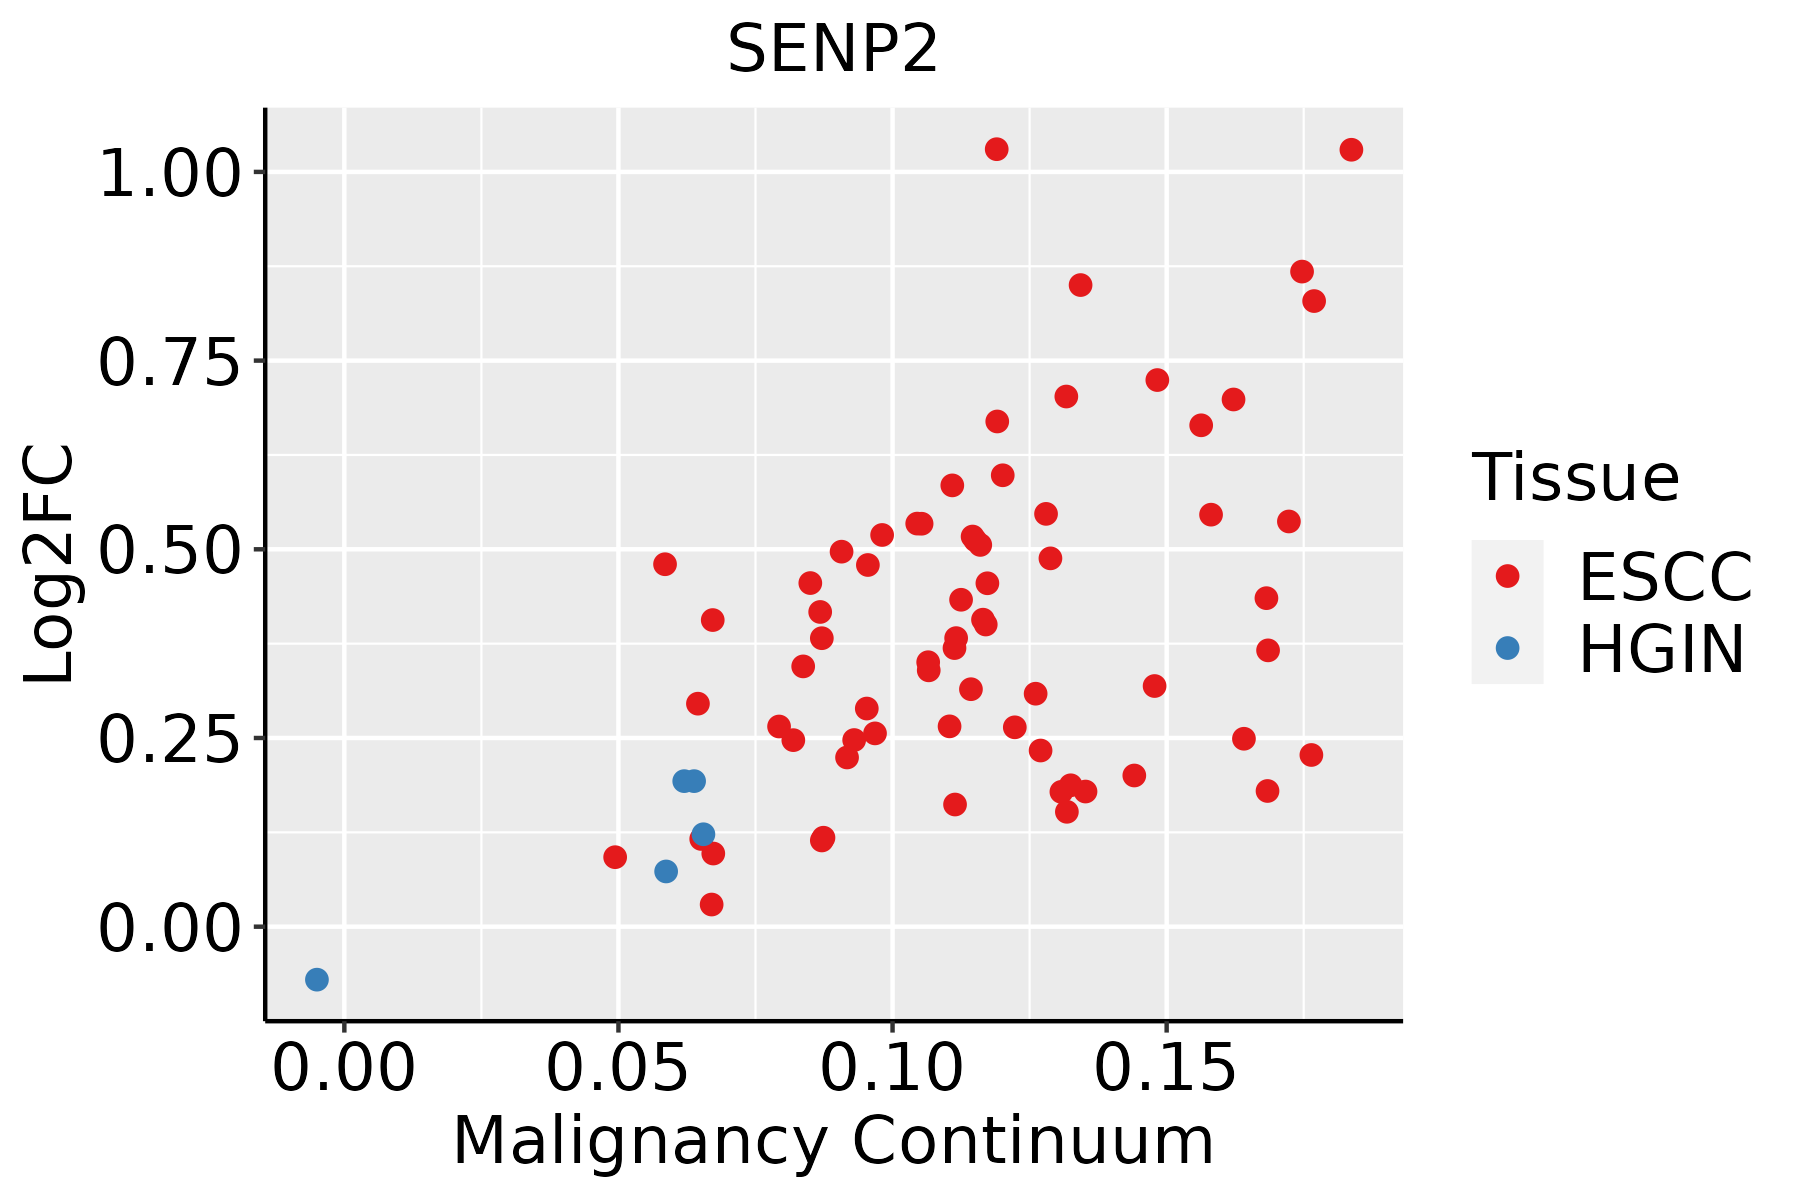 | ESCC: Esophageal squamous cell carcinoma |
| HGIN: High-grade intraepithelial neoplasias | ||
| LGIN: Low-grade intraepithelial neoplasias | ||
| Liver | 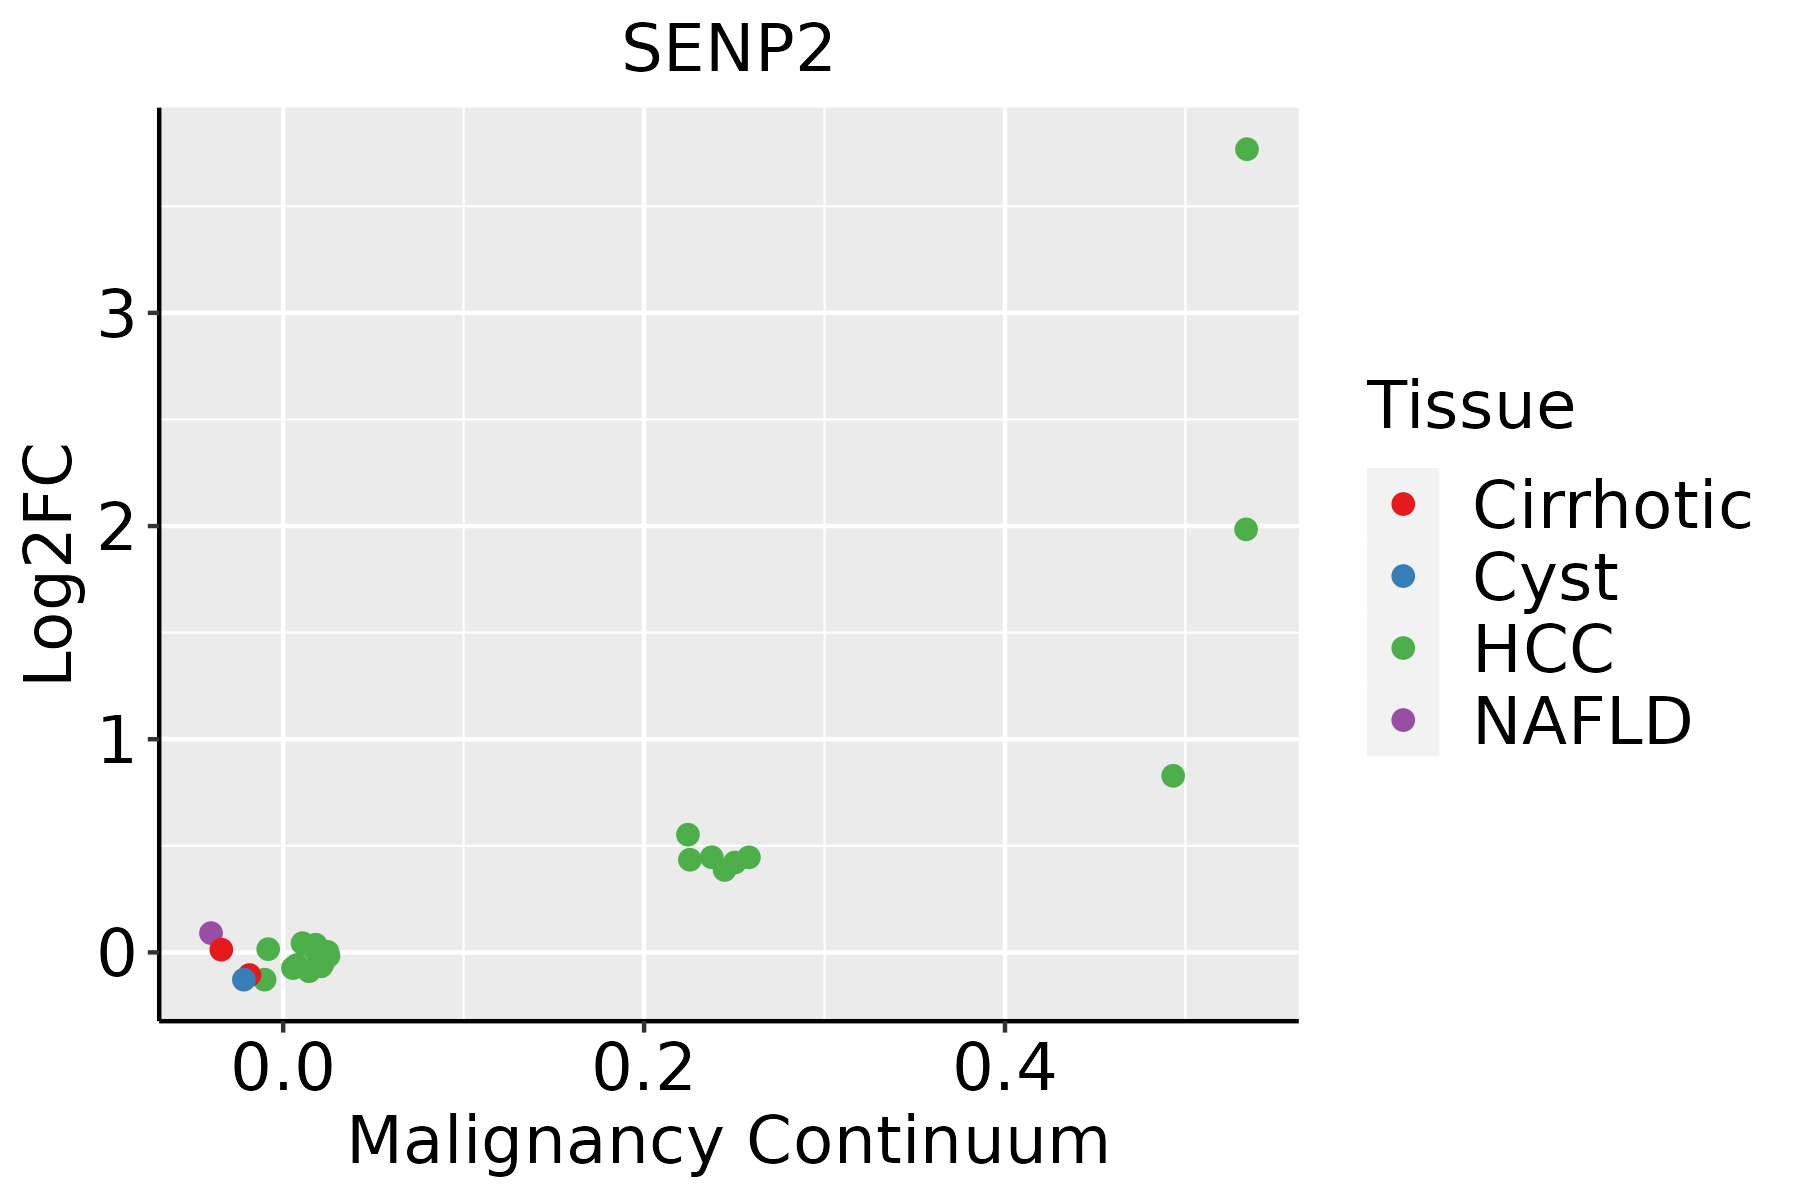 | HCC: Hepatocellular carcinoma |
| NAFLD: Non-alcoholic fatty liver disease | ||
| Lung | 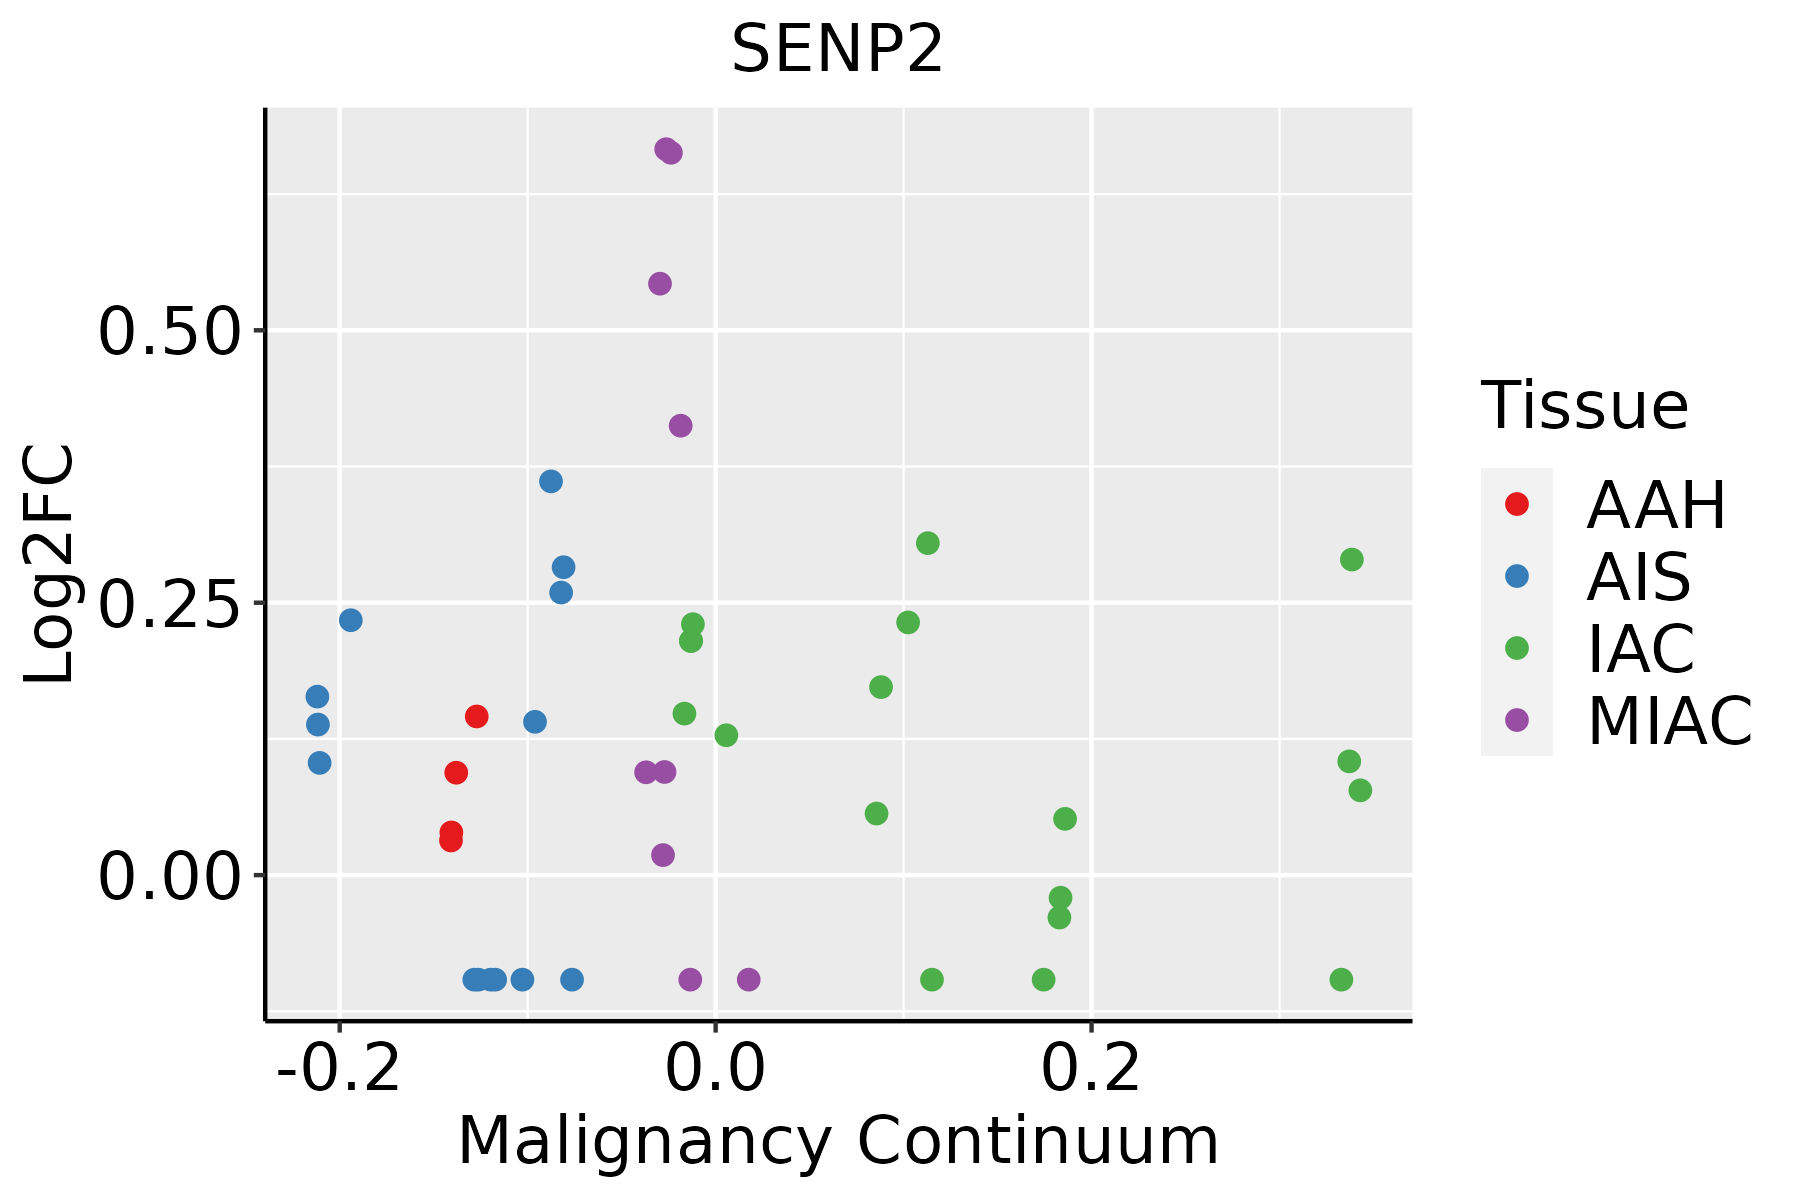 | AAH: Atypical adenomatous hyperplasia |
| AIS: Adenocarcinoma in situ | ||
| IAC: Invasive lung adenocarcinoma | ||
| MIA: Minimally invasive adenocarcinoma | ||
| Oral Cavity | 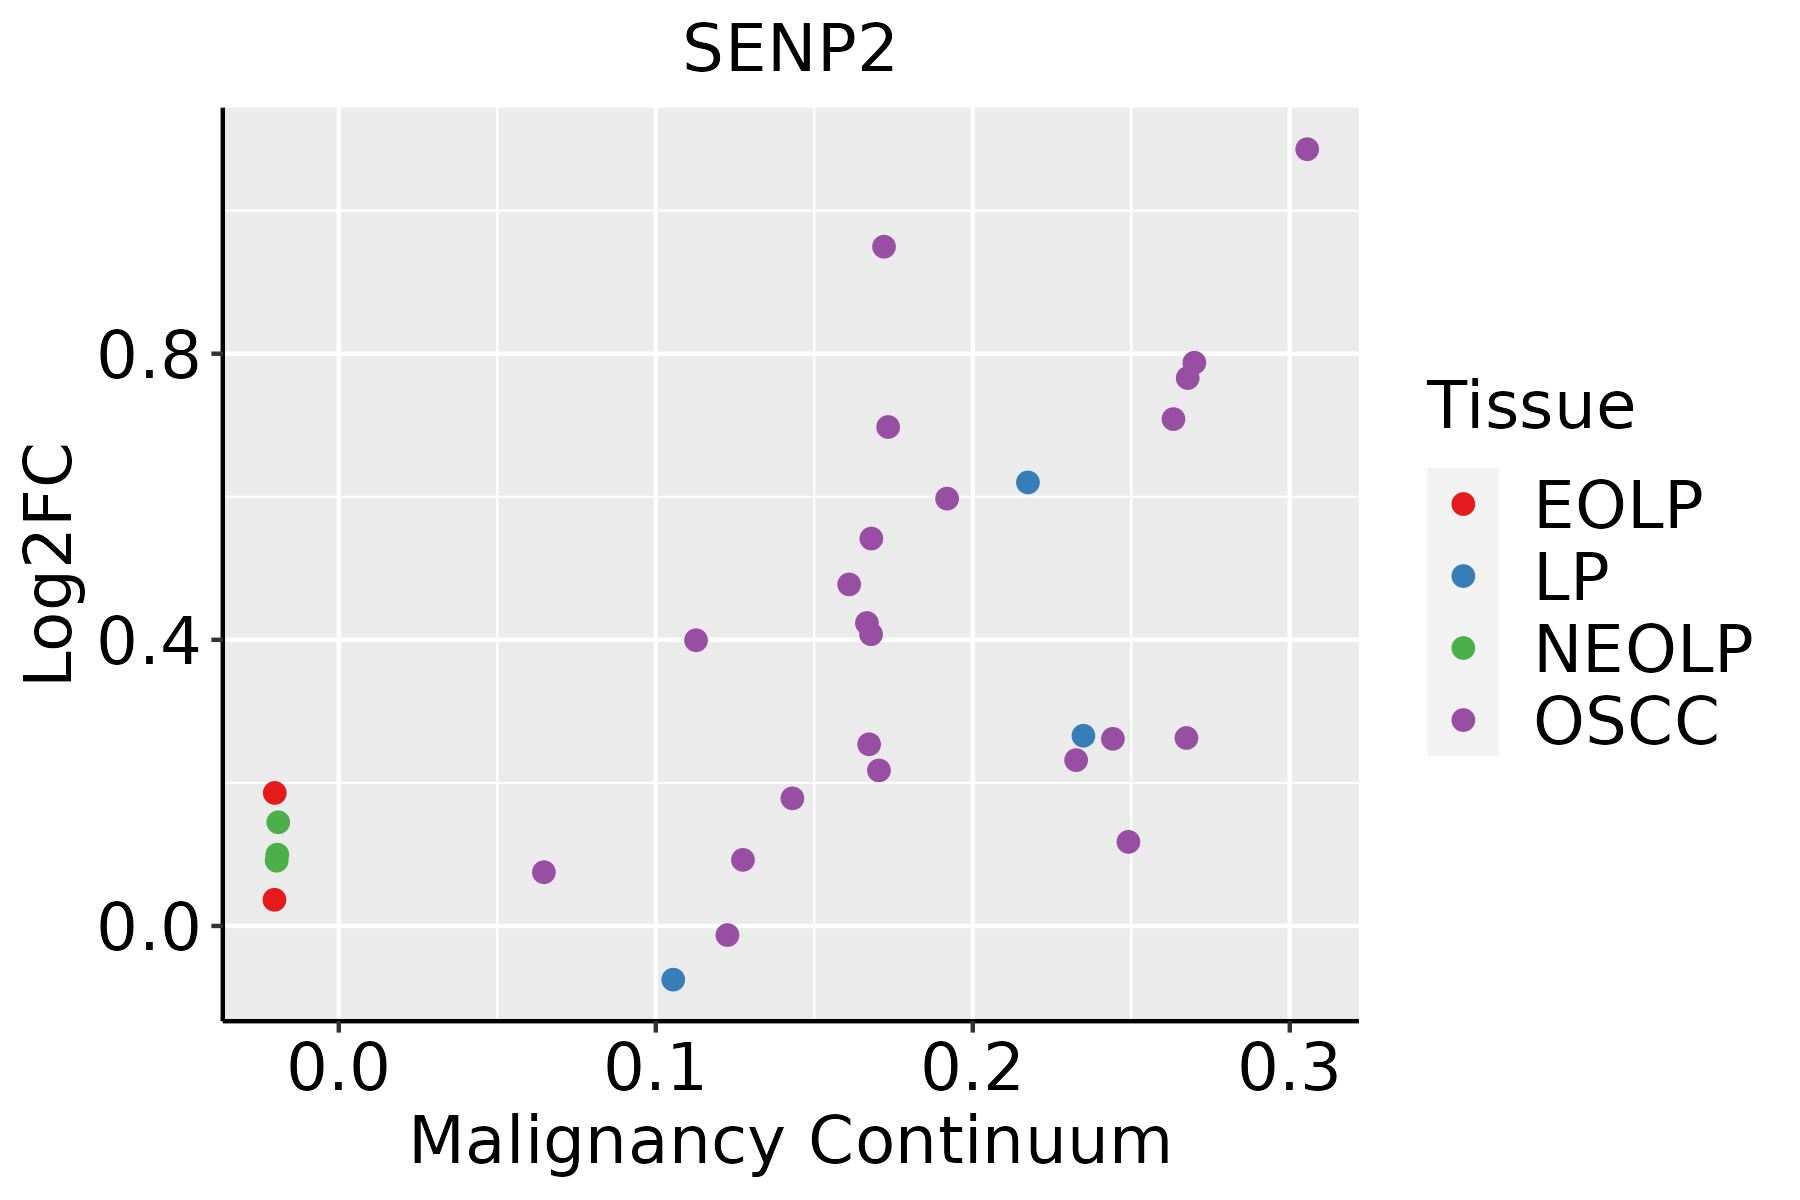 | EOLP: Erosive Oral lichen planus |
| LP: leukoplakia | ||
| NEOLP: Non-erosive oral lichen planus | ||
| OSCC: Oral squamous cell carcinoma | ||
| Thyroid | 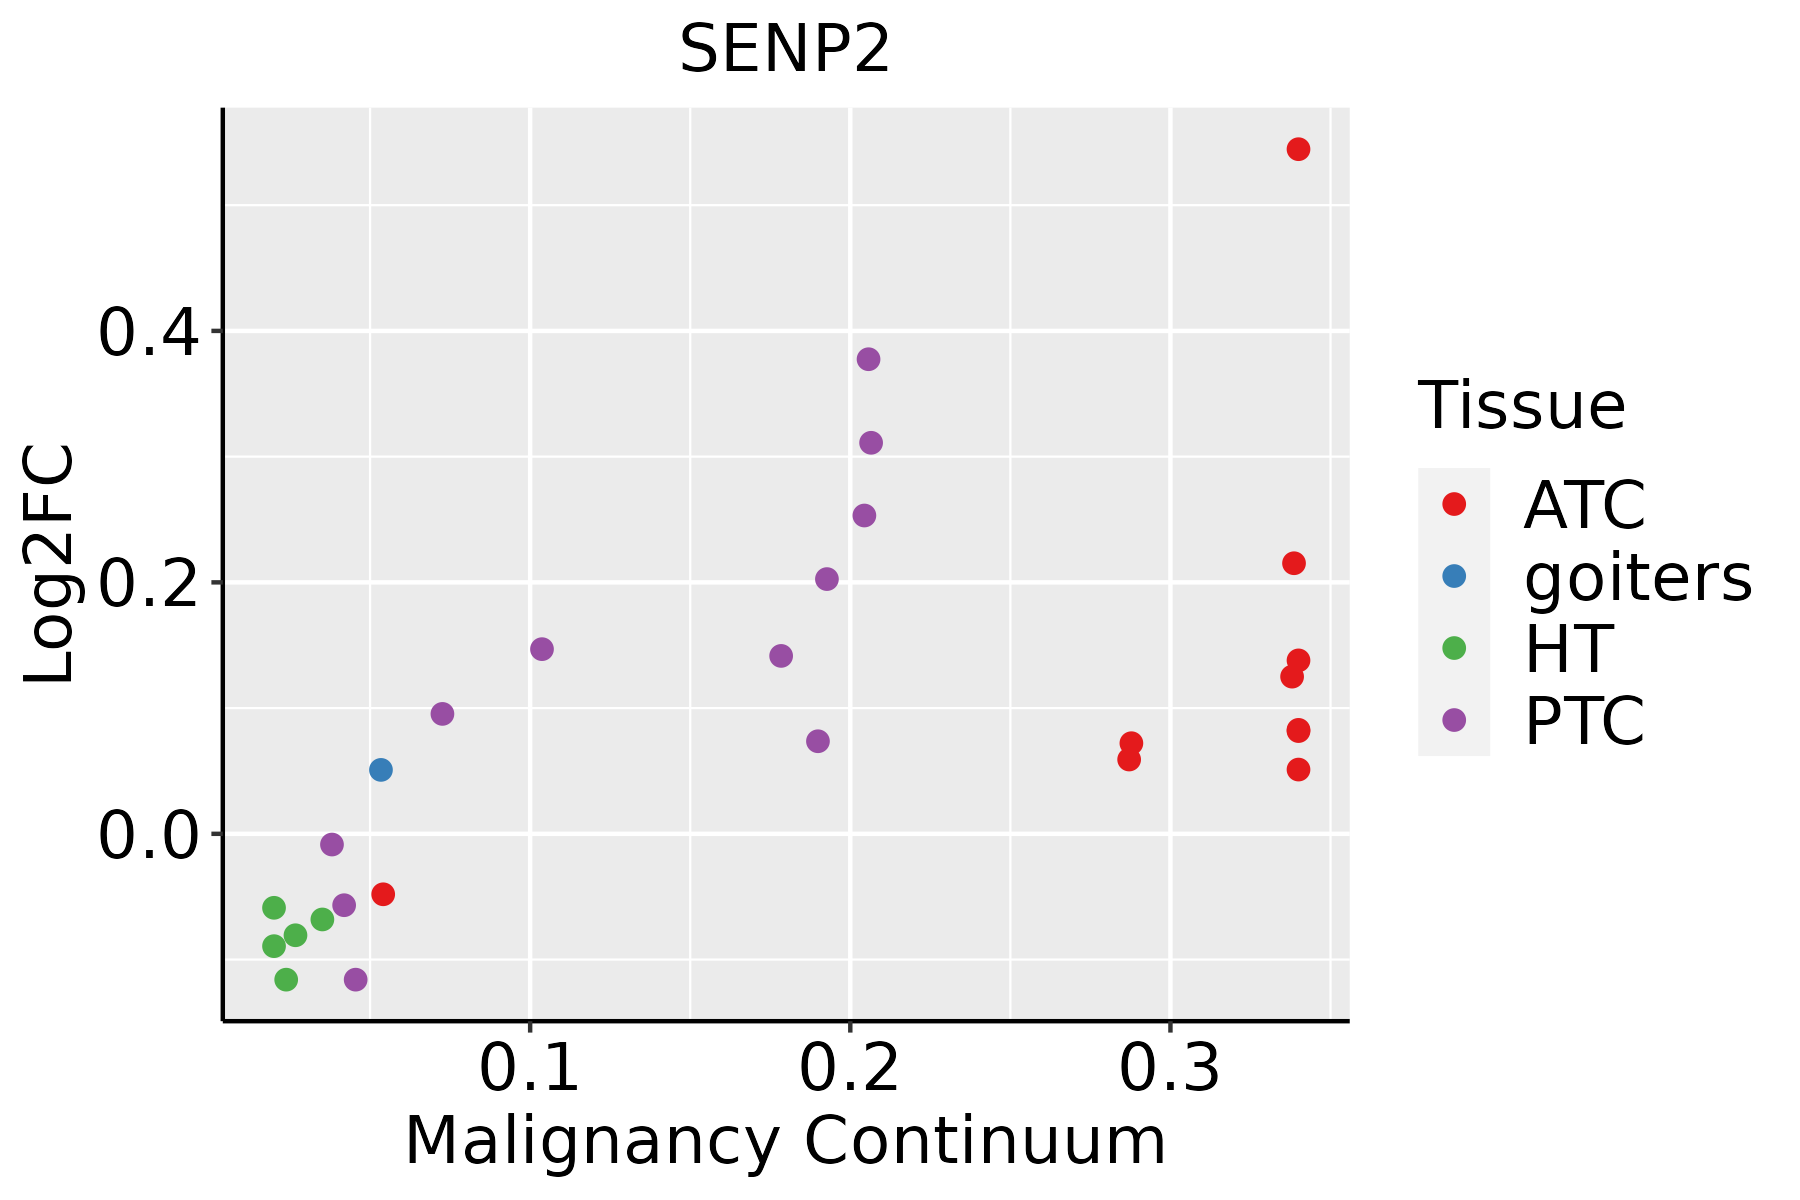 | ATC: Anaplastic thyroid cancer |
| HT: Hashimoto's thyroiditis | ||
| PTC: Papillary thyroid cancer |
| ∗log2FC in expression of this searched gene in stem-like cells from each diseased tissue sample relative to stem-like cells in normal samples in each tissue plotted against the malignancy continuum. Samples are colored based on if they are from different disease stage. |
Top |
Malignant transformation related pathway analysis |
| Find out the enriched GO biological processes and KEGG pathways involved in transition from healthy to precancer to cancer |
| Tissue | Disease Stage | Enriched GO biological Processes |
| Colorectum | AD |  |
| Colorectum | SER |  |
| Colorectum | MSS |  |
| Colorectum | MSI-H |  |
| Colorectum | FAP |  |
| ∗Top 15 enriched GO BP terms are showed in the bar plot of each disease state in each tissue. Each row represents a significant GO biological process which is colored according to the -log10(p.adjust). |
| Page: 1 2 3 4 5 6 7 8 9 |
| GO ID | Tissue | Disease Stage | Description | Gene Ratio | Bg Ratio | pvalue | p.adjust | Count |
| GO:190332017 | Endometrium | EEC | regulation of protein modification by small protein conjugation or removal | 72/2168 | 242/18723 | 1.45e-14 | 4.36e-12 | 72 |
| GO:003164717 | Endometrium | EEC | regulation of protein stability | 80/2168 | 298/18723 | 2.48e-13 | 5.96e-11 | 80 |
| GO:003139617 | Endometrium | EEC | regulation of protein ubiquitination | 62/2168 | 210/18723 | 1.42e-12 | 2.76e-10 | 62 |
| GO:003139717 | Endometrium | EEC | negative regulation of protein ubiquitination | 31/2168 | 83/18723 | 1.05e-09 | 9.13e-08 | 31 |
| GO:190332117 | Endometrium | EEC | negative regulation of protein modification by small protein conjugation or removal | 33/2168 | 95/18723 | 2.68e-09 | 2.01e-07 | 33 |
| GO:000640315 | Endometrium | EEC | RNA localization | 53/2168 | 201/18723 | 5.20e-09 | 3.47e-07 | 53 |
| GO:003011113 | Endometrium | EEC | regulation of Wnt signaling pathway | 74/2168 | 328/18723 | 1.03e-08 | 6.47e-07 | 74 |
| GO:001605513 | Endometrium | EEC | Wnt signaling pathway | 90/2168 | 444/18723 | 6.65e-08 | 3.50e-06 | 90 |
| GO:019873813 | Endometrium | EEC | cell-cell signaling by wnt | 90/2168 | 446/18723 | 8.25e-08 | 4.23e-06 | 90 |
| GO:005065712 | Endometrium | EEC | nucleic acid transport | 39/2168 | 163/18723 | 7.00e-06 | 1.63e-04 | 39 |
| GO:005065812 | Endometrium | EEC | RNA transport | 39/2168 | 163/18723 | 7.00e-06 | 1.63e-04 | 39 |
| GO:005123612 | Endometrium | EEC | establishment of RNA localization | 39/2168 | 166/18723 | 1.11e-05 | 2.33e-04 | 39 |
| GO:190332213 | Endometrium | EEC | positive regulation of protein modification by small protein conjugation or removal | 33/2168 | 138/18723 | 3.49e-05 | 5.90e-04 | 33 |
| GO:001593112 | Endometrium | EEC | nucleobase-containing compound transport | 46/2168 | 222/18723 | 5.91e-05 | 9.13e-04 | 46 |
| GO:003139813 | Endometrium | EEC | positive regulation of protein ubiquitination | 29/2168 | 119/18723 | 7.05e-05 | 1.04e-03 | 29 |
| GO:005102812 | Endometrium | EEC | mRNA transport | 29/2168 | 130/18723 | 3.63e-04 | 3.95e-03 | 29 |
| GO:003164812 | Endometrium | EEC | protein destabilization | 13/2168 | 46/18723 | 1.65e-03 | 1.29e-02 | 13 |
| GO:00454446 | Endometrium | EEC | fat cell differentiation | 39/2168 | 229/18723 | 8.69e-03 | 4.71e-02 | 39 |
| GO:0006403110 | Esophagus | ESCC | RNA localization | 166/8552 | 201/18723 | 1.95e-27 | 6.18e-25 | 166 |
| GO:0031647111 | Esophagus | ESCC | regulation of protein stability | 223/8552 | 298/18723 | 5.76e-25 | 1.52e-22 | 223 |
| Page: 1 2 3 4 5 6 7 8 9 |
| Pathway ID | Tissue | Disease Stage | Description | Gene Ratio | Bg Ratio | pvalue | p.adjust | qvalue | Count |
| hsa0431022 | Endometrium | EEC | Wnt signaling pathway | 40/1237 | 171/8465 | 1.37e-03 | 8.99e-03 | 6.70e-03 | 40 |
| hsa0431032 | Endometrium | EEC | Wnt signaling pathway | 40/1237 | 171/8465 | 1.37e-03 | 8.99e-03 | 6.70e-03 | 40 |
| hsa0301321 | Esophagus | ESCC | Nucleocytoplasmic transport | 89/4205 | 108/8465 | 1.20e-12 | 2.37e-11 | 1.21e-11 | 89 |
| hsa0301331 | Esophagus | ESCC | Nucleocytoplasmic transport | 89/4205 | 108/8465 | 1.20e-12 | 2.37e-11 | 1.21e-11 | 89 |
| hsa03013 | Liver | HCC | Nucleocytoplasmic transport | 81/4020 | 108/8465 | 4.28e-09 | 6.83e-08 | 3.80e-08 | 81 |
| hsa030131 | Liver | HCC | Nucleocytoplasmic transport | 81/4020 | 108/8465 | 4.28e-09 | 6.83e-08 | 3.80e-08 | 81 |
| hsa043108 | Lung | IAC | Wnt signaling pathway | 40/1053 | 171/8465 | 4.56e-05 | 7.06e-04 | 4.69e-04 | 40 |
| hsa0431011 | Lung | IAC | Wnt signaling pathway | 40/1053 | 171/8465 | 4.56e-05 | 7.06e-04 | 4.69e-04 | 40 |
| hsa0431041 | Lung | MIAC | Wnt signaling pathway | 21/507 | 171/8465 | 1.30e-03 | 1.40e-02 | 1.01e-02 | 21 |
| hsa0431051 | Lung | MIAC | Wnt signaling pathway | 21/507 | 171/8465 | 1.30e-03 | 1.40e-02 | 1.01e-02 | 21 |
| hsa030136 | Oral cavity | OSCC | Nucleocytoplasmic transport | 82/3704 | 108/8465 | 7.93e-12 | 1.33e-10 | 6.77e-11 | 82 |
| hsa0301311 | Oral cavity | OSCC | Nucleocytoplasmic transport | 82/3704 | 108/8465 | 7.93e-12 | 1.33e-10 | 6.77e-11 | 82 |
| hsa030134 | Oral cavity | EOLP | Nucleocytoplasmic transport | 34/1218 | 108/8465 | 4.24e-06 | 2.91e-05 | 1.72e-05 | 34 |
| hsa0431016 | Oral cavity | EOLP | Wnt signaling pathway | 37/1218 | 171/8465 | 6.23e-03 | 1.83e-02 | 1.08e-02 | 37 |
| hsa030135 | Oral cavity | EOLP | Nucleocytoplasmic transport | 34/1218 | 108/8465 | 4.24e-06 | 2.91e-05 | 1.72e-05 | 34 |
| hsa0431017 | Oral cavity | EOLP | Wnt signaling pathway | 37/1218 | 171/8465 | 6.23e-03 | 1.83e-02 | 1.08e-02 | 37 |
| Page: 1 |
Top |
Cell-cell communication analysis |
| Identification of potential cell-cell interactions between two cell types and their ligand-receptor pairs for different disease states |
| Ligand | Receptor | LRpair | Pathway | Tissue | Disease Stage |
| Page: 1 |
Top |
Single-cell gene regulatory network inference analysis |
| Find out the significant the regulons (TFs) and the target genes of each regulon across cell types for different disease states |
| TF | Cell Type | Tissue | Disease Stage | Target Gene | RSS | Regulon Activity |
| ∗The dot plots of a searched regulon are shown for all cell subpopulations in each disease state of each tissue based on the regulon specific score inferred using pySCENIC and by calculating the average expression. |
| Page: 1 |
Top |
Somatic mutation of malignant transformation related genes |
| Annotation of somatic variants for genes involved in malignant transformation |
| Hugo Symbol | Variant Class | Variant Classification | dbSNP RS | HGVSc | HGVSp | HGVSp Short | SWISSPROT | BIOTYPE | SIFT | PolyPhen | Tumor Sample Barcode | Tissue | Histology | Sex | Age | Stage | Therapy Types | Drugs | Outcome |
| SENP2 | SNV | Missense_Mutation | novel | c.106C>G | p.Leu36Val | p.L36V | Q9HC62 | protein_coding | tolerated_low_confidence(0.25) | benign(0) | TCGA-5L-AAT1-01 | Breast | breast invasive carcinoma | Female | <65 | III/IV | Hormone Therapy | letrozol | SD |
| SENP2 | SNV | Missense_Mutation | rs772605303 | c.1090N>A | p.Asp364Asn | p.D364N | Q9HC62 | protein_coding | tolerated(0.5) | possibly_damaging(0.642) | TCGA-AN-A046-01 | Breast | breast invasive carcinoma | Female | >=65 | I/II | Unknown | Unknown | SD |
| SENP2 | insertion | Frame_Shift_Ins | novel | c.1748_1749insA | p.Leu584ProfsTer93 | p.L584Pfs*93 | Q9HC62 | protein_coding | TCGA-A2-A04Y-01 | Breast | breast invasive carcinoma | Female | <65 | I/II | Chemotherapy | cytoxan | SD | ||
| SENP2 | insertion | Nonsense_Mutation | novel | c.1750_1751insGCGCCTGGCCAAGAATGTGAAC | p.Leu584ArgfsTer7 | p.L584Rfs*7 | Q9HC62 | protein_coding | TCGA-A2-A04Y-01 | Breast | breast invasive carcinoma | Female | <65 | I/II | Chemotherapy | cytoxan | SD | ||
| SENP2 | SNV | Missense_Mutation | novel | c.633G>T | p.Glu211Asp | p.E211D | Q9HC62 | protein_coding | tolerated(0.45) | benign(0.005) | TCGA-2W-A8YY-01 | Cervix | cervical & endocervical cancer | Female | <65 | I/II | Chemotherapy | cisplatin | CR |
| SENP2 | SNV | Missense_Mutation | c.799N>G | p.Gln267Glu | p.Q267E | Q9HC62 | protein_coding | tolerated(0.44) | benign(0.036) | TCGA-EK-A2RJ-01 | Cervix | cervical & endocervical cancer | Female | <65 | I/II | Unknown | Unknown | SD | |
| SENP2 | SNV | Missense_Mutation | novel | c.616N>A | p.Glu206Lys | p.E206K | Q9HC62 | protein_coding | deleterious(0) | probably_damaging(0.971) | TCGA-A6-2672-01 | Colorectum | colon adenocarcinoma | Female | >=65 | III/IV | Unknown | Unknown | SD |
| SENP2 | SNV | Missense_Mutation | c.80N>A | p.Leu27Gln | p.L27Q | Q9HC62 | protein_coding | tolerated_low_confidence(0.09) | possibly_damaging(0.881) | TCGA-AA-3811-01 | Colorectum | colon adenocarcinoma | Female | >=65 | III/IV | Unknown | Unknown | PD | |
| SENP2 | SNV | Missense_Mutation | rs772605303 | c.1090G>A | p.Asp364Asn | p.D364N | Q9HC62 | protein_coding | tolerated(0.5) | possibly_damaging(0.642) | TCGA-AA-A010-01 | Colorectum | colon adenocarcinoma | Female | <65 | I/II | Chemotherapy | folinic | CR |
| SENP2 | SNV | Missense_Mutation | novel | c.1565N>T | p.Ser522Ile | p.S522I | Q9HC62 | protein_coding | tolerated(0.75) | benign(0) | TCGA-AM-5820-01 | Colorectum | colon adenocarcinoma | Female | <65 | I/II | Unknown | Unknown | SD |
| Page: 1 2 3 4 5 6 |
Top |
Related drugs of malignant transformation related genes |
| Identification of chemicals and drugs interact with genes involved in malignant transfromation |
| (DGIdb 4.0) |
| Entrez ID | Symbol | Category | Interaction Types | Drug Claim Name | Drug Name | PMIDs |
| 59343 | SENP2 | ENZYME, PROTEASE | N-ETHYLMALEIMIDE | N-ETHYLMALEIMIDE | 22801642 |
| Page: 1 |

Copyright 2023-Present -The University of Texas Health Science Center at Houston |