
|
|||||
|
 | |
| |
| |
| |
| |
| |
|
Gene: SEMA7A |
Gene summary for SEMA7A |
| Gene information | Species | Human | Gene symbol | SEMA7A | Gene ID | 8482 |
| Gene name | semaphorin 7A (John Milton Hagen blood group) | |
| Gene Alias | CD108 | |
| Cytomap | 15q24.1 | |
| Gene Type | protein-coding | GO ID | GO:0000165 | UniProtAcc | B3KMH6 |
Top |
Malignant transformation analysis |
| Identification of the aberrant gene expression in precancerous and cancerous lesions by comparing the gene expression of stem-like cells in diseased tissues with normal stem cells |
| Entrez ID | Symbol | Replicates | Species | Organ | Tissue | Adj P-value | Log2FC | Malignancy |
| 8482 | SEMA7A | ATC09 | Human | Thyroid | ATC | 5.47e-05 | 2.26e-01 | 0.2871 |
| 8482 | SEMA7A | ATC11 | Human | Thyroid | ATC | 1.80e-12 | 7.71e-01 | 0.3386 |
| 8482 | SEMA7A | ATC12 | Human | Thyroid | ATC | 4.11e-04 | 2.53e-01 | 0.34 |
| 8482 | SEMA7A | ATC1 | Human | Thyroid | ATC | 4.95e-05 | 2.48e-01 | 0.2878 |
| 8482 | SEMA7A | ATC2 | Human | Thyroid | ATC | 3.71e-05 | 4.35e-01 | 0.34 |
| 8482 | SEMA7A | ATC3 | Human | Thyroid | ATC | 1.72e-22 | 8.95e-01 | 0.338 |
| 8482 | SEMA7A | ATC4 | Human | Thyroid | ATC | 2.71e-11 | 3.40e-01 | 0.34 |
| Page: 1 |
| Tissue | Expression Dynamics | Abbreviation |
| Thyroid | 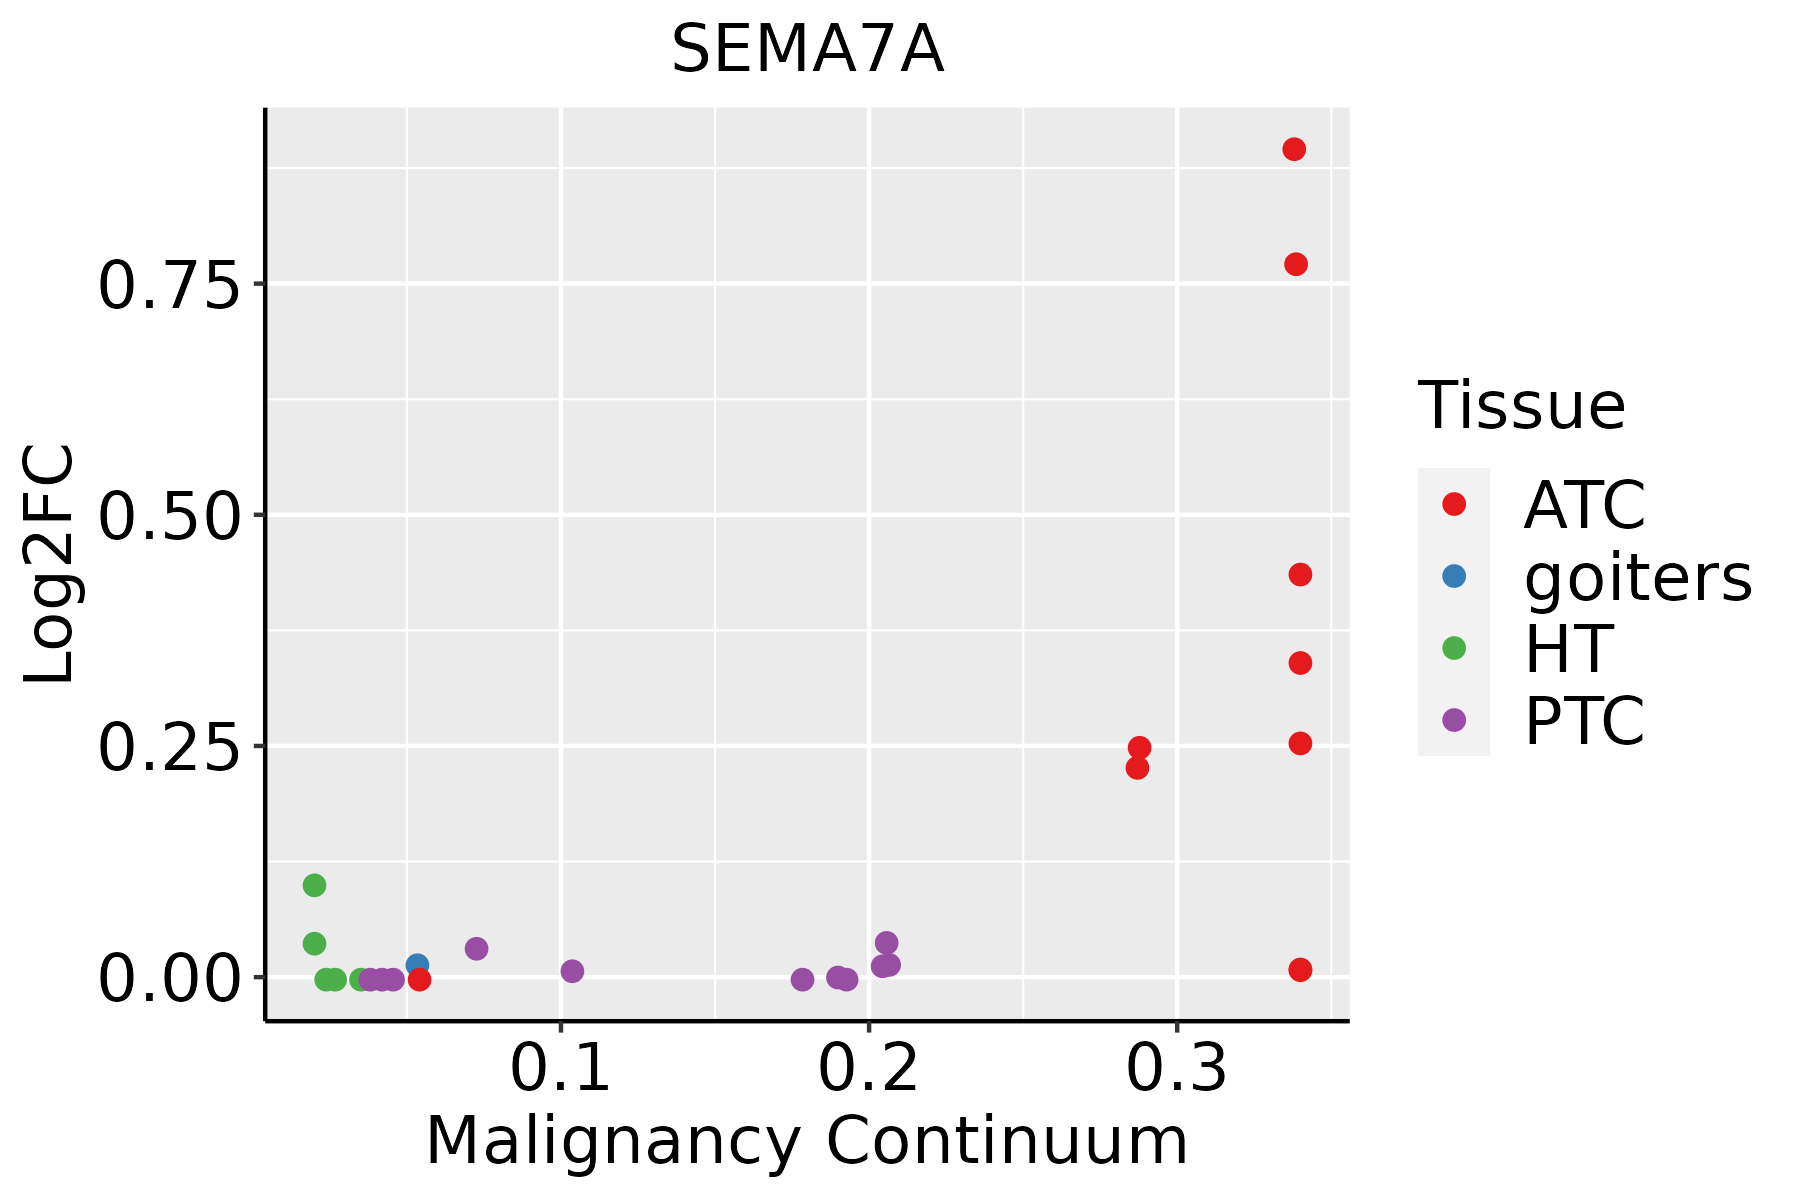 | ATC: Anaplastic thyroid cancer |
| HT: Hashimoto's thyroiditis | ||
| PTC: Papillary thyroid cancer |
| ∗log2FC in expression of this searched gene in stem-like cells from each diseased tissue sample relative to stem-like cells in normal samples in each tissue plotted against the malignancy continuum. Samples are colored based on if they are from different disease stage. |
Top |
Malignant transformation related pathway analysis |
| Find out the enriched GO biological processes and KEGG pathways involved in transition from healthy to precancer to cancer |
| Tissue | Disease Stage | Enriched GO biological Processes |
| Colorectum | AD |  |
| Colorectum | SER |  |
| Colorectum | MSS |  |
| Colorectum | MSI-H |  |
| Colorectum | FAP |  |
| ∗Top 15 enriched GO BP terms are showed in the bar plot of each disease state in each tissue. Each row represents a significant GO biological process which is colored according to the -log10(p.adjust). |
| Page: 1 2 3 4 5 6 7 8 9 |
| GO ID | Tissue | Disease Stage | Description | Gene Ratio | Bg Ratio | pvalue | p.adjust | Count |
| GO:001604927 | Thyroid | ATC | cell growth | 241/6293 | 482/18723 | 4.27e-14 | 2.35e-12 | 241 |
| GO:003134623 | Thyroid | ATC | positive regulation of cell projection organization | 186/6293 | 353/18723 | 7.99e-14 | 4.23e-12 | 186 |
| GO:000150332 | Thyroid | ATC | ossification | 206/6293 | 408/18723 | 9.23e-13 | 3.95e-11 | 206 |
| GO:003253526 | Thyroid | ATC | regulation of cellular component size | 191/6293 | 383/18723 | 2.51e-11 | 8.69e-10 | 191 |
| GO:000166731 | Thyroid | ATC | ameboidal-type cell migration | 228/6293 | 475/18723 | 3.72e-11 | 1.22e-09 | 228 |
| GO:000155826 | Thyroid | ATC | regulation of cell growth | 201/6293 | 414/18723 | 1.57e-10 | 4.76e-09 | 201 |
| GO:001097523 | Thyroid | ATC | regulation of neuron projection development | 212/6293 | 445/18723 | 4.16e-10 | 1.14e-08 | 212 |
| GO:000164932 | Thyroid | ATC | osteoblast differentiation | 122/6293 | 229/18723 | 6.04e-10 | 1.60e-08 | 122 |
| GO:006156423 | Thyroid | ATC | axon development | 220/6293 | 467/18723 | 6.85e-10 | 1.80e-08 | 220 |
| GO:000740919 | Thyroid | ATC | axonogenesis | 197/6293 | 418/18723 | 5.09e-09 | 1.13e-07 | 197 |
| GO:001072022 | Thyroid | ATC | positive regulation of cell development | 146/6293 | 298/18723 | 2.36e-08 | 4.56e-07 | 146 |
| GO:000722919 | Thyroid | ATC | integrin-mediated signaling pathway | 63/6293 | 107/18723 | 7.09e-08 | 1.24e-06 | 63 |
| GO:004867522 | Thyroid | ATC | axon extension | 68/6293 | 120/18723 | 1.73e-07 | 2.75e-06 | 68 |
| GO:005076922 | Thyroid | ATC | positive regulation of neurogenesis | 112/6293 | 225/18723 | 3.53e-07 | 5.21e-06 | 112 |
| GO:005076723 | Thyroid | ATC | regulation of neurogenesis | 168/6293 | 364/18723 | 3.73e-07 | 5.48e-06 | 168 |
| GO:004876221 | Thyroid | ATC | mesenchymal cell differentiation | 116/6293 | 236/18723 | 5.08e-07 | 7.30e-06 | 116 |
| GO:004577314 | Thyroid | ATC | positive regulation of axon extension | 30/6293 | 42/18723 | 6.06e-07 | 8.44e-06 | 30 |
| GO:199013824 | Thyroid | ATC | neuron projection extension | 89/6293 | 172/18723 | 6.63e-07 | 9.13e-06 | 89 |
| GO:005077213 | Thyroid | ATC | positive regulation of axonogenesis | 48/6293 | 79/18723 | 6.89e-07 | 9.35e-06 | 48 |
| GO:004858823 | Thyroid | ATC | developmental cell growth | 114/6293 | 234/18723 | 1.11e-06 | 1.44e-05 | 114 |
| Page: 1 2 3 |
| Pathway ID | Tissue | Disease Stage | Description | Gene Ratio | Bg Ratio | pvalue | p.adjust | qvalue | Count |
| Page: 1 |
Top |
Cell-cell communication analysis |
| Identification of potential cell-cell interactions between two cell types and their ligand-receptor pairs for different disease states |
| Ligand | Receptor | LRpair | Pathway | Tissue | Disease Stage |
| SEMA7A | ITGB1_ITGA1 | SEMA7A_ITGB1_ITGA1 | SEMA7 | Breast | DCIS |
| SEMA7A | PLXNC1 | SEMA7A_PLXNC1 | SEMA7 | Breast | DCIS |
| SEMA7A | ITGB1_ITGA1 | SEMA7A_ITGB1_ITGA1 | SEMA7 | Breast | Precancer |
| SEMA7A | ITGB1_ITGA1 | SEMA7A_ITGB1_ITGA1 | SEMA7 | CRC | AD |
| SEMA7A | PLXNC1 | SEMA7A_PLXNC1 | SEMA7 | CRC | AD |
| SEMA7A | ITGB1_ITGA1 | SEMA7A_ITGB1_ITGA1 | SEMA7 | Endometrium | AEH |
| SEMA7A | PLXNC1 | SEMA7A_PLXNC1 | SEMA7 | Endometrium | AEH |
| SEMA7A | ITGB1_ITGA1 | SEMA7A_ITGB1_ITGA1 | SEMA7 | Esophagus | ESCC |
| SEMA7A | PLXNC1 | SEMA7A_PLXNC1 | SEMA7 | Esophagus | ESCC |
| SEMA7A | ITGB1_ITGA1 | SEMA7A_ITGB1_ITGA1 | SEMA7 | HNSCC | ADJ |
| SEMA7A | ITGB1_ITGA1 | SEMA7A_ITGB1_ITGA1 | SEMA7 | HNSCC | OSCC |
| SEMA7A | PLXNC1 | SEMA7A_PLXNC1 | SEMA7 | HNSCC | OSCC |
| SEMA7A | ITGB1_ITGA1 | SEMA7A_ITGB1_ITGA1 | SEMA7 | HNSCC | Precancer |
| SEMA7A | PLXNC1 | SEMA7A_PLXNC1 | SEMA7 | HNSCC | Precancer |
| SEMA7A | ITGB1_ITGA1 | SEMA7A_ITGB1_ITGA1 | SEMA7 | Lung | AAH |
| SEMA7A | PLXNC1 | SEMA7A_PLXNC1 | SEMA7 | Lung | AAH |
| SEMA7A | ITGB1_ITGA1 | SEMA7A_ITGB1_ITGA1 | SEMA7 | Lung | ADJ |
| SEMA7A | PLXNC1 | SEMA7A_PLXNC1 | SEMA7 | Lung | ADJ |
| SEMA7A | ITGB1_ITGA1 | SEMA7A_ITGB1_ITGA1 | SEMA7 | Lung | IAC |
| SEMA7A | PLXNC1 | SEMA7A_PLXNC1 | SEMA7 | Lung | IAC |
| Page: 1 2 |
Top |
Single-cell gene regulatory network inference analysis |
| Find out the significant the regulons (TFs) and the target genes of each regulon across cell types for different disease states |
| TF | Cell Type | Tissue | Disease Stage | Target Gene | RSS | Regulon Activity |
| ∗The dot plots of a searched regulon are shown for all cell subpopulations in each disease state of each tissue based on the regulon specific score inferred using pySCENIC and by calculating the average expression. |
| Page: 1 |
Top |
Somatic mutation of malignant transformation related genes |
| Annotation of somatic variants for genes involved in malignant transformation |
| Hugo Symbol | Variant Class | Variant Classification | dbSNP RS | HGVSc | HGVSp | HGVSp Short | SWISSPROT | BIOTYPE | SIFT | PolyPhen | Tumor Sample Barcode | Tissue | Histology | Sex | Age | Stage | Therapy Types | Drugs | Outcome |
| SEMA7A | SNV | Missense_Mutation | novel | c.1727C>T | p.Ser576Leu | p.S576L | O75326 | protein_coding | tolerated(0.79) | benign(0.015) | TCGA-BH-A0HF-01 | Breast | breast invasive carcinoma | Female | >=65 | I/II | Hormone Therapy | arimidex | SD |
| SEMA7A | SNV | Missense_Mutation | c.1339N>T | p.His447Tyr | p.H447Y | O75326 | protein_coding | tolerated(0.17) | benign(0.099) | TCGA-E2-A1IN-01 | Breast | breast invasive carcinoma | Female | <65 | I/II | Hormone Therapy | arimidex | SD | |
| SEMA7A | insertion | Frame_Shift_Ins | novel | c.1173_1174insT | p.Glu392Ter | p.E392* | O75326 | protein_coding | TCGA-A8-A09A-01 | Breast | breast invasive carcinoma | Female | <65 | I/II | Hormone Therapy | tamoxiphen | SD | ||
| SEMA7A | SNV | Missense_Mutation | rs759619677 | c.526N>A | p.Glu176Lys | p.E176K | O75326 | protein_coding | tolerated(0.3) | benign(0.164) | TCGA-2W-A8YY-01 | Cervix | cervical & endocervical cancer | Female | <65 | I/II | Chemotherapy | cisplatin | CR |
| SEMA7A | SNV | Missense_Mutation | rs373206524 | c.1237N>A | p.Val413Ile | p.V413I | O75326 | protein_coding | deleterious(0.01) | probably_damaging(0.954) | TCGA-CM-5341-01 | Colorectum | colon adenocarcinoma | Female | >=65 | III/IV | Chemotherapy | fluorouracil | SD |
| SEMA7A | SNV | Missense_Mutation | c.1825N>A | p.Gly609Ser | p.G609S | O75326 | protein_coding | deleterious(0) | probably_damaging(1) | TCGA-D5-6540-01 | Colorectum | colon adenocarcinoma | Male | >=65 | I/II | Unknown | Unknown | SD | |
| SEMA7A | SNV | Missense_Mutation | rs778351405 | c.575N>A | p.Arg192Gln | p.R192Q | O75326 | protein_coding | tolerated(0.21) | possibly_damaging(0.571) | TCGA-AG-3581-01 | Colorectum | rectum adenocarcinoma | Male | <65 | I/II | Unknown | Unknown | SD |
| SEMA7A | SNV | Missense_Mutation | rs371438755 | c.1717N>A | p.Ala573Thr | p.A573T | O75326 | protein_coding | deleterious(0) | probably_damaging(0.999) | TCGA-EI-6507-01 | Colorectum | rectum adenocarcinoma | Male | <65 | I/II | Unknown | Unknown | SD |
| SEMA7A | SNV | Missense_Mutation | novel | c.1288N>G | p.Thr430Ala | p.T430A | O75326 | protein_coding | tolerated(0.85) | benign(0.006) | TCGA-F5-6814-01 | Colorectum | rectum adenocarcinoma | Male | <65 | I/II | Unknown | Unknown | SD |
| SEMA7A | SNV | Missense_Mutation | novel | c.1679N>T | p.Ser560Phe | p.S560F | O75326 | protein_coding | deleterious(0) | probably_damaging(0.997) | TCGA-A5-A0G2-01 | Endometrium | uterine corpus endometrioid carcinoma | Female | <65 | III/IV | Unknown | Unknown | SD |
| Page: 1 2 3 4 5 6 7 8 |
Top |
Related drugs of malignant transformation related genes |
| Identification of chemicals and drugs interact with genes involved in malignant transfromation |
| (DGIdb 4.0) |
| Entrez ID | Symbol | Category | Interaction Types | Drug Claim Name | Drug Name | PMIDs |
| Page: 1 |

Copyright 2023-Present -The University of Texas Health Science Center at Houston |