
|
|||||
|
 | |
| |
| |
| |
| |
| |
|
Gene: SEMA6D |
Gene summary for SEMA6D |
| Gene information | Species | Human | Gene symbol | SEMA6D | Gene ID | 80031 |
| Gene name | semaphorin 6D | |
| Gene Alias | SEMA6D | |
| Cytomap | 15q21.1 | |
| Gene Type | protein-coding | GO ID | GO:0000902 | UniProtAcc | Q8NFY4 |
Top |
Malignant transformation analysis |
| Identification of the aberrant gene expression in precancerous and cancerous lesions by comparing the gene expression of stem-like cells in diseased tissues with normal stem cells |
| Entrez ID | Symbol | Replicates | Species | Organ | Tissue | Adj P-value | Log2FC | Malignancy |
| 80031 | SEMA6D | HTA11_347_2000001011 | Human | Colorectum | AD | 1.20e-06 | 4.24e-01 | -0.1954 |
| 80031 | SEMA6D | A002-C-205 | Human | Colorectum | FAP | 4.85e-02 | -1.16e-01 | -0.1236 |
| 80031 | SEMA6D | A002-C-116 | Human | Colorectum | FAP | 3.82e-02 | -9.41e-02 | -0.0452 |
| 80031 | SEMA6D | LZE4T | Human | Esophagus | ESCC | 1.20e-04 | 1.93e-01 | 0.0811 |
| 80031 | SEMA6D | P2T-E | Human | Esophagus | ESCC | 8.40e-04 | 1.18e-01 | 0.1177 |
| 80031 | SEMA6D | P9T-E | Human | Esophagus | ESCC | 4.01e-04 | 1.49e-01 | 0.1131 |
| 80031 | SEMA6D | P10T-E | Human | Esophagus | ESCC | 2.02e-06 | 1.75e-01 | 0.116 |
| 80031 | SEMA6D | P11T-E | Human | Esophagus | ESCC | 1.20e-09 | 4.28e-01 | 0.1426 |
| 80031 | SEMA6D | P12T-E | Human | Esophagus | ESCC | 5.00e-17 | 3.93e-01 | 0.1122 |
| 80031 | SEMA6D | P15T-E | Human | Esophagus | ESCC | 4.01e-11 | 3.00e-01 | 0.1149 |
| 80031 | SEMA6D | P16T-E | Human | Esophagus | ESCC | 4.17e-05 | 1.62e-01 | 0.1153 |
| 80031 | SEMA6D | P19T-E | Human | Esophagus | ESCC | 1.65e-10 | 6.23e-01 | 0.1662 |
| 80031 | SEMA6D | P22T-E | Human | Esophagus | ESCC | 2.02e-06 | 1.53e-01 | 0.1236 |
| 80031 | SEMA6D | P23T-E | Human | Esophagus | ESCC | 2.89e-02 | 1.11e-01 | 0.108 |
| 80031 | SEMA6D | P26T-E | Human | Esophagus | ESCC | 1.85e-18 | 3.75e-01 | 0.1276 |
| 80031 | SEMA6D | P27T-E | Human | Esophagus | ESCC | 1.78e-03 | 1.15e-01 | 0.1055 |
| 80031 | SEMA6D | P28T-E | Human | Esophagus | ESCC | 4.40e-09 | 1.86e-01 | 0.1149 |
| 80031 | SEMA6D | P30T-E | Human | Esophagus | ESCC | 4.41e-11 | 4.61e-01 | 0.137 |
| 80031 | SEMA6D | P39T-E | Human | Esophagus | ESCC | 9.20e-06 | 1.52e-01 | 0.0894 |
| 80031 | SEMA6D | P42T-E | Human | Esophagus | ESCC | 9.46e-03 | 1.52e-01 | 0.1175 |
| Page: 1 2 |
| Tissue | Expression Dynamics | Abbreviation |
| Colorectum (GSE201348) | 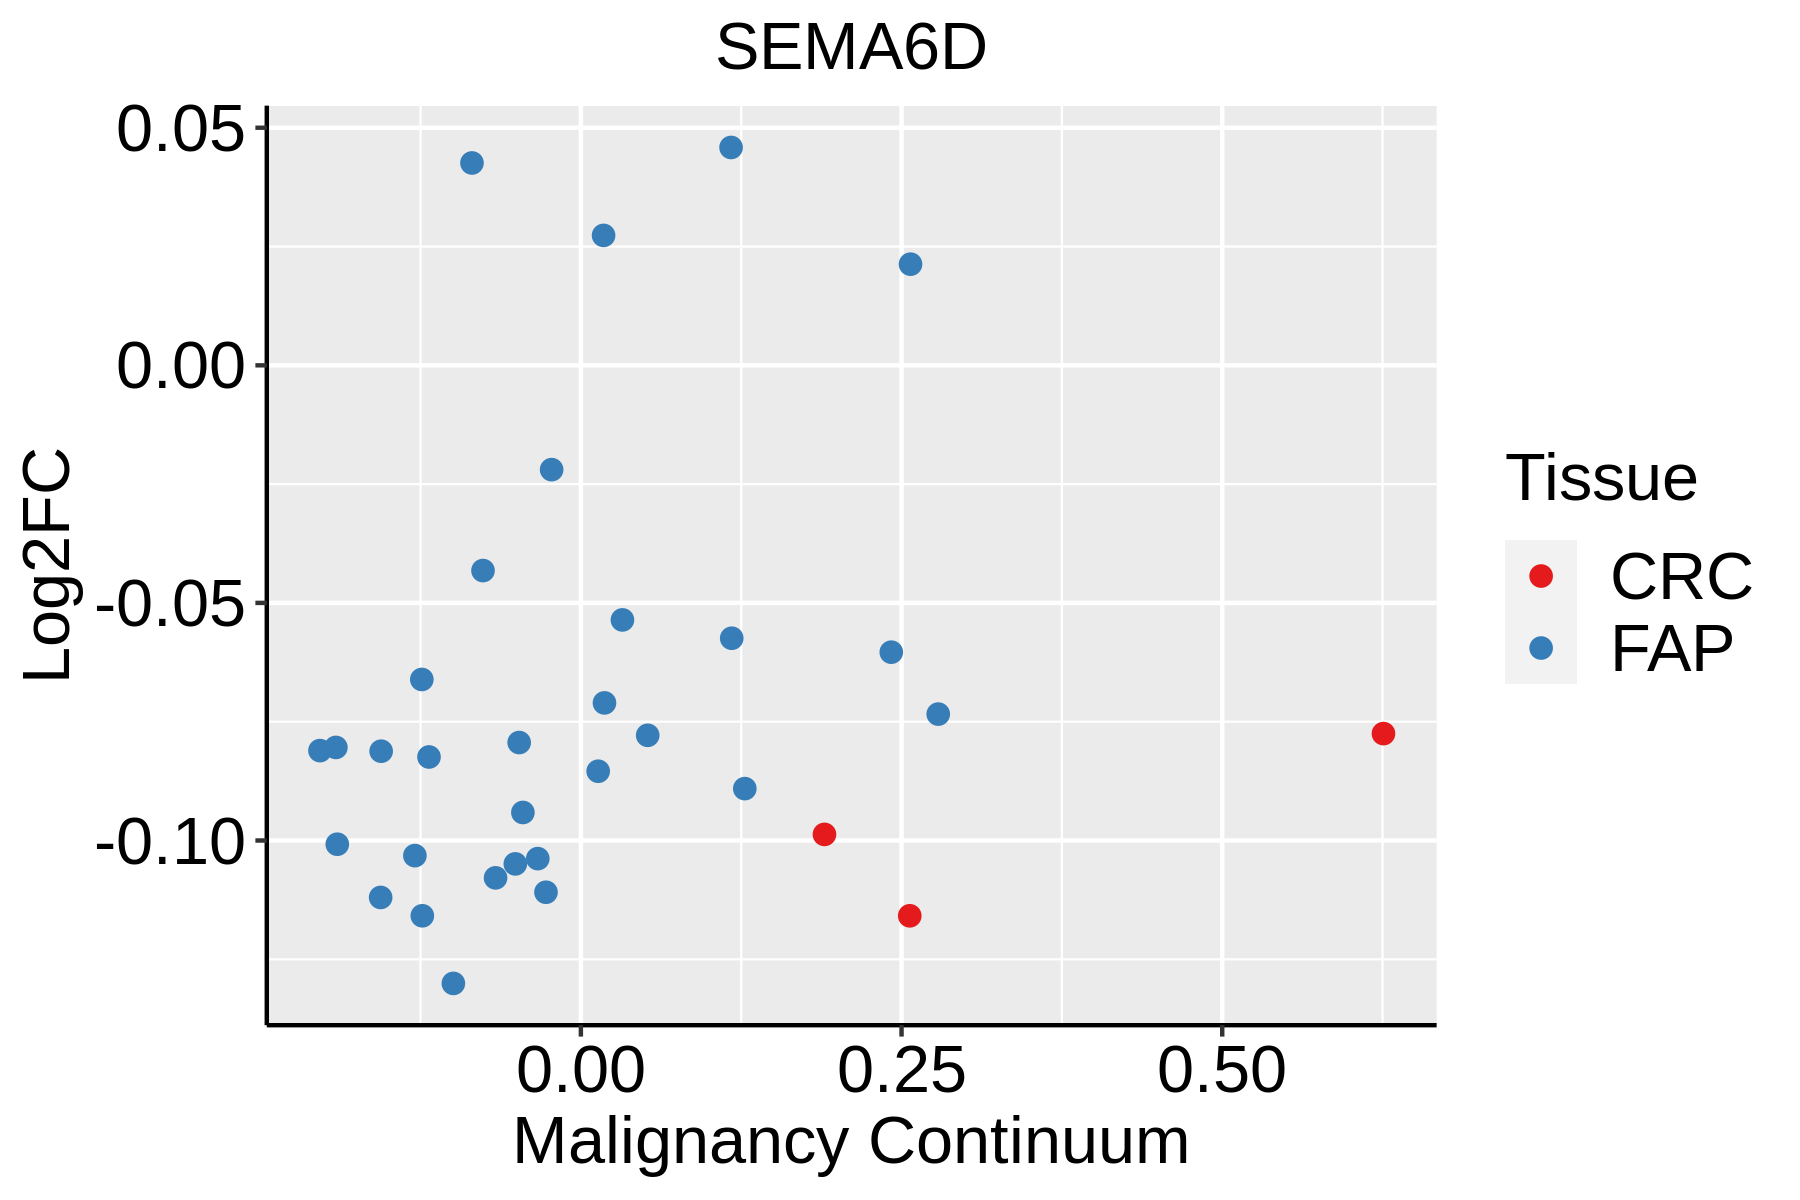 | FAP: Familial adenomatous polyposis |
| CRC: Colorectal cancer | ||
| Colorectum (HTA11) |  | AD: Adenomas |
| SER: Sessile serrated lesions | ||
| MSI-H: Microsatellite-high colorectal cancer | ||
| MSS: Microsatellite stable colorectal cancer | ||
| Esophagus |  | ESCC: Esophageal squamous cell carcinoma |
| HGIN: High-grade intraepithelial neoplasias | ||
| LGIN: Low-grade intraepithelial neoplasias |
| ∗log2FC in expression of this searched gene in stem-like cells from each diseased tissue sample relative to stem-like cells in normal samples in each tissue plotted against the malignancy continuum. Samples are colored based on if they are from different disease stage. |
Top |
Malignant transformation related pathway analysis |
| Find out the enriched GO biological processes and KEGG pathways involved in transition from healthy to precancer to cancer |
| Tissue | Disease Stage | Enriched GO biological Processes |
| Colorectum | AD |  |
| Colorectum | SER |  |
| Colorectum | MSS |  |
| Colorectum | MSI-H |  |
| Colorectum | FAP |  |
| ∗Top 15 enriched GO BP terms are showed in the bar plot of each disease state in each tissue. Each row represents a significant GO biological process which is colored according to the -log10(p.adjust). |
| Page: 1 2 3 4 5 6 7 8 9 |
| GO ID | Tissue | Disease Stage | Description | Gene Ratio | Bg Ratio | pvalue | p.adjust | Count |
| GO:0032535 | Colorectum | AD | regulation of cellular component size | 142/3918 | 383/18723 | 1.74e-13 | 3.41e-11 | 142 |
| GO:0016049 | Colorectum | AD | cell growth | 143/3918 | 482/18723 | 2.83e-06 | 8.09e-05 | 143 |
| GO:0001558 | Colorectum | AD | regulation of cell growth | 124/3918 | 414/18723 | 7.67e-06 | 1.86e-04 | 124 |
| GO:0001667 | Colorectum | AD | ameboidal-type cell migration | 137/3918 | 475/18723 | 2.17e-05 | 4.33e-04 | 137 |
| GO:0010975 | Colorectum | AD | regulation of neuron projection development | 129/3918 | 445/18723 | 2.88e-05 | 5.37e-04 | 129 |
| GO:0007409 | Colorectum | AD | axonogenesis | 122/3918 | 418/18723 | 3.36e-05 | 6.15e-04 | 122 |
| GO:0061564 | Colorectum | AD | axon development | 132/3918 | 467/18723 | 8.40e-05 | 1.31e-03 | 132 |
| GO:0031345 | Colorectum | AD | negative regulation of cell projection organization | 58/3918 | 186/18723 | 6.37e-04 | 6.58e-03 | 58 |
| GO:0008361 | Colorectum | AD | regulation of cell size | 56/3918 | 181/18723 | 9.61e-04 | 9.07e-03 | 56 |
| GO:0050770 | Colorectum | AD | regulation of axonogenesis | 49/3918 | 154/18723 | 9.88e-04 | 9.28e-03 | 49 |
| GO:0048638 | Colorectum | AD | regulation of developmental growth | 92/3918 | 330/18723 | 1.48e-03 | 1.25e-02 | 92 |
| GO:0050767 | Colorectum | AD | regulation of neurogenesis | 99/3918 | 364/18723 | 2.35e-03 | 1.82e-02 | 99 |
| GO:0030516 | Colorectum | AD | regulation of axon extension | 32/3918 | 95/18723 | 2.59e-03 | 1.96e-02 | 32 |
| GO:0010977 | Colorectum | AD | negative regulation of neuron projection development | 43/3918 | 137/18723 | 2.60e-03 | 1.97e-02 | 43 |
| GO:0048588 | Colorectum | AD | developmental cell growth | 67/3918 | 234/18723 | 3.03e-03 | 2.25e-02 | 67 |
| GO:0048675 | Colorectum | AD | axon extension | 38/3918 | 120/18723 | 3.76e-03 | 2.65e-02 | 38 |
| GO:0045926 | Colorectum | AD | negative regulation of growth | 70/3918 | 249/18723 | 4.07e-03 | 2.83e-02 | 70 |
| GO:0060560 | Colorectum | AD | developmental growth involved in morphogenesis | 66/3918 | 234/18723 | 4.75e-03 | 3.22e-02 | 66 |
| GO:0007411 | Colorectum | AD | axon guidance | 64/3918 | 227/18723 | 5.41e-03 | 3.55e-02 | 64 |
| GO:0097485 | Colorectum | AD | neuron projection guidance | 64/3918 | 228/18723 | 6.02e-03 | 3.78e-02 | 64 |
| Page: 1 2 3 4 |
| Pathway ID | Tissue | Disease Stage | Description | Gene Ratio | Bg Ratio | pvalue | p.adjust | qvalue | Count |
| hsa04360 | Colorectum | AD | Axon guidance | 61/2092 | 182/8465 | 4.36e-03 | 2.17e-02 | 1.38e-02 | 61 |
| hsa043601 | Colorectum | AD | Axon guidance | 61/2092 | 182/8465 | 4.36e-03 | 2.17e-02 | 1.38e-02 | 61 |
| hsa043604 | Colorectum | FAP | Axon guidance | 47/1404 | 182/8465 | 9.09e-04 | 5.20e-03 | 3.16e-03 | 47 |
| hsa043605 | Colorectum | FAP | Axon guidance | 47/1404 | 182/8465 | 9.09e-04 | 5.20e-03 | 3.16e-03 | 47 |
| hsa0436016 | Esophagus | ESCC | Axon guidance | 108/4205 | 182/8465 | 5.13e-03 | 1.30e-02 | 6.67e-03 | 108 |
| hsa0436017 | Esophagus | ESCC | Axon guidance | 108/4205 | 182/8465 | 5.13e-03 | 1.30e-02 | 6.67e-03 | 108 |
| Page: 1 |
Top |
Cell-cell communication analysis |
| Identification of potential cell-cell interactions between two cell types and their ligand-receptor pairs for different disease states |
| Ligand | Receptor | LRpair | Pathway | Tissue | Disease Stage |
| SEMA6D | PLXNA1 | SEMA6D_PLXNA1 | SEMA6 | HNSCC | Precancer |
| SEMA6D | PLXNA1 | SEMA6D_PLXNA1 | SEMA6 | Lung | AAH |
| Page: 1 |
Top |
Single-cell gene regulatory network inference analysis |
| Find out the significant the regulons (TFs) and the target genes of each regulon across cell types for different disease states |
| TF | Cell Type | Tissue | Disease Stage | Target Gene | RSS | Regulon Activity |
| ∗The dot plots of a searched regulon are shown for all cell subpopulations in each disease state of each tissue based on the regulon specific score inferred using pySCENIC and by calculating the average expression. |
| Page: 1 |
Top |
Somatic mutation of malignant transformation related genes |
| Annotation of somatic variants for genes involved in malignant transformation |
| Hugo Symbol | Variant Class | Variant Classification | dbSNP RS | HGVSc | HGVSp | HGVSp Short | SWISSPROT | BIOTYPE | SIFT | PolyPhen | Tumor Sample Barcode | Tissue | Histology | Sex | Age | Stage | Therapy Types | Drugs | Outcome |
| SEMA6D | SNV | Missense_Mutation | c.2308G>T | p.Ala770Ser | p.A770S | Q8NFY4 | protein_coding | deleterious(0.01) | probably_damaging(0.984) | TCGA-AN-A0FK-01 | Breast | breast invasive carcinoma | Female | >=65 | III/IV | Unknown | Unknown | SD | |
| SEMA6D | SNV | Missense_Mutation | novel | c.965G>A | p.Ser322Asn | p.S322N | Q8NFY4 | protein_coding | deleterious(0) | probably_damaging(0.999) | TCGA-AN-A0XN-01 | Breast | breast invasive carcinoma | Female | >=65 | III/IV | Unknown | Unknown | SD |
| SEMA6D | SNV | Missense_Mutation | novel | c.3011C>T | p.Pro1004Leu | p.P1004L | Q8NFY4 | protein_coding | deleterious(0.02) | benign(0.19) | TCGA-BH-A0HF-01 | Breast | breast invasive carcinoma | Female | >=65 | I/II | Hormone Therapy | arimidex | SD |
| SEMA6D | SNV | Missense_Mutation | c.1103N>A | p.Gly368Asp | p.G368D | Q8NFY4 | protein_coding | deleterious(0) | probably_damaging(0.998) | TCGA-D8-A1J8-01 | Breast | breast invasive carcinoma | Female | >=65 | I/II | Hormone Therapy | nolvadex | SD | |
| SEMA6D | insertion | Frame_Shift_Ins | novel | c.2526_2527insTTTGCAGCAATCCTGTATGTCTCTGGGGATCCTAGTTTGATTAAAG | p.Asn843PhefsTer23 | p.N843Ffs*23 | Q8NFY4 | protein_coding | TCGA-A2-A0EX-01 | Breast | breast invasive carcinoma | Female | <65 | I/II | Hormone Therapy | tamoxiphen | SD | ||
| SEMA6D | insertion | Nonsense_Mutation | novel | c.3170_3171insATAAA | p.Phe1058Ter | p.F1058* | Q8NFY4 | protein_coding | TCGA-A8-A07J-01 | Breast | breast invasive carcinoma | Female | <65 | I/II | Chemotherapy | 5-fluorouracil | CR | ||
| SEMA6D | insertion | Nonsense_Mutation | novel | c.3171_3172insTAATTTGCTCTTCTTTTTCTAGGTCTAATTTAAATAT | p.Phe1058Ter | p.F1058* | Q8NFY4 | protein_coding | TCGA-A8-A07J-01 | Breast | breast invasive carcinoma | Female | <65 | I/II | Chemotherapy | 5-fluorouracil | CR | ||
| SEMA6D | insertion | Frame_Shift_Ins | novel | c.2914_2915insCTGTCAAGGAATACCAACAGAATATTGATTCTCCTAA | p.His972ProfsTer20 | p.H972Pfs*20 | Q8NFY4 | protein_coding | TCGA-AN-A0FX-01 | Breast | breast invasive carcinoma | Female | <65 | I/II | Unknown | Unknown | SD | ||
| SEMA6D | insertion | In_Frame_Ins | novel | c.3129_3130insTTCAAGACCAGCCTGGCC | p.Lys1043_Arg1044insPheLysThrSerLeuAla | p.K1043_R1044insFKTSLA | Q8NFY4 | protein_coding | TCGA-AN-A0FX-01 | Breast | breast invasive carcinoma | Female | <65 | I/II | Unknown | Unknown | SD | ||
| SEMA6D | deletion | Frame_Shift_Del | c.325delN | p.Ala109LeufsTer2 | p.A109Lfs*2 | Q8NFY4 | protein_coding | TCGA-EW-A2FV-01 | Breast | breast invasive carcinoma | Female | <65 | III/IV | Chemotherapy | docetaxel | SD |
| Page: 1 2 3 4 5 6 7 8 9 10 11 12 13 14 15 16 17 18 19 20 |
Top |
Related drugs of malignant transformation related genes |
| Identification of chemicals and drugs interact with genes involved in malignant transfromation |
| (DGIdb 4.0) |
| Entrez ID | Symbol | Category | Interaction Types | Drug Claim Name | Drug Name | PMIDs |
| Page: 1 |

Copyright 2023-Present -The University of Texas Health Science Center at Houston |