
|
|||||
|
 | |
| |
| |
| |
| |
| |
|
Gene: SEMA6A |
Gene summary for SEMA6A |
| Gene information | Species | Human | Gene symbol | SEMA6A | Gene ID | 57556 |
| Gene name | semaphorin 6A | |
| Gene Alias | HT018 | |
| Cytomap | 5q23.1 | |
| Gene Type | protein-coding | GO ID | GO:0000165 | UniProtAcc | A0A0A0MQU6 |
Top |
Malignant transformation analysis |
| Identification of the aberrant gene expression in precancerous and cancerous lesions by comparing the gene expression of stem-like cells in diseased tissues with normal stem cells |
| Entrez ID | Symbol | Replicates | Species | Organ | Tissue | Adj P-value | Log2FC | Malignancy |
| 57556 | SEMA6A | GSM4909308 | Human | Breast | IDC | 9.24e-19 | 5.13e-01 | 0.158 |
| 57556 | SEMA6A | DCIS2 | Human | Breast | DCIS | 1.57e-51 | 5.10e-01 | 0.0085 |
| 57556 | SEMA6A | HTA11_3410_2000001011 | Human | Colorectum | AD | 3.14e-22 | -7.42e-01 | 0.0155 |
| 57556 | SEMA6A | HTA11_2951_2000001011 | Human | Colorectum | AD | 2.63e-04 | -9.48e-01 | 0.0216 |
| 57556 | SEMA6A | HTA11_1938_2000001011 | Human | Colorectum | AD | 3.38e-05 | -6.12e-01 | -0.0811 |
| 57556 | SEMA6A | HTA11_78_2000001011 | Human | Colorectum | AD | 2.61e-02 | -2.91e-01 | -0.1088 |
| 57556 | SEMA6A | HTA11_347_2000001011 | Human | Colorectum | AD | 5.29e-05 | 4.28e-01 | -0.1954 |
| 57556 | SEMA6A | HTA11_3361_2000001011 | Human | Colorectum | AD | 2.58e-12 | -7.71e-01 | -0.1207 |
| 57556 | SEMA6A | HTA11_696_2000001011 | Human | Colorectum | AD | 1.42e-04 | -4.47e-01 | -0.1464 |
| 57556 | SEMA6A | HTA11_866_2000001011 | Human | Colorectum | AD | 6.43e-06 | -4.38e-01 | -0.1001 |
| 57556 | SEMA6A | HTA11_1391_2000001011 | Human | Colorectum | AD | 4.76e-09 | -6.48e-01 | -0.059 |
| 57556 | SEMA6A | HTA11_866_3004761011 | Human | Colorectum | AD | 7.52e-17 | -7.71e-01 | 0.096 |
| 57556 | SEMA6A | HTA11_4255_2000001011 | Human | Colorectum | SER | 1.43e-03 | -7.75e-01 | 0.0446 |
| 57556 | SEMA6A | HTA11_9408_2000001011 | Human | Colorectum | AD | 2.63e-03 | -9.13e-01 | 0.0451 |
| 57556 | SEMA6A | HTA11_8622_2000001021 | Human | Colorectum | SER | 2.88e-08 | -9.27e-01 | 0.0528 |
| 57556 | SEMA6A | HTA11_10711_2000001011 | Human | Colorectum | AD | 7.80e-18 | -9.47e-01 | 0.0338 |
| 57556 | SEMA6A | HTA11_7696_3000711011 | Human | Colorectum | AD | 4.32e-29 | -8.29e-01 | 0.0674 |
| 57556 | SEMA6A | HTA11_6818_2000001011 | Human | Colorectum | AD | 1.02e-03 | -7.01e-01 | 0.0112 |
| 57556 | SEMA6A | HTA11_6818_2000001021 | Human | Colorectum | AD | 4.09e-15 | -9.65e-01 | 0.0588 |
| 57556 | SEMA6A | HTA11_99999970781_79442 | Human | Colorectum | MSS | 3.03e-45 | -9.83e-01 | 0.294 |
| Page: 1 2 3 4 5 |
| Tissue | Expression Dynamics | Abbreviation |
| Breast | 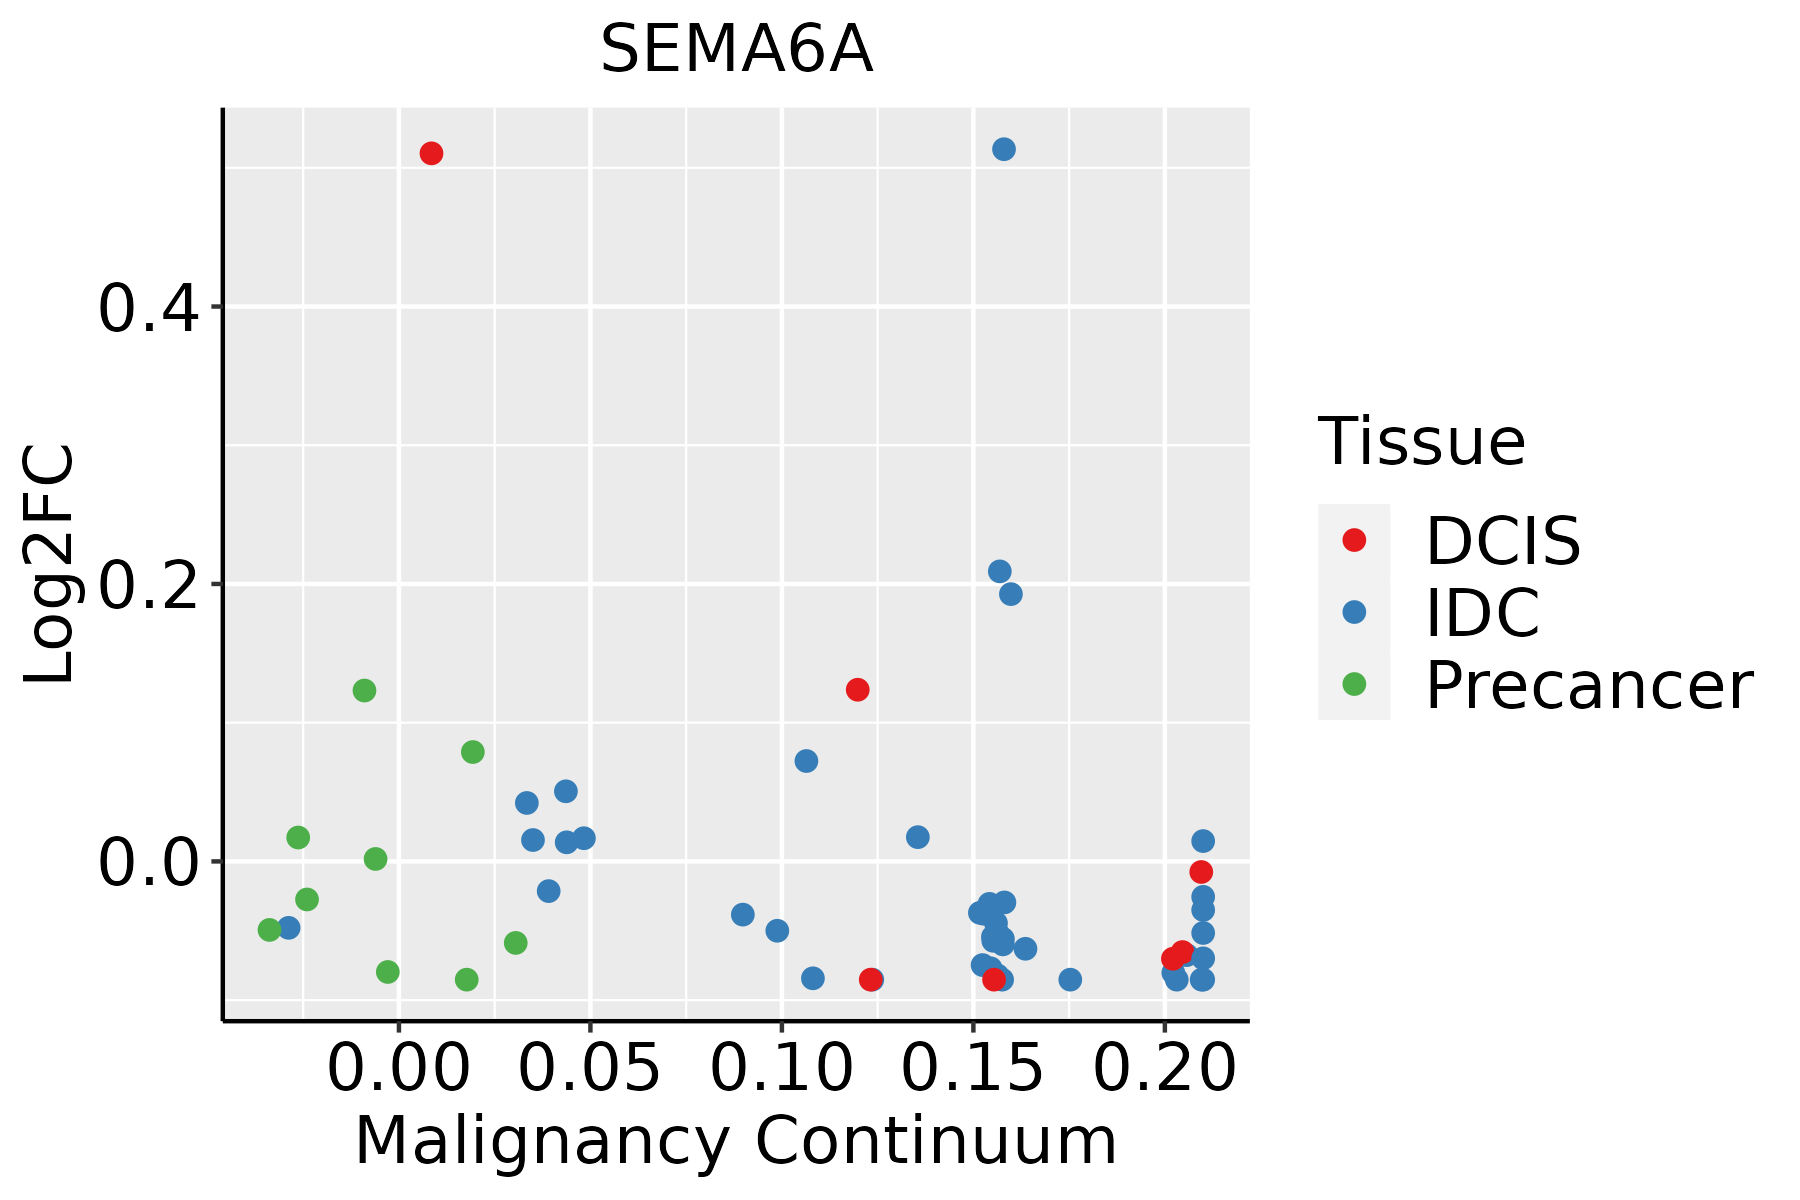 | IDC: Invasive ductal carcinoma |
| DCIS: Ductal carcinoma in situ | ||
| Precancer(BRCA1-mut): Precancerous lesion from BRCA1 mutation carriers | ||
| Colorectum (GSE201348) |  | FAP: Familial adenomatous polyposis |
| CRC: Colorectal cancer | ||
| Colorectum (HTA11) | 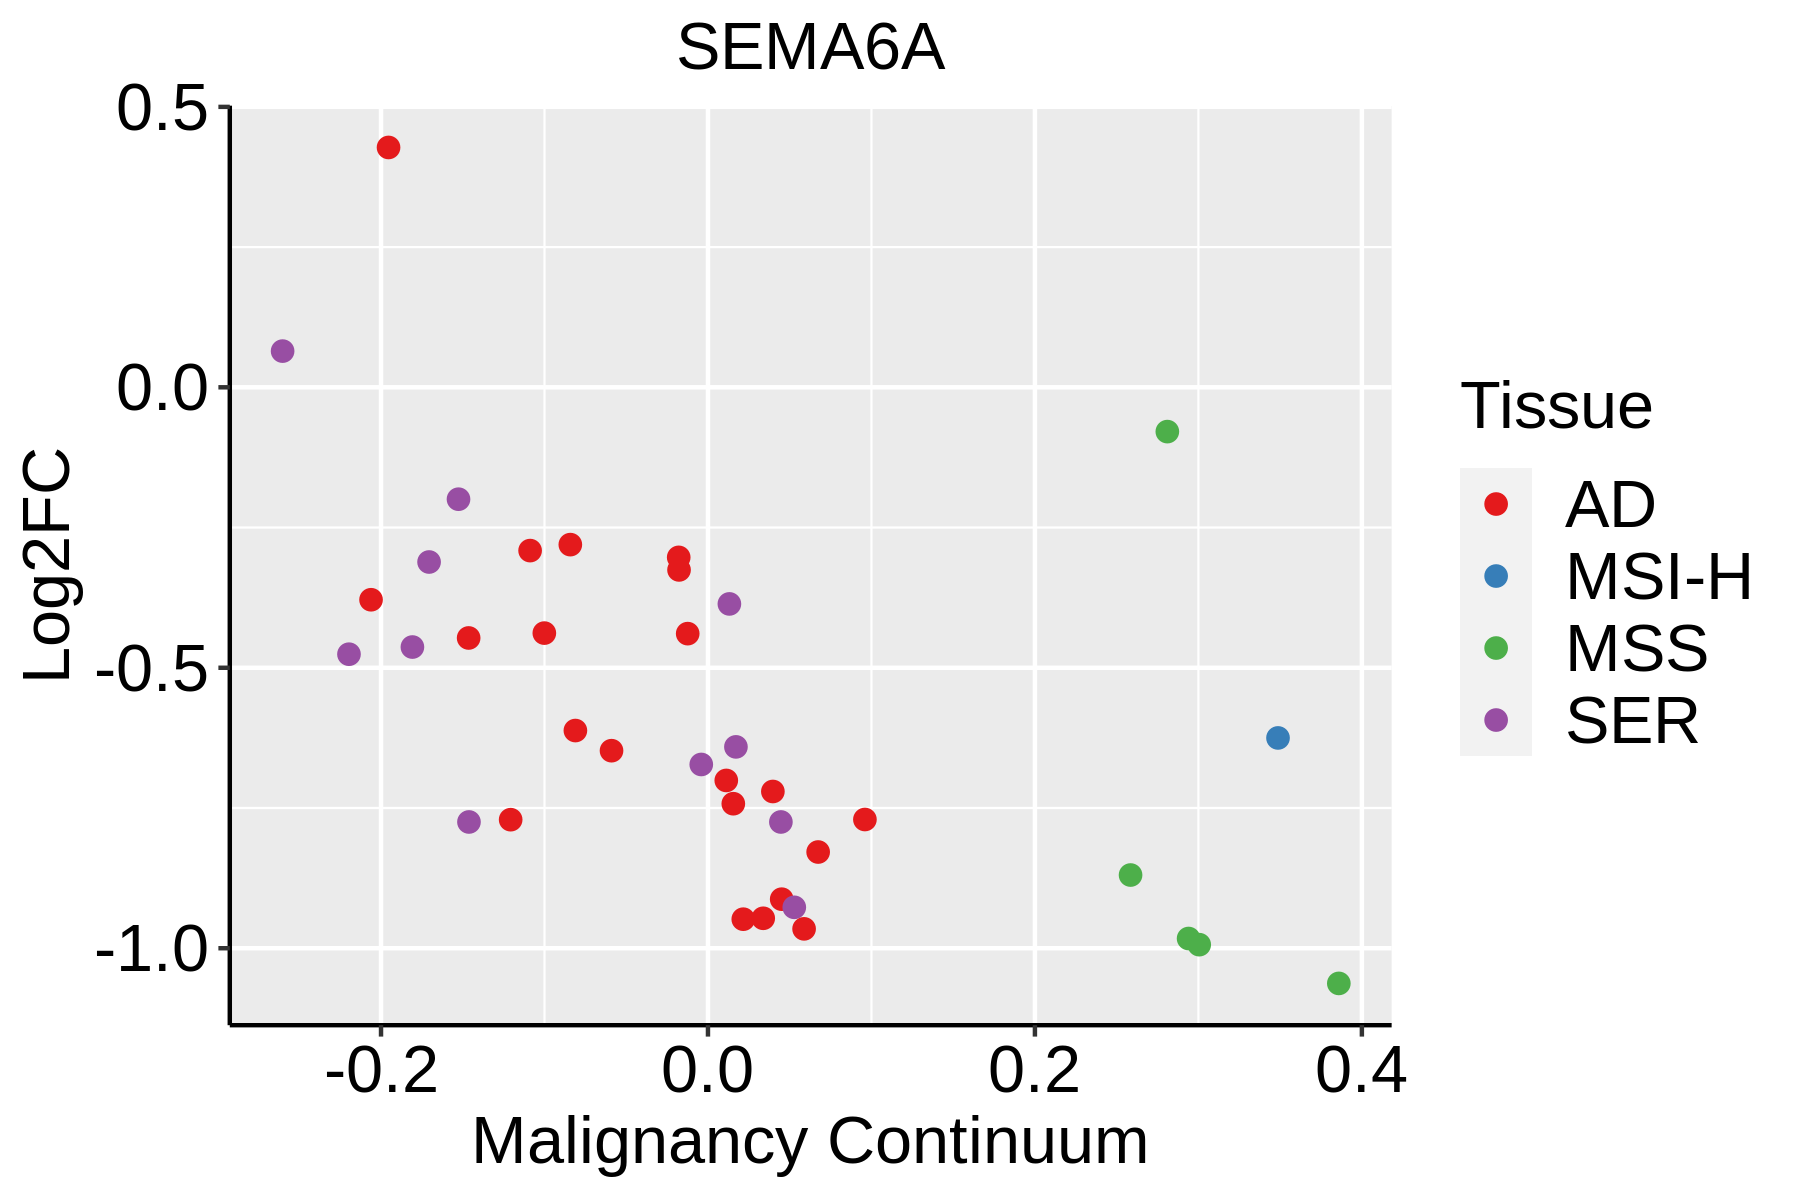 | AD: Adenomas |
| SER: Sessile serrated lesions | ||
| MSI-H: Microsatellite-high colorectal cancer | ||
| MSS: Microsatellite stable colorectal cancer | ||
| Esophagus | 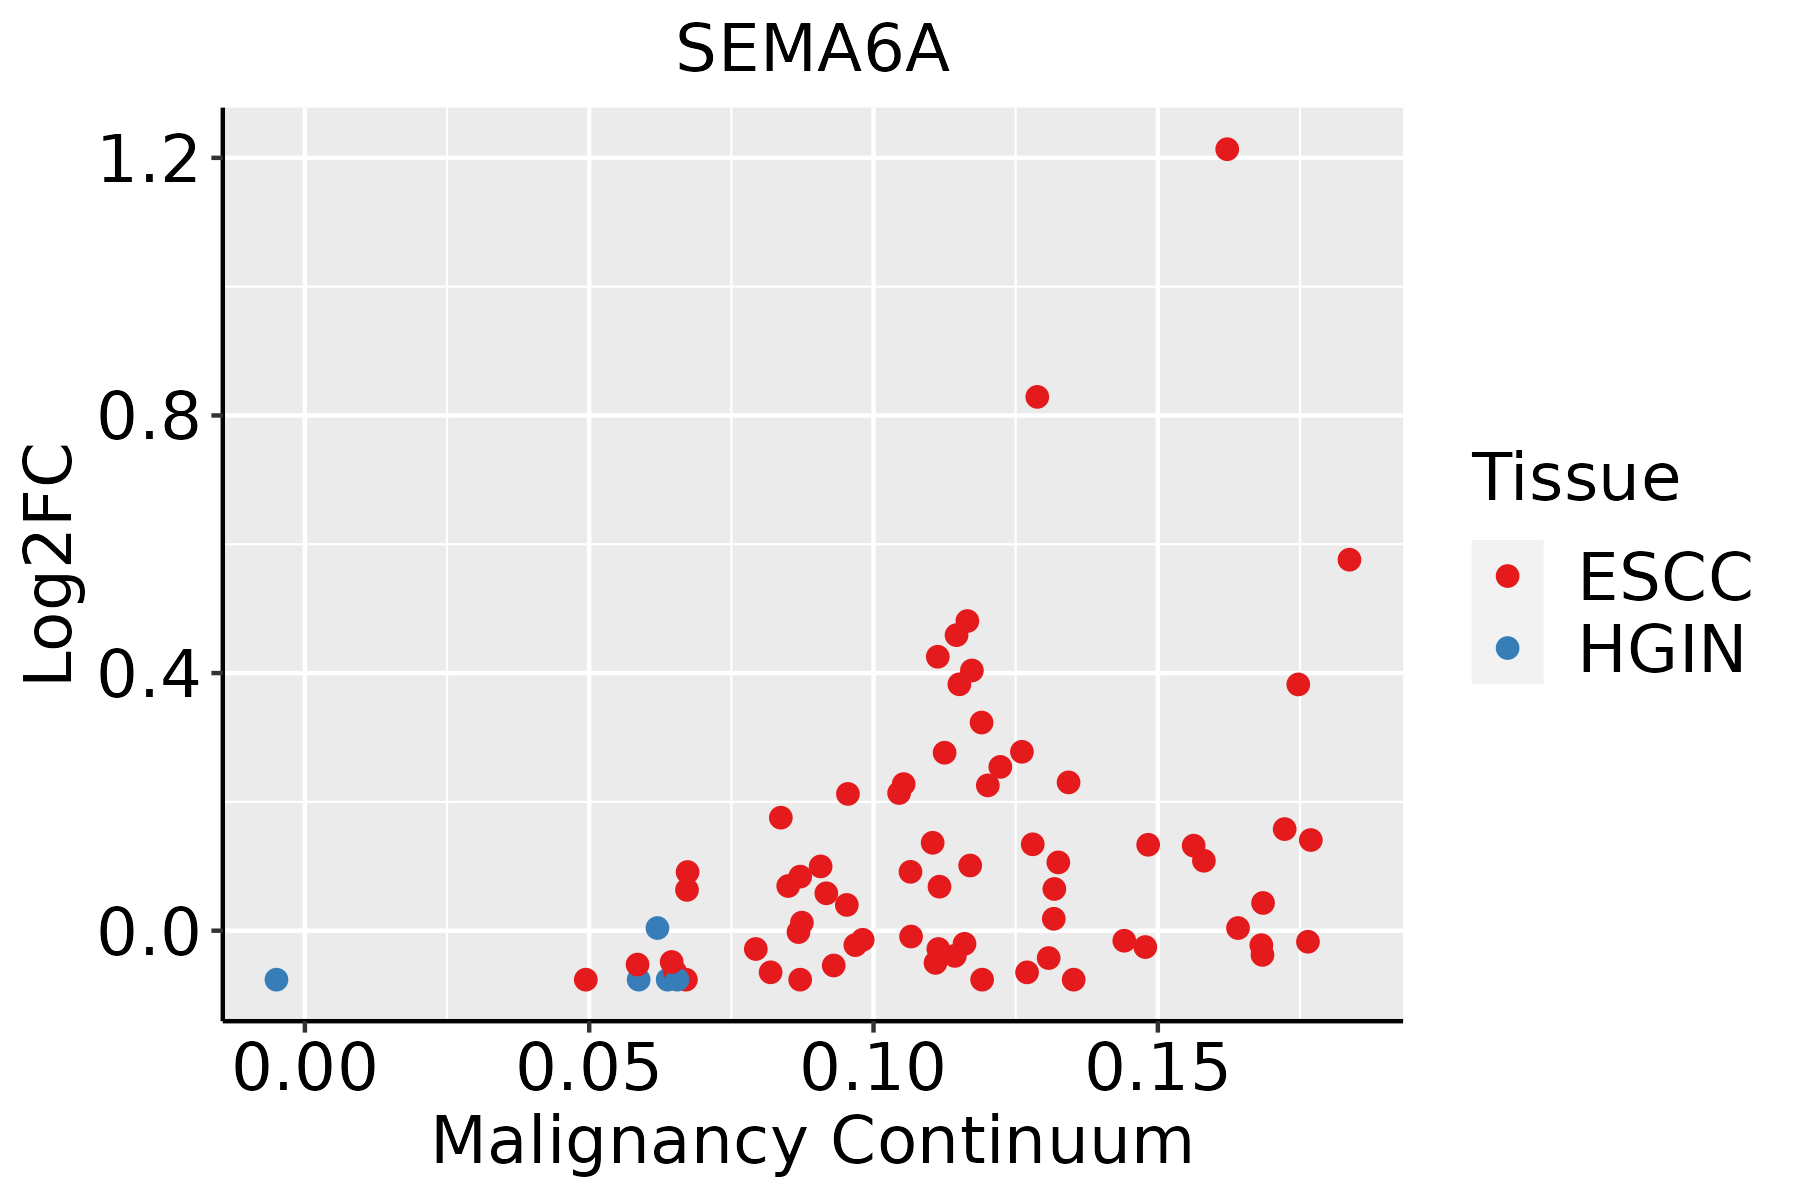 | ESCC: Esophageal squamous cell carcinoma |
| HGIN: High-grade intraepithelial neoplasias | ||
| LGIN: Low-grade intraepithelial neoplasias | ||
| GC | 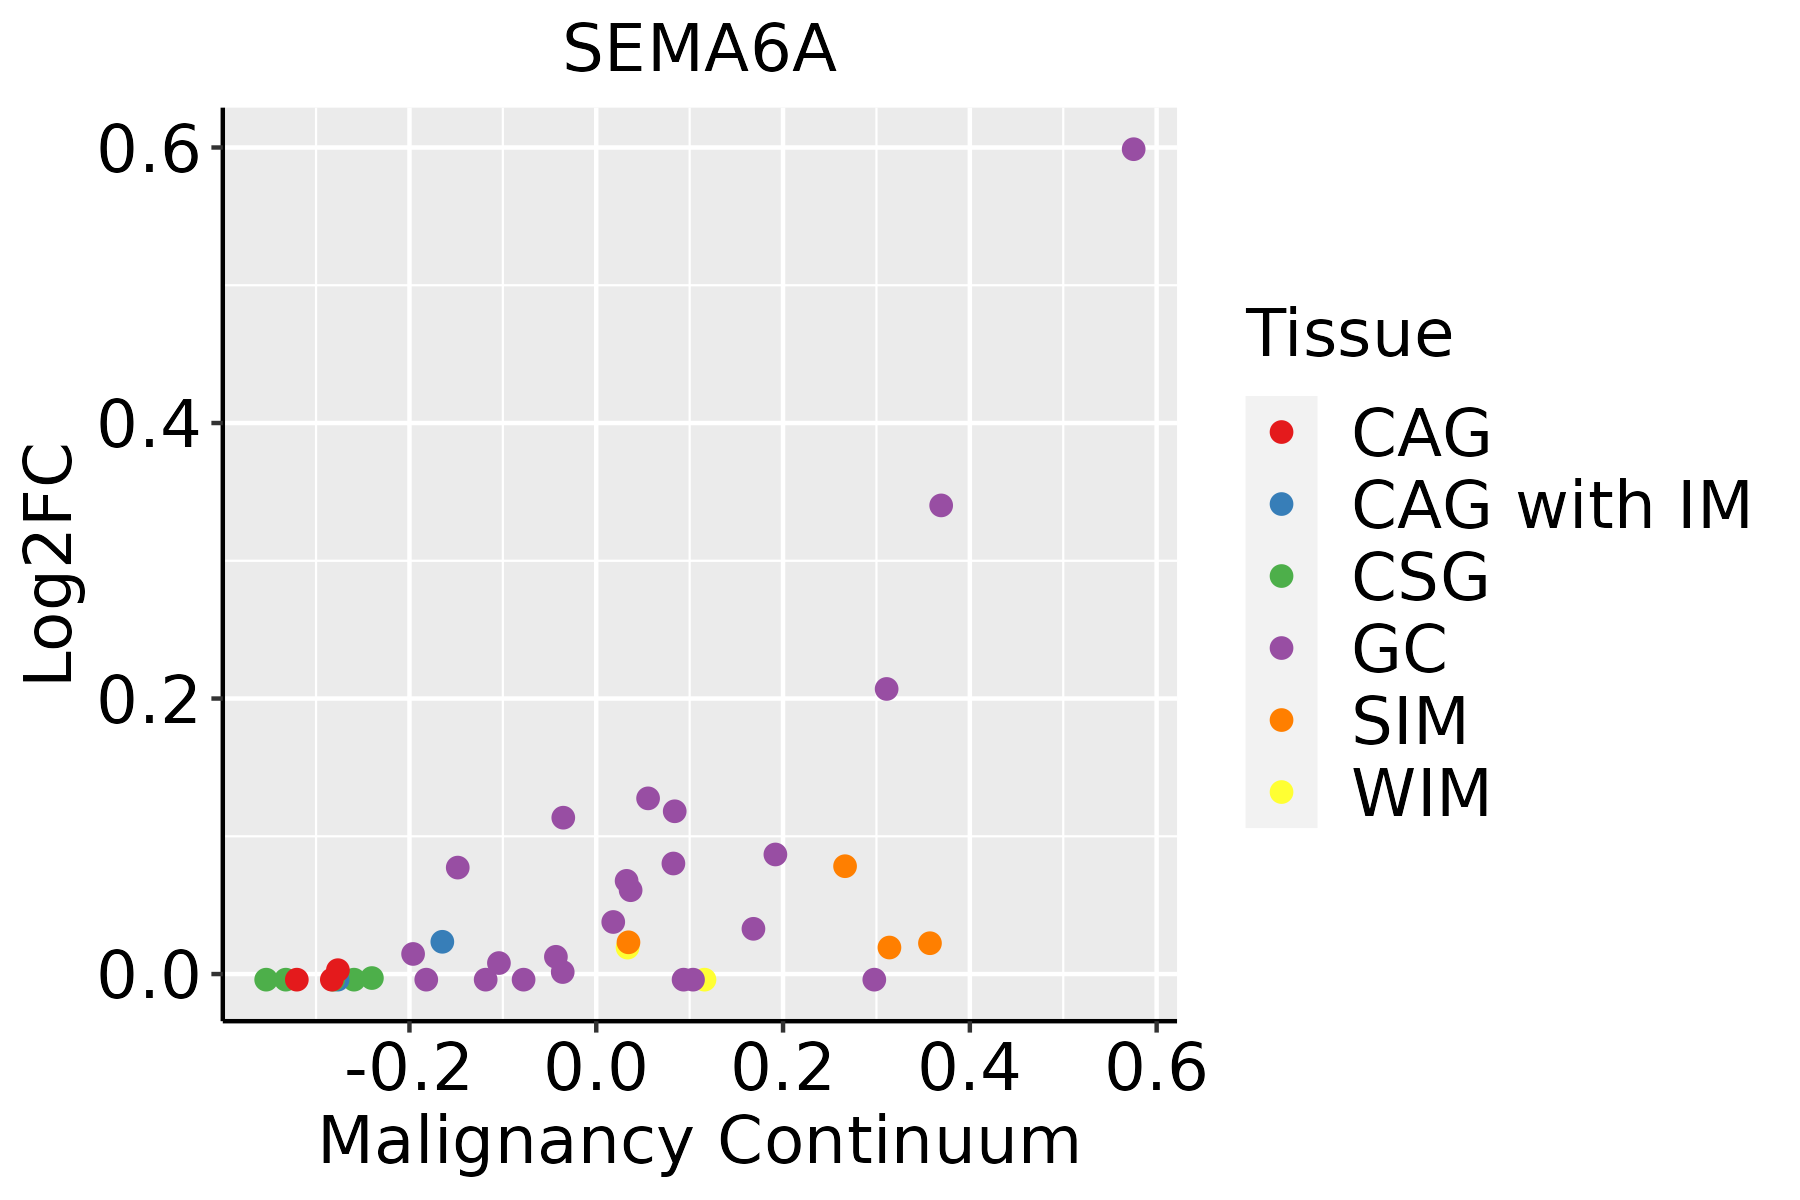 | CAG: Chronic atrophic gastritis |
| CAG with IM: Chronic atrophic gastritis with intestinal metaplasia | ||
| CSG: Chronic superficial gastritis | ||
| GC: Gastric cancer | ||
| SIM: Severe intestinal metaplasia | ||
| WIM: Wild intestinal metaplasia | ||
| Liver |  | HCC: Hepatocellular carcinoma |
| NAFLD: Non-alcoholic fatty liver disease |
| ∗log2FC in expression of this searched gene in stem-like cells from each diseased tissue sample relative to stem-like cells in normal samples in each tissue plotted against the malignancy continuum. Samples are colored based on if they are from different disease stage. |
Top |
Malignant transformation related pathway analysis |
| Find out the enriched GO biological processes and KEGG pathways involved in transition from healthy to precancer to cancer |
| Tissue | Disease Stage | Enriched GO biological Processes |
| Colorectum | AD |  |
| Colorectum | SER |  |
| Colorectum | MSS |  |
| Colorectum | MSI-H |  |
| Colorectum | FAP |  |
| ∗Top 15 enriched GO BP terms are showed in the bar plot of each disease state in each tissue. Each row represents a significant GO biological process which is colored according to the -log10(p.adjust). |
| Page: 1 2 3 4 5 6 7 8 9 |
| GO ID | Tissue | Disease Stage | Description | Gene Ratio | Bg Ratio | pvalue | p.adjust | Count |
| GO:000166714 | Breast | IDC | ameboidal-type cell migration | 64/1434 | 475/18723 | 6.65e-06 | 2.05e-04 | 64 |
| GO:00457651 | Breast | IDC | regulation of angiogenesis | 45/1434 | 342/18723 | 2.57e-04 | 3.98e-03 | 45 |
| GO:19013421 | Breast | IDC | regulation of vasculature development | 45/1434 | 348/18723 | 3.78e-04 | 5.38e-03 | 45 |
| GO:00703713 | Breast | IDC | ERK1 and ERK2 cascade | 43/1434 | 330/18723 | 4.28e-04 | 5.84e-03 | 43 |
| GO:001604913 | Breast | IDC | cell growth | 56/1434 | 482/18723 | 1.16e-03 | 1.26e-02 | 56 |
| GO:00400132 | Breast | IDC | negative regulation of locomotion | 47/1434 | 391/18723 | 1.39e-03 | 1.43e-02 | 47 |
| GO:000155813 | Breast | IDC | regulation of cell growth | 49/1434 | 414/18723 | 1.55e-03 | 1.55e-02 | 49 |
| GO:00703733 | Breast | IDC | negative regulation of ERK1 and ERK2 cascade | 14/1434 | 78/18723 | 2.21e-03 | 2.06e-02 | 14 |
| GO:00325358 | Breast | IDC | regulation of cellular component size | 45/1434 | 383/18723 | 2.72e-03 | 2.41e-02 | 45 |
| GO:00071625 | Breast | IDC | negative regulation of cell adhesion | 37/1434 | 303/18723 | 3.27e-03 | 2.75e-02 | 37 |
| GO:00703722 | Breast | IDC | regulation of ERK1 and ERK2 cascade | 37/1434 | 309/18723 | 4.53e-03 | 3.49e-02 | 37 |
| GO:000166723 | Breast | DCIS | ameboidal-type cell migration | 62/1390 | 475/18723 | 9.60e-06 | 2.56e-04 | 62 |
| GO:00457652 | Breast | DCIS | regulation of angiogenesis | 44/1390 | 342/18723 | 2.50e-04 | 3.87e-03 | 44 |
| GO:19013422 | Breast | DCIS | regulation of vasculature development | 44/1390 | 348/18723 | 3.67e-04 | 5.17e-03 | 44 |
| GO:004001311 | Breast | DCIS | negative regulation of locomotion | 47/1390 | 391/18723 | 7.30e-04 | 8.69e-03 | 47 |
| GO:007037111 | Breast | DCIS | ERK1 and ERK2 cascade | 41/1390 | 330/18723 | 8.11e-04 | 9.32e-03 | 41 |
| GO:001604923 | Breast | DCIS | cell growth | 54/1390 | 482/18723 | 1.60e-03 | 1.59e-02 | 54 |
| GO:007037311 | Breast | DCIS | negative regulation of ERK1 and ERK2 cascade | 14/1390 | 78/18723 | 1.65e-03 | 1.64e-02 | 14 |
| GO:000155822 | Breast | DCIS | regulation of cell growth | 47/1390 | 414/18723 | 2.39e-03 | 2.16e-02 | 47 |
| GO:003253514 | Breast | DCIS | regulation of cellular component size | 44/1390 | 383/18723 | 2.58e-03 | 2.30e-02 | 44 |
| Page: 1 2 3 4 5 6 7 8 9 |
| Pathway ID | Tissue | Disease Stage | Description | Gene Ratio | Bg Ratio | pvalue | p.adjust | qvalue | Count |
| hsa04360 | Colorectum | AD | Axon guidance | 61/2092 | 182/8465 | 4.36e-03 | 2.17e-02 | 1.38e-02 | 61 |
| hsa043601 | Colorectum | AD | Axon guidance | 61/2092 | 182/8465 | 4.36e-03 | 2.17e-02 | 1.38e-02 | 61 |
| hsa043602 | Colorectum | MSS | Axon guidance | 54/1875 | 182/8465 | 1.03e-02 | 3.69e-02 | 2.26e-02 | 54 |
| hsa043603 | Colorectum | MSS | Axon guidance | 54/1875 | 182/8465 | 1.03e-02 | 3.69e-02 | 2.26e-02 | 54 |
| hsa043604 | Colorectum | FAP | Axon guidance | 47/1404 | 182/8465 | 9.09e-04 | 5.20e-03 | 3.16e-03 | 47 |
| hsa043605 | Colorectum | FAP | Axon guidance | 47/1404 | 182/8465 | 9.09e-04 | 5.20e-03 | 3.16e-03 | 47 |
| hsa043606 | Colorectum | CRC | Axon guidance | 43/1091 | 182/8465 | 4.38e-05 | 8.70e-04 | 5.90e-04 | 43 |
| hsa043607 | Colorectum | CRC | Axon guidance | 43/1091 | 182/8465 | 4.38e-05 | 8.70e-04 | 5.90e-04 | 43 |
| hsa0436016 | Esophagus | ESCC | Axon guidance | 108/4205 | 182/8465 | 5.13e-03 | 1.30e-02 | 6.67e-03 | 108 |
| hsa0436017 | Esophagus | ESCC | Axon guidance | 108/4205 | 182/8465 | 5.13e-03 | 1.30e-02 | 6.67e-03 | 108 |
| Page: 1 |
Top |
Cell-cell communication analysis |
| Identification of potential cell-cell interactions between two cell types and their ligand-receptor pairs for different disease states |
| Ligand | Receptor | LRpair | Pathway | Tissue | Disease Stage |
| SEMA6A | PLXNA2 | SEMA6A_PLXNA2 | SEMA6 | Breast | ADJ |
| SEMA6A | PLXNA4 | SEMA6A_PLXNA4 | SEMA6 | Breast | DCIS |
| SEMA6A | PLXNA2 | SEMA6A_PLXNA2 | SEMA6 | Breast | Healthy |
| SEMA6A | PLXNA2 | SEMA6A_PLXNA2 | SEMA6 | Cervix | CC |
| SEMA6A | PLXNA2 | SEMA6A_PLXNA2 | SEMA6 | CRC | AD |
| SEMA6A | PLXNA2 | SEMA6A_PLXNA2 | SEMA6 | CRC | CRC |
| SEMA6A | PLXNA4 | SEMA6A_PLXNA4 | SEMA6 | CRC | CRC |
| SEMA6A | PLXNA2 | SEMA6A_PLXNA2 | SEMA6 | CRC | FAP |
| SEMA6A | PLXNA4 | SEMA6A_PLXNA4 | SEMA6 | CRC | FAP |
| SEMA6A | PLXNA2 | SEMA6A_PLXNA2 | SEMA6 | CRC | Healthy |
| SEMA6A | PLXNA2 | SEMA6A_PLXNA2 | SEMA6 | CRC | MSI-H |
| SEMA6A | PLXNA2 | SEMA6A_PLXNA2 | SEMA6 | CRC | MSS |
| SEMA6A | PLXNA2 | SEMA6A_PLXNA2 | SEMA6 | Endometrium | ADJ |
| SEMA6A | PLXNA4 | SEMA6A_PLXNA4 | SEMA6 | Endometrium | ADJ |
| SEMA6A | PLXNA2 | SEMA6A_PLXNA2 | SEMA6 | Endometrium | AEH |
| SEMA6A | PLXNA4 | SEMA6A_PLXNA4 | SEMA6 | Endometrium | AEH |
| SEMA6A | PLXNA2 | SEMA6A_PLXNA2 | SEMA6 | Endometrium | EEC |
| SEMA6A | PLXNA2 | SEMA6A_PLXNA2 | SEMA6 | Esophagus | ESCC |
| SEMA6A | PLXNA2 | SEMA6A_PLXNA2 | SEMA6 | GC | ADJ |
| SEMA6A | PLXNA2 | SEMA6A_PLXNA2 | SEMA6 | HNSCC | ADJ |
| Page: 1 2 3 |
Top |
Single-cell gene regulatory network inference analysis |
| Find out the significant the regulons (TFs) and the target genes of each regulon across cell types for different disease states |
| TF | Cell Type | Tissue | Disease Stage | Target Gene | RSS | Regulon Activity |
| ∗The dot plots of a searched regulon are shown for all cell subpopulations in each disease state of each tissue based on the regulon specific score inferred using pySCENIC and by calculating the average expression. |
| Page: 1 |
Top |
Somatic mutation of malignant transformation related genes |
| Annotation of somatic variants for genes involved in malignant transformation |
| Hugo Symbol | Variant Class | Variant Classification | dbSNP RS | HGVSc | HGVSp | HGVSp Short | SWISSPROT | BIOTYPE | SIFT | PolyPhen | Tumor Sample Barcode | Tissue | Histology | Sex | Age | Stage | Therapy Types | Drugs | Outcome |
| SEMA6A | SNV | Missense_Mutation | novel | c.674N>A | p.Ala225Asp | p.A225D | protein_coding | deleterious(0) | possibly_damaging(0.874) | TCGA-A2-A3XT-01 | Breast | breast invasive carcinoma | Female | <65 | I/II | Chemotherapy | cyclophosphamide | PR | |
| SEMA6A | SNV | Missense_Mutation | rs753952234 | c.1922N>T | p.Ser641Phe | p.S641F | protein_coding | tolerated(0.06) | benign(0.011) | TCGA-A8-A07W-01 | Breast | breast invasive carcinoma | Female | >=65 | III/IV | Hormone Therapy | exemestane | SD | |
| SEMA6A | SNV | Missense_Mutation | rs377316252 | c.628N>A | p.Val210Ile | p.V210I | protein_coding | tolerated(0.51) | benign(0.08) | TCGA-A8-A09Z-01 | Breast | breast invasive carcinoma | Female | >=65 | I/II | Unknown | Unknown | SD | |
| SEMA6A | SNV | Missense_Mutation | rs757635978 | c.1823N>T | p.Ser608Leu | p.S608L | protein_coding | tolerated(0.15) | benign(0.031) | TCGA-AN-A046-01 | Breast | breast invasive carcinoma | Female | >=65 | I/II | Unknown | Unknown | SD | |
| SEMA6A | SNV | Missense_Mutation | novel | c.3056N>T | p.Arg1019Leu | p.R1019L | protein_coding | deleterious(0) | probably_damaging(0.999) | TCGA-B6-A400-01 | Breast | breast invasive carcinoma | Female | <65 | III/IV | Unknown | Unknown | SD | |
| SEMA6A | SNV | Missense_Mutation | c.1802N>A | p.Pro601His | p.P601H | protein_coding | deleterious(0.02) | possibly_damaging(0.59) | TCGA-D8-A1JA-01 | Breast | breast invasive carcinoma | Female | <65 | III/IV | Chemotherapy | adriamycin | PD | ||
| SEMA6A | SNV | Missense_Mutation | rs774864407 | c.1213A>G | p.Ile405Val | p.I405V | protein_coding | tolerated(0.8) | benign(0) | TCGA-D8-A1XK-01 | Breast | breast invasive carcinoma | Female | <65 | I/II | Chemotherapy | doxorubicine+cyclophosphamide | SD | |
| SEMA6A | SNV | Missense_Mutation | rs369698820 | c.910N>T | p.Arg304Cys | p.R304C | protein_coding | deleterious(0) | benign(0.354) | TCGA-D8-A27K-01 | Breast | breast invasive carcinoma | Female | <65 | I/II | Chemotherapy | adriamycin+cyclophosphamid | SD | |
| SEMA6A | SNV | Missense_Mutation | c.2101N>C | p.Val701Leu | p.V701L | protein_coding | tolerated(0.39) | benign(0.06) | TCGA-E9-A1RB-01 | Breast | breast invasive carcinoma | Female | <65 | I/II | Chemotherapy | methotrexate | SD | ||
| SEMA6A | SNV | Missense_Mutation | rs774967202 | c.2473T>C | p.Ser825Pro | p.S825P | protein_coding | deleterious(0.05) | benign(0.003) | TCGA-E9-A1RE-01 | Breast | breast invasive carcinoma | Female | >=65 | III/IV | Hormone Therapy | tamoxiphen | SD |
| Page: 1 2 3 4 5 6 7 8 9 10 11 12 13 |
Top |
Related drugs of malignant transformation related genes |
| Identification of chemicals and drugs interact with genes involved in malignant transfromation |
| (DGIdb 4.0) |
| Entrez ID | Symbol | Category | Interaction Types | Drug Claim Name | Drug Name | PMIDs |
| Page: 1 |

Copyright 2023-Present -The University of Texas Health Science Center at Houston |