
|
|||||
|
 | |
| |
| |
| |
| |
| |
|
Gene: SEMA5A |
Gene summary for SEMA5A |
| Gene information | Species | Human | Gene symbol | SEMA5A | Gene ID | 9037 |
| Gene name | semaphorin 5A | |
| Gene Alias | SEMAF | |
| Cytomap | 5p15.31 | |
| Gene Type | protein-coding | GO ID | GO:0000902 | UniProtAcc | Q13591 |
Top |
Malignant transformation analysis |
| Identification of the aberrant gene expression in precancerous and cancerous lesions by comparing the gene expression of stem-like cells in diseased tissues with normal stem cells |
| Entrez ID | Symbol | Replicates | Species | Organ | Tissue | Adj P-value | Log2FC | Malignancy |
| 9037 | SEMA5A | HTA11_347_2000001011 | Human | Colorectum | AD | 5.68e-05 | 5.35e-01 | -0.1954 |
| 9037 | SEMA5A | HTA11_83_2000001011 | Human | Colorectum | SER | 2.35e-02 | 5.76e-01 | -0.1526 |
| 9037 | SEMA5A | HTA11_1391_2000001011 | Human | Colorectum | AD | 1.34e-05 | 7.84e-01 | -0.059 |
| 9037 | SEMA5A | HTA11_2992_2000001011 | Human | Colorectum | SER | 6.06e-04 | -7.22e-01 | -0.1706 |
| 9037 | SEMA5A | HTA11_4255_2000001011 | Human | Colorectum | SER | 4.15e-03 | -7.65e-01 | 0.0446 |
| 9037 | SEMA5A | HTA11_8622_2000001021 | Human | Colorectum | SER | 1.21e-03 | -7.35e-01 | 0.0528 |
| 9037 | SEMA5A | HTA11_99999970781_79442 | Human | Colorectum | MSS | 8.18e-31 | -7.99e-01 | 0.294 |
| 9037 | SEMA5A | HTA11_99999965104_69814 | Human | Colorectum | MSS | 1.15e-04 | -5.81e-01 | 0.281 |
| 9037 | SEMA5A | HTA11_99999971662_82457 | Human | Colorectum | MSS | 1.26e-09 | -4.83e-01 | 0.3859 |
| 9037 | SEMA5A | HTA11_99999974143_84620 | Human | Colorectum | MSS | 5.10e-38 | -9.27e-01 | 0.3005 |
| 9037 | SEMA5A | F007 | Human | Colorectum | FAP | 1.24e-03 | 3.19e-01 | 0.1176 |
| 9037 | SEMA5A | A002-C-010 | Human | Colorectum | FAP | 3.05e-25 | 4.82e-01 | 0.242 |
| 9037 | SEMA5A | A015-C-203 | Human | Colorectum | FAP | 2.04e-20 | -2.51e-01 | -0.1294 |
| 9037 | SEMA5A | A002-C-201 | Human | Colorectum | FAP | 4.42e-06 | 9.85e-02 | 0.0324 |
| 9037 | SEMA5A | A001-C-119 | Human | Colorectum | FAP | 6.49e-16 | -7.67e-01 | -0.1557 |
| 9037 | SEMA5A | A001-C-108 | Human | Colorectum | FAP | 1.91e-13 | -3.87e-01 | -0.0272 |
| 9037 | SEMA5A | A002-C-205 | Human | Colorectum | FAP | 7.30e-14 | -3.22e-01 | -0.1236 |
| 9037 | SEMA5A | A001-C-104 | Human | Colorectum | FAP | 1.02e-04 | -3.60e-01 | 0.0184 |
| 9037 | SEMA5A | A015-C-006 | Human | Colorectum | FAP | 9.04e-19 | -7.39e-01 | -0.0994 |
| 9037 | SEMA5A | A015-C-106 | Human | Colorectum | FAP | 1.10e-05 | -2.59e-01 | -0.0511 |
| Page: 1 2 3 4 |
| Tissue | Expression Dynamics | Abbreviation |
| Colorectum (GSE201348) |  | FAP: Familial adenomatous polyposis |
| CRC: Colorectal cancer | ||
| Colorectum (HTA11) |  | AD: Adenomas |
| SER: Sessile serrated lesions | ||
| MSI-H: Microsatellite-high colorectal cancer | ||
| MSS: Microsatellite stable colorectal cancer | ||
| Esophagus | 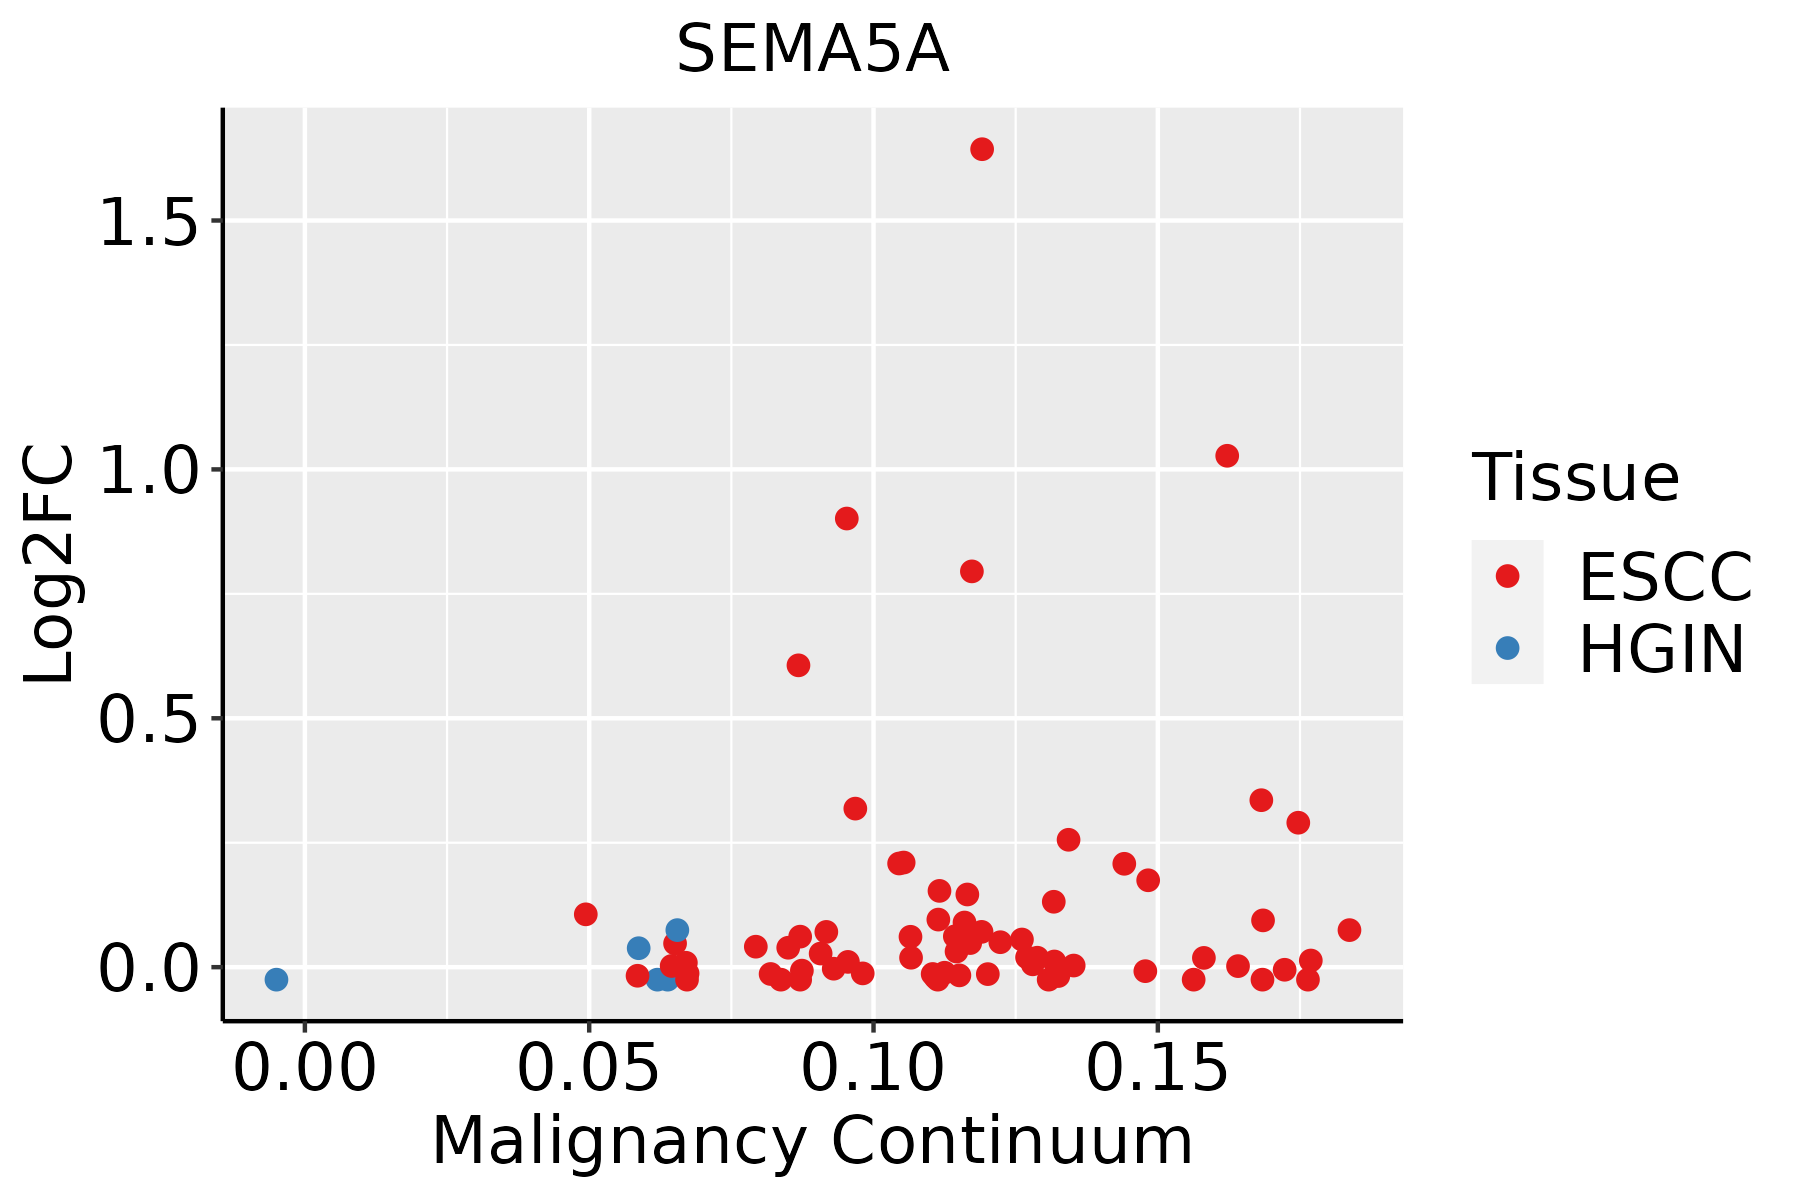 | ESCC: Esophageal squamous cell carcinoma |
| HGIN: High-grade intraepithelial neoplasias | ||
| LGIN: Low-grade intraepithelial neoplasias | ||
| Prostate |  | BPH: Benign Prostatic Hyperplasia |
| Skin | 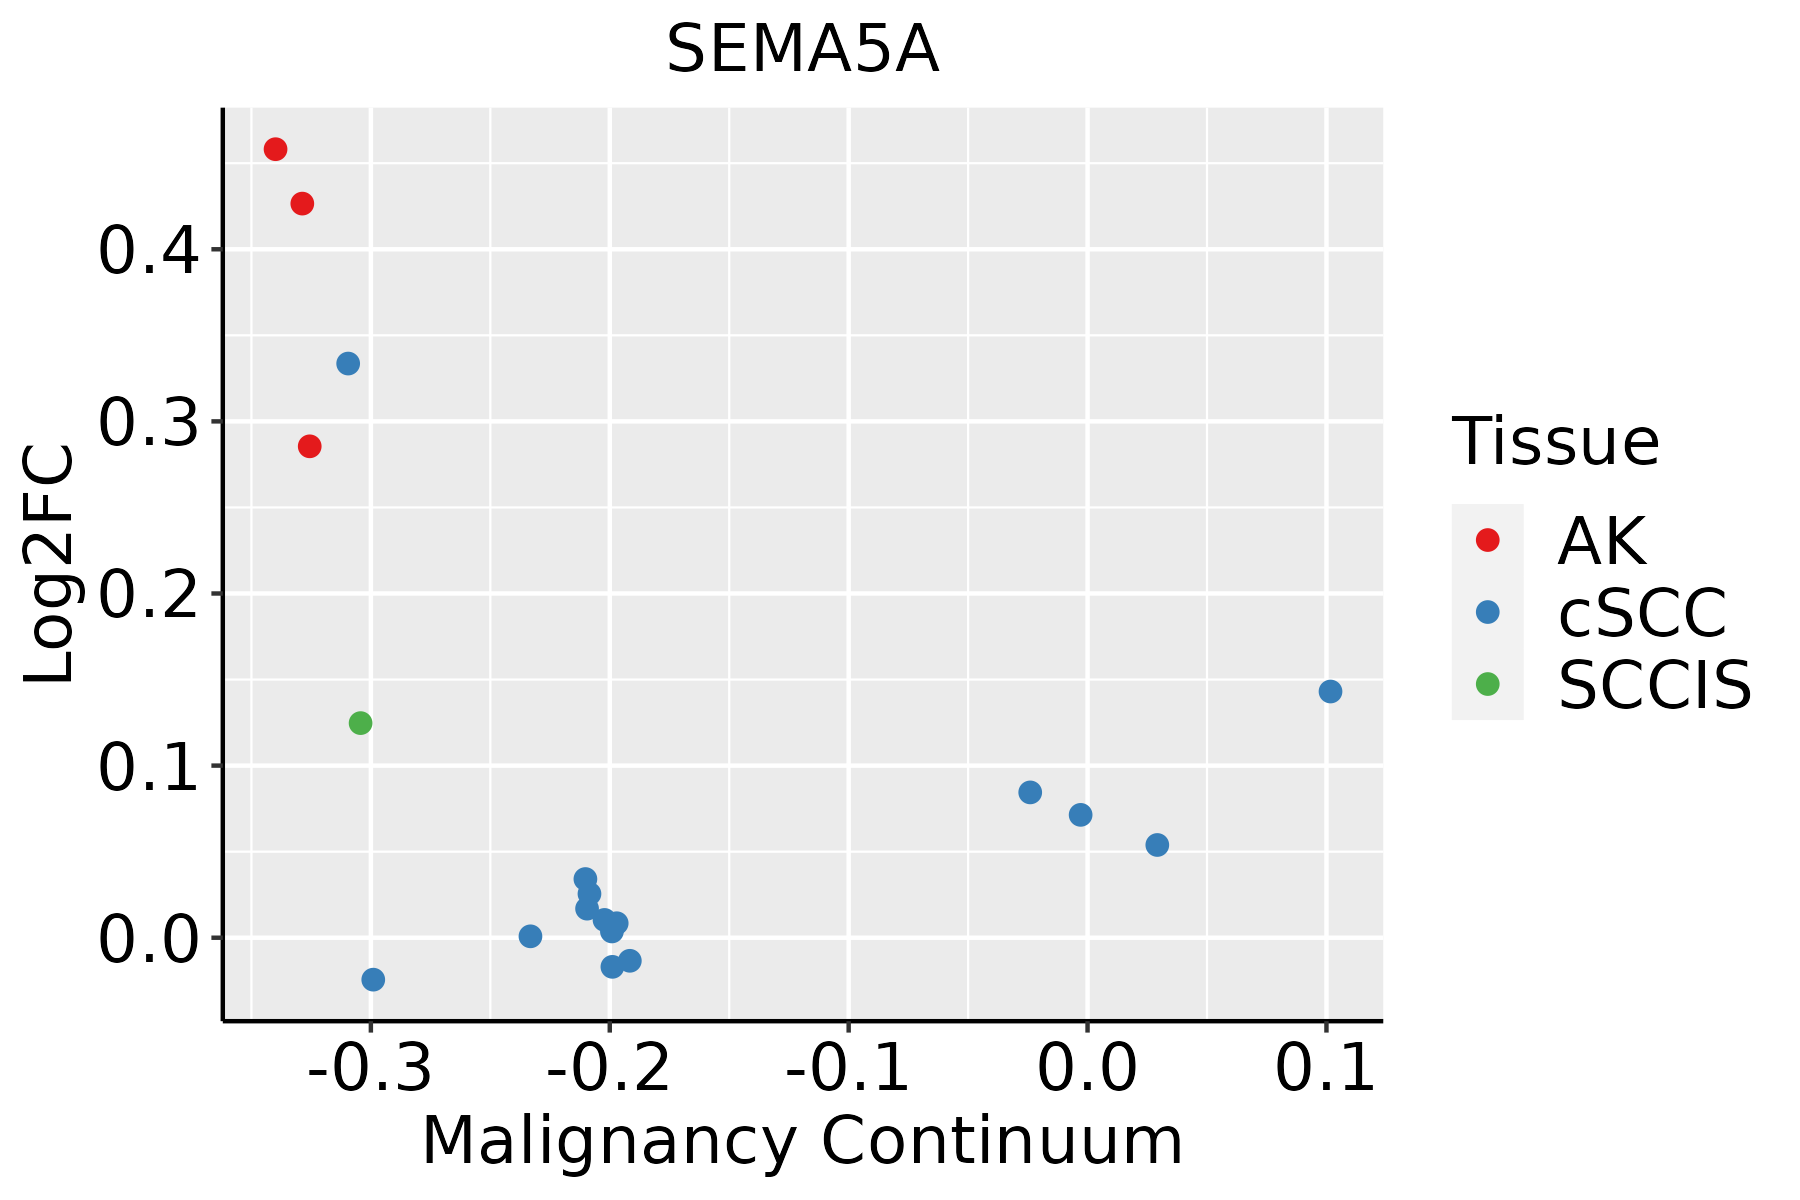 | AK: Actinic keratosis |
| cSCC: Cutaneous squamous cell carcinoma | ||
| SCCIS:squamous cell carcinoma in situ | ||
| Thyroid | 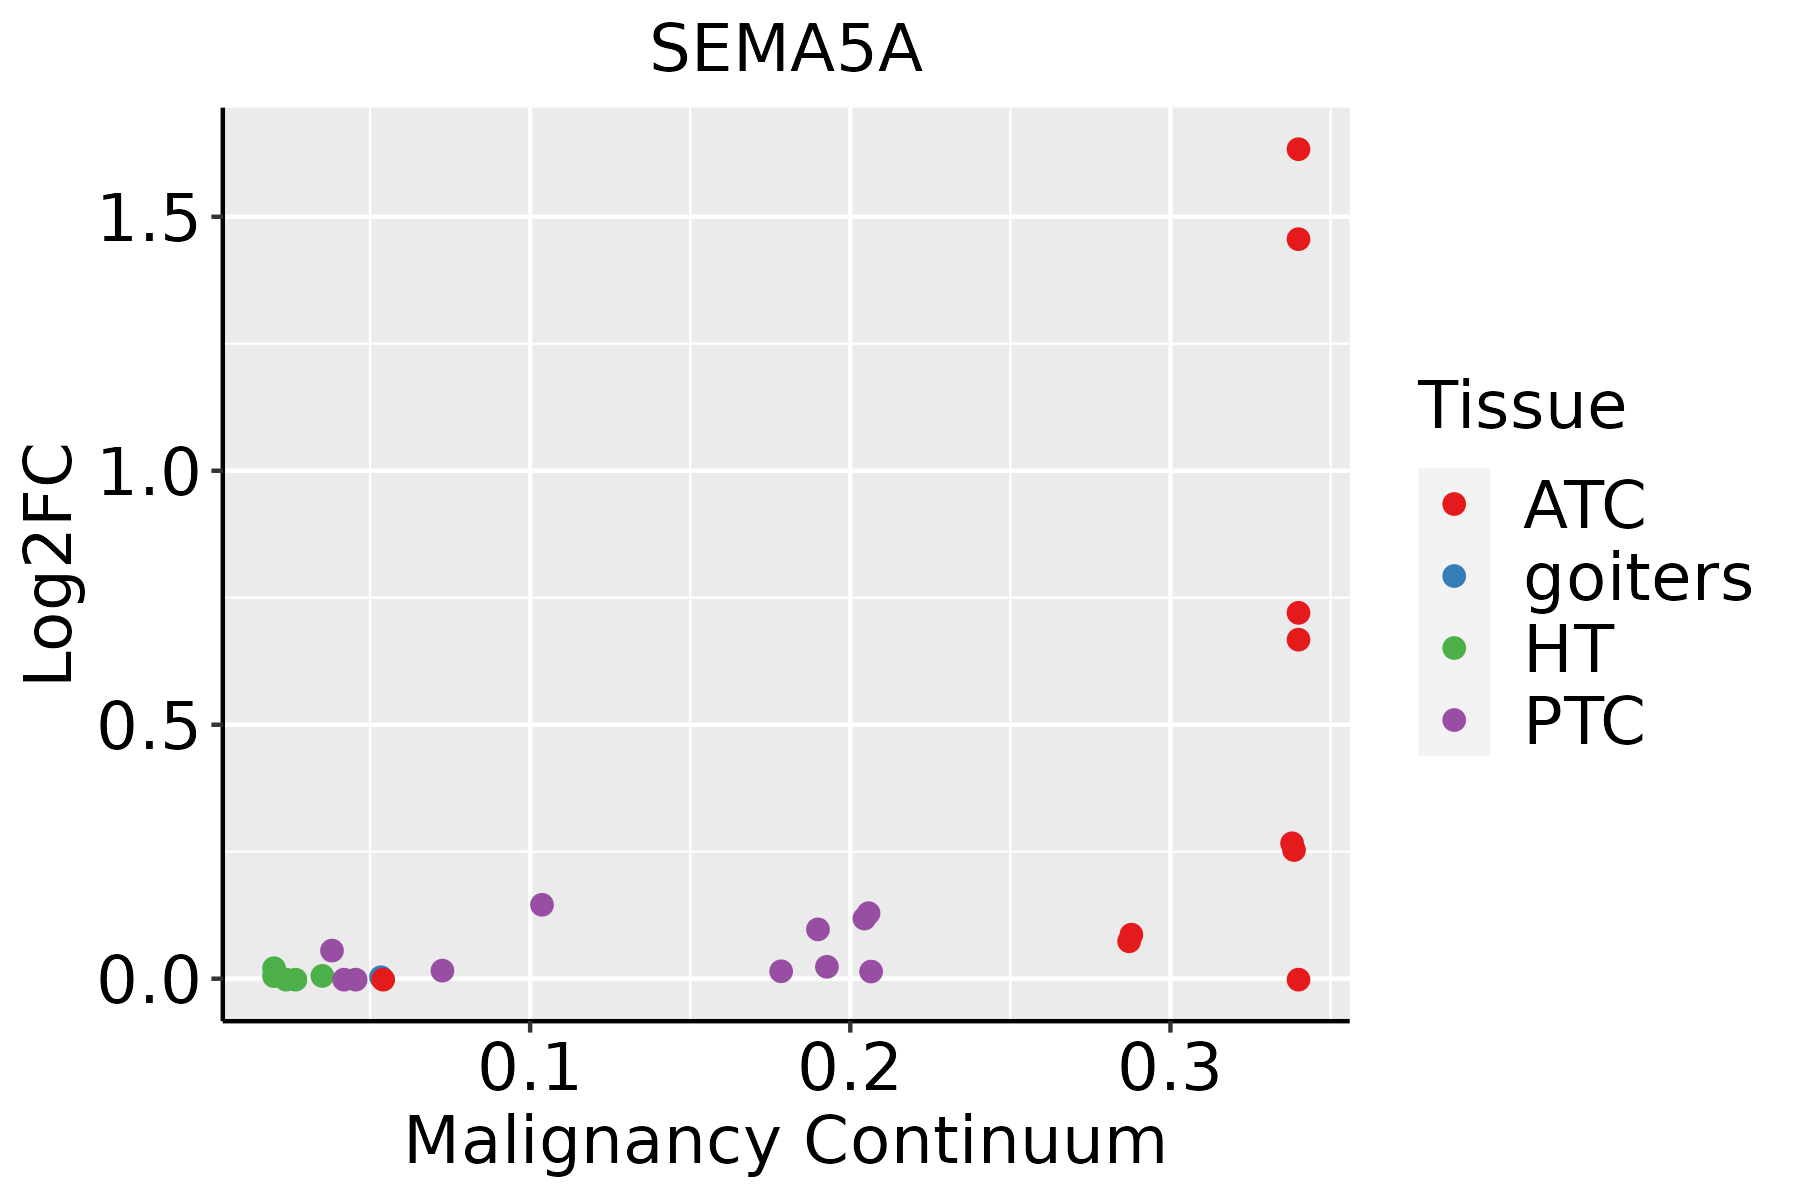 | ATC: Anaplastic thyroid cancer |
| HT: Hashimoto's thyroiditis | ||
| PTC: Papillary thyroid cancer |
| ∗log2FC in expression of this searched gene in stem-like cells from each diseased tissue sample relative to stem-like cells in normal samples in each tissue plotted against the malignancy continuum. Samples are colored based on if they are from different disease stage. |
Top |
Malignant transformation related pathway analysis |
| Find out the enriched GO biological processes and KEGG pathways involved in transition from healthy to precancer to cancer |
| Tissue | Disease Stage | Enriched GO biological Processes |
| Colorectum | AD |  |
| Colorectum | SER |  |
| Colorectum | MSS |  |
| Colorectum | MSI-H |  |
| Colorectum | FAP |  |
| ∗Top 15 enriched GO BP terms are showed in the bar plot of each disease state in each tissue. Each row represents a significant GO biological process which is colored according to the -log10(p.adjust). |
| Page: 1 2 3 4 5 6 7 8 9 |
| GO ID | Tissue | Disease Stage | Description | Gene Ratio | Bg Ratio | pvalue | p.adjust | Count |
| GO:0007015 | Colorectum | AD | actin filament organization | 167/3918 | 442/18723 | 1.65e-16 | 7.94e-14 | 167 |
| GO:0032535 | Colorectum | AD | regulation of cellular component size | 142/3918 | 383/18723 | 1.74e-13 | 3.41e-11 | 142 |
| GO:1902903 | Colorectum | AD | regulation of supramolecular fiber organization | 139/3918 | 383/18723 | 2.01e-12 | 3.19e-10 | 139 |
| GO:0032970 | Colorectum | AD | regulation of actin filament-based process | 142/3918 | 397/18723 | 4.05e-12 | 5.90e-10 | 142 |
| GO:0110053 | Colorectum | AD | regulation of actin filament organization | 108/3918 | 278/18723 | 5.02e-12 | 6.98e-10 | 108 |
| GO:0008154 | Colorectum | AD | actin polymerization or depolymerization | 90/3918 | 218/18723 | 6.14e-12 | 8.23e-10 | 90 |
| GO:0008064 | Colorectum | AD | regulation of actin polymerization or depolymerization | 79/3918 | 188/18723 | 4.17e-11 | 4.74e-09 | 79 |
| GO:0030832 | Colorectum | AD | regulation of actin filament length | 79/3918 | 189/18723 | 5.71e-11 | 6.27e-09 | 79 |
| GO:1902905 | Colorectum | AD | positive regulation of supramolecular fiber organization | 85/3918 | 209/18723 | 5.95e-11 | 6.33e-09 | 85 |
| GO:0032956 | Colorectum | AD | regulation of actin cytoskeleton organization | 127/3918 | 358/18723 | 1.03e-10 | 1.04e-08 | 127 |
| GO:0051495 | Colorectum | AD | positive regulation of cytoskeleton organization | 89/3918 | 226/18723 | 1.61e-10 | 1.56e-08 | 89 |
| GO:0022411 | Colorectum | AD | cellular component disassembly | 147/3918 | 443/18723 | 8.53e-10 | 6.76e-08 | 147 |
| GO:0032984 | Colorectum | AD | protein-containing complex disassembly | 81/3918 | 224/18723 | 9.41e-08 | 4.65e-06 | 81 |
| GO:0016049 | Colorectum | AD | cell growth | 143/3918 | 482/18723 | 2.83e-06 | 8.09e-05 | 143 |
| GO:0001558 | Colorectum | AD | regulation of cell growth | 124/3918 | 414/18723 | 7.67e-06 | 1.86e-04 | 124 |
| GO:0030111 | Colorectum | AD | regulation of Wnt signaling pathway | 102/3918 | 328/18723 | 8.51e-06 | 2.03e-04 | 102 |
| GO:0016055 | Colorectum | AD | Wnt signaling pathway | 130/3918 | 444/18723 | 1.60e-05 | 3.37e-04 | 130 |
| GO:0030042 | Colorectum | AD | actin filament depolymerization | 27/3918 | 59/18723 | 1.65e-05 | 3.47e-04 | 27 |
| GO:0198738 | Colorectum | AD | cell-cell signaling by wnt | 130/3918 | 446/18723 | 2.02e-05 | 4.10e-04 | 130 |
| GO:0001667 | Colorectum | AD | ameboidal-type cell migration | 137/3918 | 475/18723 | 2.17e-05 | 4.33e-04 | 137 |
| Page: 1 2 3 4 5 6 7 8 9 10 11 12 13 14 15 16 17 18 19 20 21 22 23 24 25 26 27 28 29 30 31 32 33 34 35 36 37 38 39 |
| Pathway ID | Tissue | Disease Stage | Description | Gene Ratio | Bg Ratio | pvalue | p.adjust | qvalue | Count |
| hsa04360 | Colorectum | AD | Axon guidance | 61/2092 | 182/8465 | 4.36e-03 | 2.17e-02 | 1.38e-02 | 61 |
| hsa043601 | Colorectum | AD | Axon guidance | 61/2092 | 182/8465 | 4.36e-03 | 2.17e-02 | 1.38e-02 | 61 |
| hsa043602 | Colorectum | MSS | Axon guidance | 54/1875 | 182/8465 | 1.03e-02 | 3.69e-02 | 2.26e-02 | 54 |
| hsa043603 | Colorectum | MSS | Axon guidance | 54/1875 | 182/8465 | 1.03e-02 | 3.69e-02 | 2.26e-02 | 54 |
| hsa043604 | Colorectum | FAP | Axon guidance | 47/1404 | 182/8465 | 9.09e-04 | 5.20e-03 | 3.16e-03 | 47 |
| hsa043605 | Colorectum | FAP | Axon guidance | 47/1404 | 182/8465 | 9.09e-04 | 5.20e-03 | 3.16e-03 | 47 |
| hsa043606 | Colorectum | CRC | Axon guidance | 43/1091 | 182/8465 | 4.38e-05 | 8.70e-04 | 5.90e-04 | 43 |
| hsa043607 | Colorectum | CRC | Axon guidance | 43/1091 | 182/8465 | 4.38e-05 | 8.70e-04 | 5.90e-04 | 43 |
| hsa0436016 | Esophagus | ESCC | Axon guidance | 108/4205 | 182/8465 | 5.13e-03 | 1.30e-02 | 6.67e-03 | 108 |
| hsa0436017 | Esophagus | ESCC | Axon guidance | 108/4205 | 182/8465 | 5.13e-03 | 1.30e-02 | 6.67e-03 | 108 |
| Page: 1 |
Top |
Cell-cell communication analysis |
| Identification of potential cell-cell interactions between two cell types and their ligand-receptor pairs for different disease states |
| Ligand | Receptor | LRpair | Pathway | Tissue | Disease Stage |
| SEMA5A | PLXNA3 | SEMA5A_PLXNA3 | SEMA5 | CRC | AD |
| SEMA5A | PLXNA1 | SEMA5A_PLXNA1 | SEMA5 | CRC | MSI-H |
| SEMA5A | PLXNA3 | SEMA5A_PLXNA3 | SEMA5 | CRC | MSI-H |
| SEMA5A | PLXNA3 | SEMA5A_PLXNA3 | SEMA5 | CRC | SER |
| SEMA5A | PLXNA1 | SEMA5A_PLXNA1 | SEMA5 | HNSCC | OSCC |
| SEMA5A | PLXNA1 | SEMA5A_PLXNA1 | SEMA5 | HNSCC | Precancer |
| SEMA5A | PLXNA3 | SEMA5A_PLXNA3 | SEMA5 | HNSCC | Precancer |
| SEMA5A | PLXNA1 | SEMA5A_PLXNA1 | SEMA5 | Lung | AAH |
| SEMA5A | PLXNA1 | SEMA5A_PLXNA1 | SEMA5 | Lung | Precancer |
| SEMA5A | PLXNA1 | SEMA5A_PLXNA1 | SEMA5 | THCA | Cancer |
| SEMA5A | PLXNA3 | SEMA5A_PLXNA3 | SEMA5 | THCA | Cancer |
| Page: 1 |
Top |
Single-cell gene regulatory network inference analysis |
| Find out the significant the regulons (TFs) and the target genes of each regulon across cell types for different disease states |
| TF | Cell Type | Tissue | Disease Stage | Target Gene | RSS | Regulon Activity |
| ∗The dot plots of a searched regulon are shown for all cell subpopulations in each disease state of each tissue based on the regulon specific score inferred using pySCENIC and by calculating the average expression. |
| Page: 1 |
Top |
Somatic mutation of malignant transformation related genes |
| Annotation of somatic variants for genes involved in malignant transformation |
| Hugo Symbol | Variant Class | Variant Classification | dbSNP RS | HGVSc | HGVSp | HGVSp Short | SWISSPROT | BIOTYPE | SIFT | PolyPhen | Tumor Sample Barcode | Tissue | Histology | Sex | Age | Stage | Therapy Types | Drugs | Outcome |
| SEMA5A | SNV | Missense_Mutation | rs75558429 | c.1520A>G | p.Asp507Gly | p.D507G | Q13591 | protein_coding | deleterious(0.01) | probably_damaging(0.989) | TCGA-A2-A04Q-01 | Breast | breast invasive carcinoma | Female | <65 | I/II | Chemotherapy | adriamycin | SD |
| SEMA5A | SNV | Missense_Mutation | novel | c.1030N>T | p.Ala344Ser | p.A344S | Q13591 | protein_coding | tolerated(0.05) | possibly_damaging(0.836) | TCGA-A7-A3IZ-01 | Breast | breast invasive carcinoma | Female | <65 | I/II | Chemotherapy | cytoxan | SD |
| SEMA5A | SNV | Missense_Mutation | novel | c.2084N>G | p.Ser695Cys | p.S695C | Q13591 | protein_coding | deleterious(0.03) | benign(0.4) | TCGA-AC-A62Y-01 | Breast | breast invasive carcinoma | Female | >=65 | I/II | Unknown | Unknown | SD |
| SEMA5A | SNV | Missense_Mutation | novel | c.1697N>A | p.Arg566Gln | p.R566Q | Q13591 | protein_coding | tolerated(0.18) | possibly_damaging(0.621) | TCGA-AN-A046-01 | Breast | breast invasive carcinoma | Female | >=65 | I/II | Unknown | Unknown | SD |
| SEMA5A | SNV | Missense_Mutation | novel | c.587N>A | p.Arg196Gln | p.R196Q | Q13591 | protein_coding | deleterious(0.01) | probably_damaging(0.997) | TCGA-AN-A046-01 | Breast | breast invasive carcinoma | Female | >=65 | I/II | Unknown | Unknown | SD |
| SEMA5A | SNV | Missense_Mutation | novel | c.1592N>A | p.Ala531Glu | p.A531E | Q13591 | protein_coding | tolerated(0.71) | benign(0.007) | TCGA-AN-A0FD-01 | Breast | breast invasive carcinoma | Female | >=65 | I/II | Unknown | Unknown | SD |
| SEMA5A | SNV | Missense_Mutation | c.502A>C | p.Asn168His | p.N168H | Q13591 | protein_coding | deleterious(0) | probably_damaging(0.98) | TCGA-AN-A0FX-01 | Breast | breast invasive carcinoma | Female | <65 | I/II | Unknown | Unknown | SD | |
| SEMA5A | SNV | Missense_Mutation | c.2464C>A | p.Pro822Thr | p.P822T | Q13591 | protein_coding | tolerated(0.05) | benign(0.219) | TCGA-AO-A03O-01 | Breast | breast invasive carcinoma | Female | >=65 | I/II | Chemotherapy | doxorubicin | SD | |
| SEMA5A | SNV | Missense_Mutation | c.823C>A | p.Arg275Ser | p.R275S | Q13591 | protein_coding | deleterious(0.02) | benign(0.393) | TCGA-AR-A0TY-01 | Breast | breast invasive carcinoma | Female | <65 | I/II | Unspecific | Paclitaxel | PD | |
| SEMA5A | SNV | Missense_Mutation | c.683T>G | p.Phe228Cys | p.F228C | Q13591 | protein_coding | deleterious(0) | probably_damaging(0.954) | TCGA-BH-A0AV-01 | Breast | breast invasive carcinoma | Female | <65 | I/II | Chemotherapy | taxotere | CR |
| Page: 1 2 3 4 5 6 7 8 9 10 11 12 13 14 15 16 17 18 19 20 |
Top |
Related drugs of malignant transformation related genes |
| Identification of chemicals and drugs interact with genes involved in malignant transfromation |
| (DGIdb 4.0) |
| Entrez ID | Symbol | Category | Interaction Types | Drug Claim Name | Drug Name | PMIDs |
| Page: 1 |

Copyright 2023-Present -The University of Texas Health Science Center at Houston |