
|
|||||
|
 | |
| |
| |
| |
| |
| |
|
Gene: SEMA4G |
Gene summary for SEMA4G |
| Gene information | Species | Human | Gene symbol | SEMA4G | Gene ID | 57715 |
| Gene name | semaphorin 4G | |
| Gene Alias | SEMA4G | |
| Cytomap | 10q24.31 | |
| Gene Type | protein-coding | GO ID | GO:0000902 | UniProtAcc | Q9NTN9 |
Top |
Malignant transformation analysis |
| Identification of the aberrant gene expression in precancerous and cancerous lesions by comparing the gene expression of stem-like cells in diseased tissues with normal stem cells |
| Entrez ID | Symbol | Replicates | Species | Organ | Tissue | Adj P-value | Log2FC | Malignancy |
| 57715 | SEMA4G | HCC1_Meng | Human | Liver | HCC | 2.33e-44 | 1.00e-01 | 0.0246 |
| 57715 | SEMA4G | HCC2_Meng | Human | Liver | HCC | 1.25e-19 | 1.48e-01 | 0.0107 |
| 57715 | SEMA4G | HCC2 | Human | Liver | HCC | 3.98e-14 | 3.24e+00 | 0.5341 |
| 57715 | SEMA4G | Pt14.a | Human | Liver | HCC | 8.06e-03 | 2.52e-01 | 0.0169 |
| 57715 | SEMA4G | S014 | Human | Liver | HCC | 2.17e-08 | 5.28e-01 | 0.2254 |
| 57715 | SEMA4G | S015 | Human | Liver | HCC | 2.68e-14 | 9.08e-01 | 0.2375 |
| 57715 | SEMA4G | S016 | Human | Liver | HCC | 2.13e-15 | 6.09e-01 | 0.2243 |
| 57715 | SEMA4G | S028 | Human | Liver | HCC | 3.44e-09 | 5.53e-01 | 0.2503 |
| 57715 | SEMA4G | S029 | Human | Liver | HCC | 7.25e-08 | 4.77e-01 | 0.2581 |
| Page: 1 |
| Tissue | Expression Dynamics | Abbreviation |
| Liver | 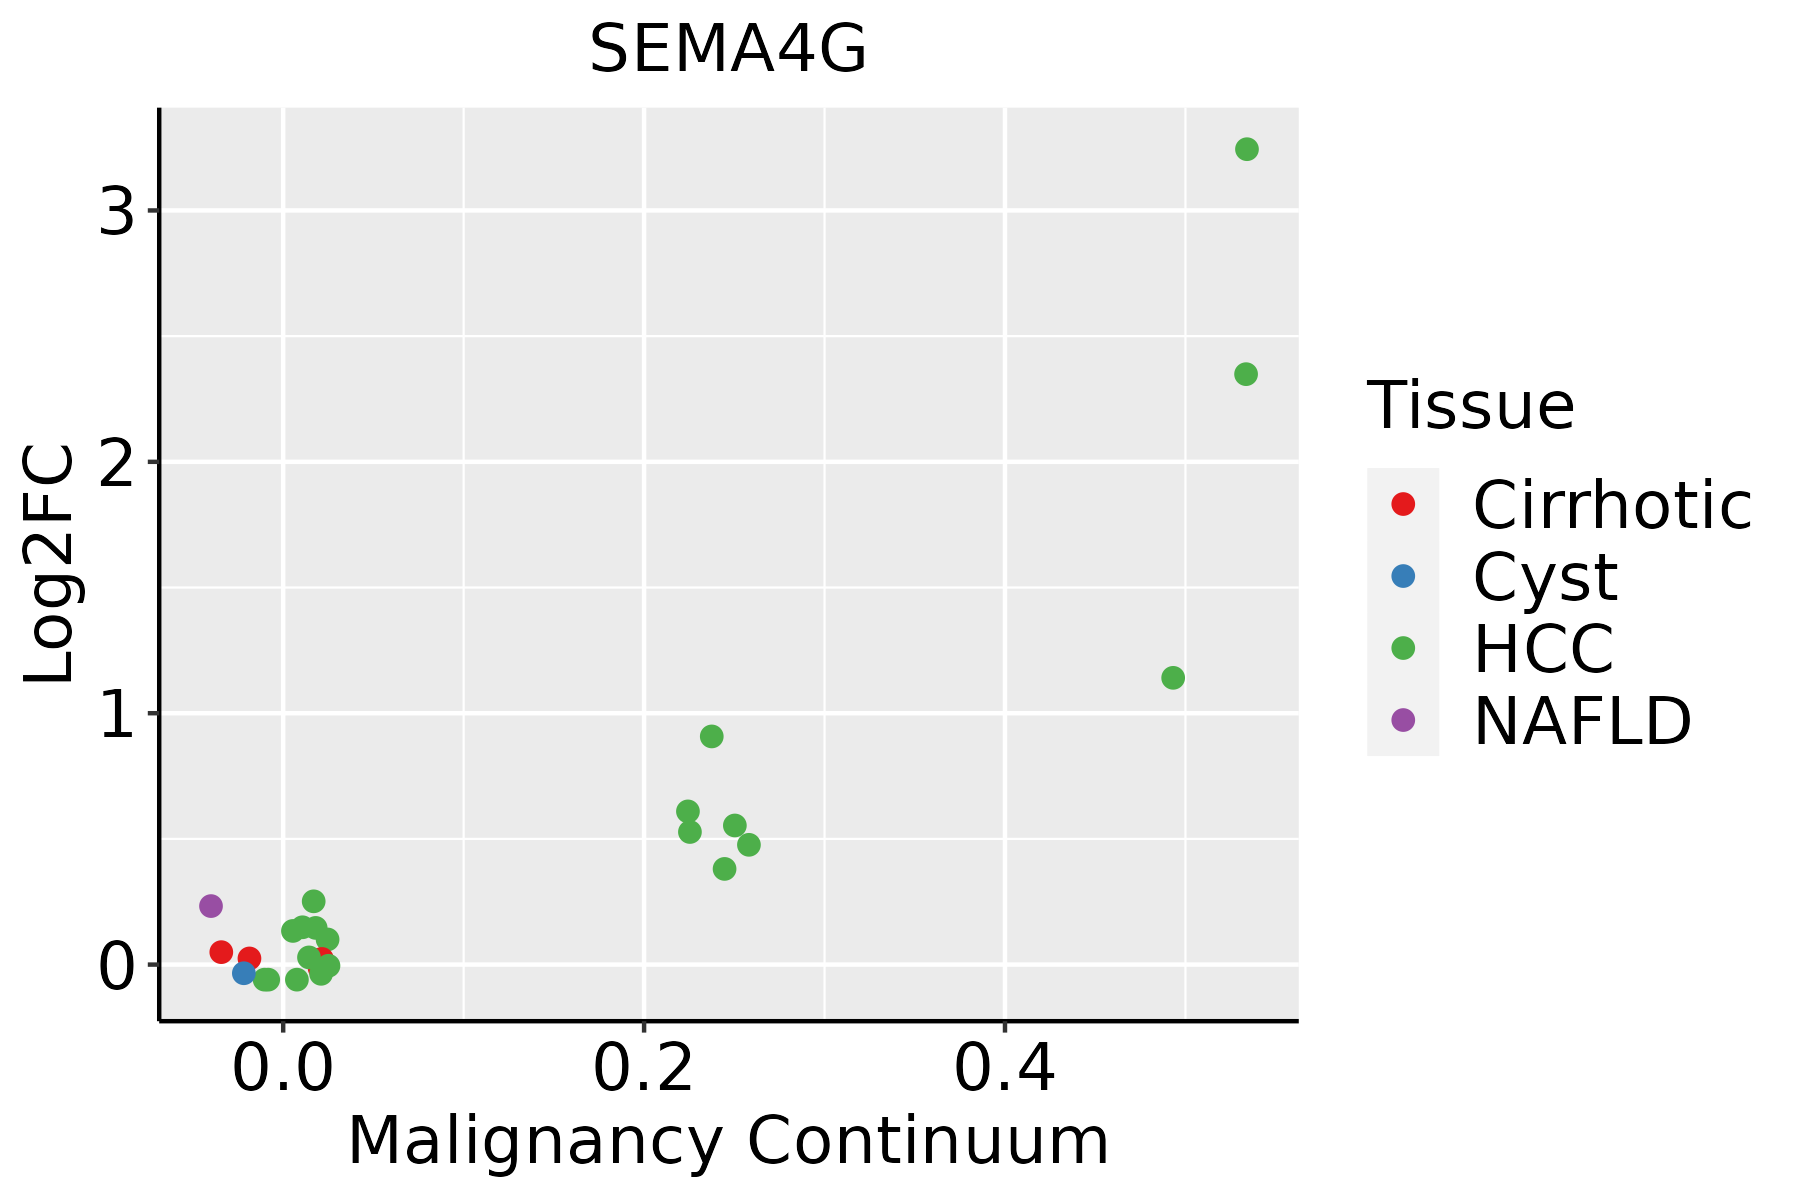 | HCC: Hepatocellular carcinoma |
| NAFLD: Non-alcoholic fatty liver disease |
| ∗log2FC in expression of this searched gene in stem-like cells from each diseased tissue sample relative to stem-like cells in normal samples in each tissue plotted against the malignancy continuum. Samples are colored based on if they are from different disease stage. |
Top |
Malignant transformation related pathway analysis |
| Find out the enriched GO biological processes and KEGG pathways involved in transition from healthy to precancer to cancer |
| Tissue | Disease Stage | Enriched GO biological Processes |
| Colorectum | AD |  |
| Colorectum | SER |  |
| Colorectum | MSS |  |
| Colorectum | MSI-H |  |
| Colorectum | FAP |  |
| ∗Top 15 enriched GO BP terms are showed in the bar plot of each disease state in each tissue. Each row represents a significant GO biological process which is colored according to the -log10(p.adjust). |
| Page: 1 2 3 4 5 6 7 8 9 |
| GO ID | Tissue | Disease Stage | Description | Gene Ratio | Bg Ratio | pvalue | p.adjust | Count |
| GO:001604921 | Liver | HCC | cell growth | 269/7958 | 482/18723 | 1.84e-09 | 5.35e-08 | 269 |
| GO:003253522 | Liver | HCC | regulation of cellular component size | 217/7958 | 383/18723 | 1.28e-08 | 3.14e-07 | 217 |
| GO:000155821 | Liver | HCC | regulation of cell growth | 228/7958 | 414/18723 | 1.34e-07 | 2.55e-06 | 228 |
| GO:006056011 | Liver | HCC | developmental growth involved in morphogenesis | 124/7958 | 234/18723 | 7.37e-04 | 4.47e-03 | 124 |
| GO:001097511 | Liver | HCC | regulation of neuron projection development | 220/7958 | 445/18723 | 1.68e-03 | 8.78e-03 | 220 |
| GO:00459263 | Liver | HCC | negative regulation of growth | 129/7958 | 249/18723 | 1.81e-03 | 9.37e-03 | 129 |
| GO:004867511 | Liver | HCC | axon extension | 67/7958 | 120/18723 | 2.17e-03 | 1.09e-02 | 67 |
| GO:199013811 | Liver | HCC | neuron projection extension | 92/7958 | 172/18723 | 2.31e-03 | 1.14e-02 | 92 |
| GO:004858811 | Liver | HCC | developmental cell growth | 121/7958 | 234/18723 | 2.68e-03 | 1.28e-02 | 121 |
| GO:00507674 | Liver | HCC | regulation of neurogenesis | 181/7958 | 364/18723 | 3.00e-03 | 1.40e-02 | 181 |
| GO:00083614 | Liver | HCC | regulation of cell size | 95/7958 | 181/18723 | 4.15e-03 | 1.81e-02 | 95 |
| GO:0030308 | Liver | HCC | negative regulation of cell growth | 98/7958 | 188/18723 | 4.74e-03 | 2.02e-02 | 98 |
| GO:00305164 | Liver | HCC | regulation of axon extension | 52/7958 | 95/18723 | 1.07e-02 | 3.97e-02 | 52 |
| GO:000166721 | Liver | HCC | ameboidal-type cell migration | 226/7958 | 475/18723 | 1.35e-02 | 4.81e-02 | 226 |
| Page: 1 |
| Pathway ID | Tissue | Disease Stage | Description | Gene Ratio | Bg Ratio | pvalue | p.adjust | qvalue | Count |
| Page: 1 |
Top |
Cell-cell communication analysis |
| Identification of potential cell-cell interactions between two cell types and their ligand-receptor pairs for different disease states |
| Ligand | Receptor | LRpair | Pathway | Tissue | Disease Stage |
| Page: 1 |
Top |
Single-cell gene regulatory network inference analysis |
| Find out the significant the regulons (TFs) and the target genes of each regulon across cell types for different disease states |
| TF | Cell Type | Tissue | Disease Stage | Target Gene | RSS | Regulon Activity |
| ∗The dot plots of a searched regulon are shown for all cell subpopulations in each disease state of each tissue based on the regulon specific score inferred using pySCENIC and by calculating the average expression. |
| Page: 1 |
Top |
Somatic mutation of malignant transformation related genes |
| Annotation of somatic variants for genes involved in malignant transformation |
| Hugo Symbol | Variant Class | Variant Classification | dbSNP RS | HGVSc | HGVSp | HGVSp Short | SWISSPROT | BIOTYPE | SIFT | PolyPhen | Tumor Sample Barcode | Tissue | Histology | Sex | Age | Stage | Therapy Types | Drugs | Outcome |
| SEMA4G | SNV | Missense_Mutation | novel | c.1354G>A | p.Asp452Asn | p.D452N | Q9NTN9 | protein_coding | tolerated(0.1) | benign(0.091) | TCGA-AC-A3W6-01 | Breast | breast invasive carcinoma | Female | >=65 | III/IV | Unknown | Unknown | SD |
| SEMA4G | SNV | Missense_Mutation | c.1670N>C | p.Arg557Thr | p.R557T | Q9NTN9 | protein_coding | tolerated(0.2) | benign(0.063) | TCGA-B6-A0I8-01 | Breast | breast invasive carcinoma | Female | <65 | I/II | Unknown | Unknown | PD | |
| SEMA4G | SNV | Missense_Mutation | c.1729N>T | p.Arg577Cys | p.R577C | Q9NTN9 | protein_coding | deleterious(0) | probably_damaging(0.962) | TCGA-C8-A1HL-01 | Breast | breast invasive carcinoma | Female | <65 | III/IV | Unknown | Unknown | SD | |
| SEMA4G | SNV | Missense_Mutation | c.232N>G | p.Ser78Ala | p.S78A | Q9NTN9 | protein_coding | tolerated(1) | benign(0.009) | TCGA-E2-A14O-01 | Breast | breast invasive carcinoma | Female | >=65 | III/IV | Hormone Therapy | arimidex | SD | |
| SEMA4G | SNV | Missense_Mutation | rs145690277 | c.358N>T | p.Arg120Trp | p.R120W | Q9NTN9 | protein_coding | deleterious(0) | probably_damaging(0.999) | TCGA-E9-A3HO-01 | Breast | breast invasive carcinoma | Female | <65 | I/II | Chemotherapy | cyclophosphamide | CR |
| SEMA4G | SNV | Missense_Mutation | novel | c.1381C>A | p.Leu461Met | p.L461M | Q9NTN9 | protein_coding | deleterious(0.01) | benign(0.408) | TCGA-2W-A8YY-01 | Cervix | cervical & endocervical cancer | Female | <65 | I/II | Chemotherapy | cisplatin | CR |
| SEMA4G | SNV | Missense_Mutation | c.388N>T | p.Leu130Phe | p.L130F | Q9NTN9 | protein_coding | deleterious(0.03) | benign(0.191) | TCGA-A6-5665-01 | Colorectum | colon adenocarcinoma | Female | >=65 | I/II | Unknown | Unknown | PD | |
| SEMA4G | SNV | Missense_Mutation | rs777161655 | c.2186N>T | p.Ala729Val | p.A729V | Q9NTN9 | protein_coding | tolerated(0.28) | benign(0.206) | TCGA-AA-3984-01 | Colorectum | colon adenocarcinoma | Female | <65 | I/II | Unknown | Unknown | SD |
| SEMA4G | SNV | Missense_Mutation | c.820N>A | p.Leu274Met | p.L274M | Q9NTN9 | protein_coding | tolerated(0.2) | benign(0.295) | TCGA-AA-A010-01 | Colorectum | colon adenocarcinoma | Female | <65 | I/II | Chemotherapy | folinic | CR | |
| SEMA4G | SNV | Missense_Mutation | novel | c.2053N>A | p.Ala685Thr | p.A685T | Q9NTN9 | protein_coding | tolerated(0.18) | benign(0.007) | TCGA-AY-4070-01 | Colorectum | colon adenocarcinoma | Female | <65 | III/IV | Chemotherapy | 5-fu | PD |
| Page: 1 2 3 4 5 6 |
Top |
Related drugs of malignant transformation related genes |
| Identification of chemicals and drugs interact with genes involved in malignant transfromation |
| (DGIdb 4.0) |
| Entrez ID | Symbol | Category | Interaction Types | Drug Claim Name | Drug Name | PMIDs |
| Page: 1 |

Copyright 2023-Present -The University of Texas Health Science Center at Houston |