
|
|||||
|
 | |
| |
| |
| |
| |
| |
|
Gene: SEMA4F |
Gene summary for SEMA4F |
| Gene information | Species | Human | Gene symbol | SEMA4F | Gene ID | 10505 |
| Gene name | ssemaphorin 4F | |
| Gene Alias | M-SEMA | |
| Cytomap | 2p13.1 | |
| Gene Type | protein-coding | GO ID | GO:0000902 | UniProtAcc | O95754 |
Top |
Malignant transformation analysis |
| Identification of the aberrant gene expression in precancerous and cancerous lesions by comparing the gene expression of stem-like cells in diseased tissues with normal stem cells |
| Entrez ID | Symbol | Replicates | Species | Organ | Tissue | Adj P-value | Log2FC | Malignancy |
| 10505 | SEMA4F | HCC1_Meng | Human | Liver | HCC | 1.96e-04 | -2.22e-03 | 0.0246 |
| 10505 | SEMA4F | HCC1 | Human | Liver | HCC | 3.89e-18 | 1.90e+00 | 0.5336 |
| 10505 | SEMA4F | HCC2 | Human | Liver | HCC | 2.72e-31 | 3.00e+00 | 0.5341 |
| 10505 | SEMA4F | HCC5 | Human | Liver | HCC | 1.28e-22 | 1.74e+00 | 0.4932 |
| 10505 | SEMA4F | S029 | Human | Liver | HCC | 4.64e-03 | 1.25e-01 | 0.2581 |
| Page: 1 |
| Tissue | Expression Dynamics | Abbreviation |
| Liver | 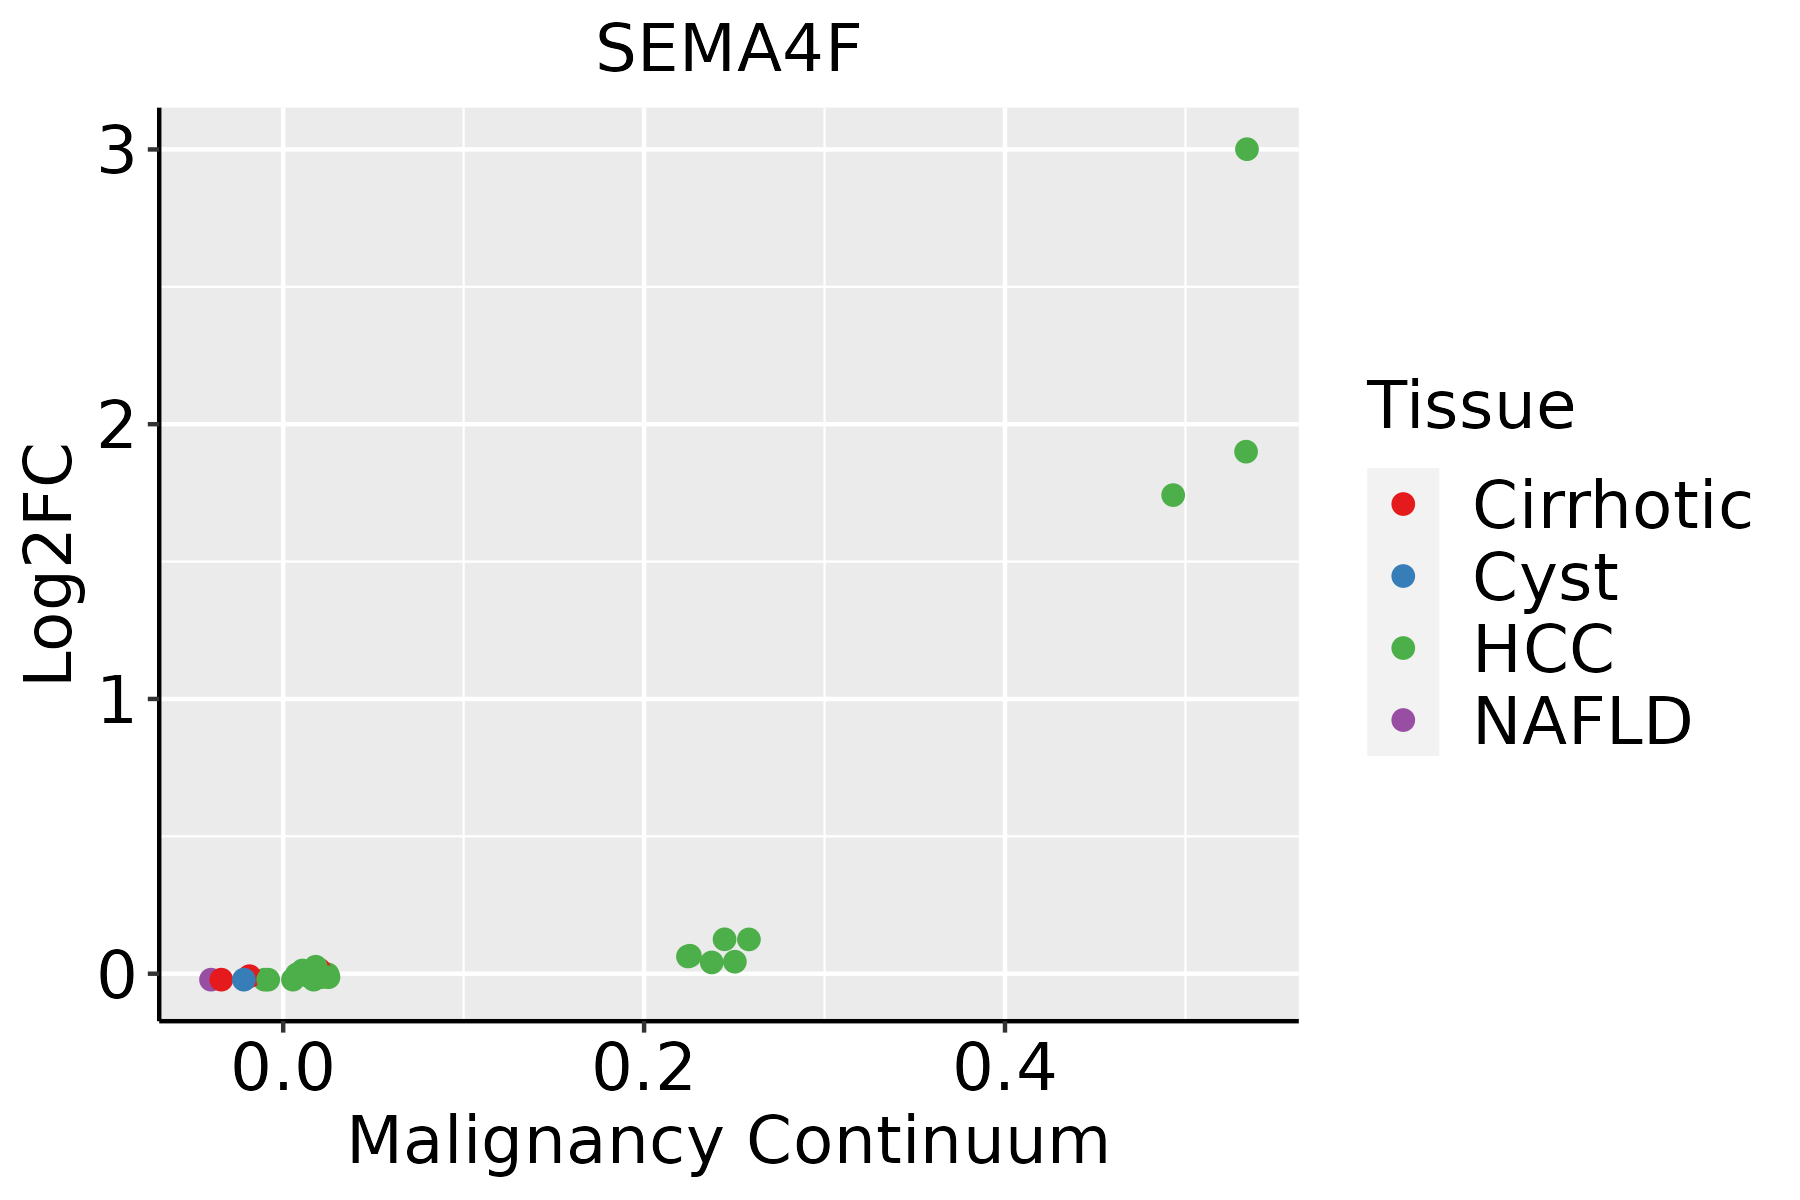 | HCC: Hepatocellular carcinoma |
| NAFLD: Non-alcoholic fatty liver disease |
| ∗log2FC in expression of this searched gene in stem-like cells from each diseased tissue sample relative to stem-like cells in normal samples in each tissue plotted against the malignancy continuum. Samples are colored based on if they are from different disease stage. |
Top |
Malignant transformation related pathway analysis |
| Find out the enriched GO biological processes and KEGG pathways involved in transition from healthy to precancer to cancer |
| Tissue | Disease Stage | Enriched GO biological Processes |
| Colorectum | AD |  |
| Colorectum | SER |  |
| Colorectum | MSS |  |
| Colorectum | MSI-H |  |
| Colorectum | FAP |  |
| ∗Top 15 enriched GO BP terms are showed in the bar plot of each disease state in each tissue. Each row represents a significant GO biological process which is colored according to the -log10(p.adjust). |
| Page: 1 2 3 4 5 6 7 8 9 |
| GO ID | Tissue | Disease Stage | Description | Gene Ratio | Bg Ratio | pvalue | p.adjust | Count |
| GO:001604921 | Liver | HCC | cell growth | 269/7958 | 482/18723 | 1.84e-09 | 5.35e-08 | 269 |
| GO:003253522 | Liver | HCC | regulation of cellular component size | 217/7958 | 383/18723 | 1.28e-08 | 3.14e-07 | 217 |
| GO:000155821 | Liver | HCC | regulation of cell growth | 228/7958 | 414/18723 | 1.34e-07 | 2.55e-06 | 228 |
| GO:006056011 | Liver | HCC | developmental growth involved in morphogenesis | 124/7958 | 234/18723 | 7.37e-04 | 4.47e-03 | 124 |
| GO:001097511 | Liver | HCC | regulation of neuron projection development | 220/7958 | 445/18723 | 1.68e-03 | 8.78e-03 | 220 |
| GO:00459263 | Liver | HCC | negative regulation of growth | 129/7958 | 249/18723 | 1.81e-03 | 9.37e-03 | 129 |
| GO:004867511 | Liver | HCC | axon extension | 67/7958 | 120/18723 | 2.17e-03 | 1.09e-02 | 67 |
| GO:199013811 | Liver | HCC | neuron projection extension | 92/7958 | 172/18723 | 2.31e-03 | 1.14e-02 | 92 |
| GO:004858811 | Liver | HCC | developmental cell growth | 121/7958 | 234/18723 | 2.68e-03 | 1.28e-02 | 121 |
| GO:00507674 | Liver | HCC | regulation of neurogenesis | 181/7958 | 364/18723 | 3.00e-03 | 1.40e-02 | 181 |
| GO:00083614 | Liver | HCC | regulation of cell size | 95/7958 | 181/18723 | 4.15e-03 | 1.81e-02 | 95 |
| GO:0030308 | Liver | HCC | negative regulation of cell growth | 98/7958 | 188/18723 | 4.74e-03 | 2.02e-02 | 98 |
| GO:00305164 | Liver | HCC | regulation of axon extension | 52/7958 | 95/18723 | 1.07e-02 | 3.97e-02 | 52 |
| GO:000166721 | Liver | HCC | ameboidal-type cell migration | 226/7958 | 475/18723 | 1.35e-02 | 4.81e-02 | 226 |
| Page: 1 |
| Pathway ID | Tissue | Disease Stage | Description | Gene Ratio | Bg Ratio | pvalue | p.adjust | qvalue | Count |
| Page: 1 |
Top |
Cell-cell communication analysis |
| Identification of potential cell-cell interactions between two cell types and their ligand-receptor pairs for different disease states |
| Ligand | Receptor | LRpair | Pathway | Tissue | Disease Stage |
| Page: 1 |
Top |
Single-cell gene regulatory network inference analysis |
| Find out the significant the regulons (TFs) and the target genes of each regulon across cell types for different disease states |
| TF | Cell Type | Tissue | Disease Stage | Target Gene | RSS | Regulon Activity |
| ∗The dot plots of a searched regulon are shown for all cell subpopulations in each disease state of each tissue based on the regulon specific score inferred using pySCENIC and by calculating the average expression. |
| Page: 1 |
Top |
Somatic mutation of malignant transformation related genes |
| Annotation of somatic variants for genes involved in malignant transformation |
| Hugo Symbol | Variant Class | Variant Classification | dbSNP RS | HGVSc | HGVSp | HGVSp Short | SWISSPROT | BIOTYPE | SIFT | PolyPhen | Tumor Sample Barcode | Tissue | Histology | Sex | Age | Stage | Therapy Types | Drugs | Outcome |
| SEMA4F | SNV | Missense_Mutation | rs747881367 | c.788N>A | p.Arg263His | p.R263H | O95754 | protein_coding | tolerated(0.24) | benign(0.005) | TCGA-A8-A081-01 | Breast | breast invasive carcinoma | Female | >=65 | I/II | Unknown | Unknown | SD |
| SEMA4F | SNV | Missense_Mutation | rs200194422 | c.448N>A | p.Gly150Arg | p.G150R | O95754 | protein_coding | deleterious(0.01) | probably_damaging(0.923) | TCGA-AN-A046-01 | Breast | breast invasive carcinoma | Female | >=65 | I/II | Unknown | Unknown | SD |
| SEMA4F | SNV | Missense_Mutation | rs199684823 | c.709N>A | p.Glu237Lys | p.E237K | O95754 | protein_coding | tolerated(0.22) | benign(0.019) | TCGA-AN-A046-01 | Breast | breast invasive carcinoma | Female | >=65 | I/II | Unknown | Unknown | SD |
| SEMA4F | SNV | Missense_Mutation | rs373066053 | c.530G>A | p.Arg177Gln | p.R177Q | O95754 | protein_coding | tolerated(0.12) | probably_damaging(0.936) | TCGA-AN-A0XU-01 | Breast | breast invasive carcinoma | Female | <65 | I/II | Unknown | Unknown | SD |
| SEMA4F | SNV | Missense_Mutation | c.1268N>A | p.Gly423Asp | p.G423D | O95754 | protein_coding | tolerated(0.18) | benign(0.141) | TCGA-AO-A128-01 | Breast | breast invasive carcinoma | Female | <65 | I/II | Chemotherapy | doxorubicin | SD | |
| SEMA4F | SNV | Missense_Mutation | rs763504920 | c.371A>G | p.Asn124Ser | p.N124S | O95754 | protein_coding | deleterious(0) | probably_damaging(1) | TCGA-BH-A0BL-01 | Breast | breast invasive carcinoma | Female | <65 | I/II | Chemotherapy | adriamycin | CR |
| SEMA4F | SNV | Missense_Mutation | c.2150C>T | p.Pro717Leu | p.P717L | O95754 | protein_coding | deleterious(0.01) | possibly_damaging(0.879) | TCGA-BH-A0BT-01 | Breast | breast invasive carcinoma | Female | <65 | I/II | Chemotherapy | adriamycin | CR | |
| SEMA4F | SNV | Missense_Mutation | novel | c.1966N>T | p.Ala656Ser | p.A656S | O95754 | protein_coding | tolerated(0.51) | benign(0.204) | TCGA-BH-A0H9-01 | Breast | breast invasive carcinoma | Female | >=65 | I/II | Hormone Therapy | arimidex | SD |
| SEMA4F | SNV | Missense_Mutation | c.1778N>C | p.Trp593Ser | p.W593S | O95754 | protein_coding | deleterious(0) | possibly_damaging(0.573) | TCGA-D8-A1J8-01 | Breast | breast invasive carcinoma | Female | >=65 | I/II | Hormone Therapy | nolvadex | SD | |
| SEMA4F | SNV | Missense_Mutation | rs201138724 | c.242C>T | p.Ala81Val | p.A81V | O95754 | protein_coding | deleterious(0) | possibly_damaging(0.863) | TCGA-GI-A2C8-01 | Breast | breast invasive carcinoma | Female | <65 | III/IV | Unspecific | Adriamycin | SD |
| Page: 1 2 3 4 5 6 7 8 9 10 |
Top |
Related drugs of malignant transformation related genes |
| Identification of chemicals and drugs interact with genes involved in malignant transfromation |
| (DGIdb 4.0) |
| Entrez ID | Symbol | Category | Interaction Types | Drug Claim Name | Drug Name | PMIDs |
| Page: 1 |

Copyright 2023-Present -The University of Texas Health Science Center at Houston |