
|
|||||
|
 | |
| |
| |
| |
| |
| |
|
Gene: SEMA4C |
Gene summary for SEMA4C |
| Gene information | Species | Human | Gene symbol | SEMA4C | Gene ID | 54910 |
| Gene name | semaphorin 4C | |
| Gene Alias | M-SEMA-F | |
| Cytomap | 2q11.2 | |
| Gene Type | protein-coding | GO ID | GO:0000165 | UniProtAcc | Q9C0C4 |
Top |
Malignant transformation analysis |
| Identification of the aberrant gene expression in precancerous and cancerous lesions by comparing the gene expression of stem-like cells in diseased tissues with normal stem cells |
| Entrez ID | Symbol | Replicates | Species | Organ | Tissue | Adj P-value | Log2FC | Malignancy |
| 54910 | SEMA4C | LZE8T | Human | Esophagus | ESCC | 6.17e-03 | 7.58e-02 | 0.067 |
| 54910 | SEMA4C | P1T-E | Human | Esophagus | ESCC | 7.94e-05 | 2.39e-01 | 0.0875 |
| 54910 | SEMA4C | P2T-E | Human | Esophagus | ESCC | 6.35e-14 | 2.50e-01 | 0.1177 |
| 54910 | SEMA4C | P4T-E | Human | Esophagus | ESCC | 3.05e-13 | 1.88e-01 | 0.1323 |
| 54910 | SEMA4C | P8T-E | Human | Esophagus | ESCC | 1.28e-11 | 1.11e-01 | 0.0889 |
| 54910 | SEMA4C | P10T-E | Human | Esophagus | ESCC | 9.26e-12 | 1.77e-01 | 0.116 |
| 54910 | SEMA4C | P11T-E | Human | Esophagus | ESCC | 1.33e-05 | 1.16e-01 | 0.1426 |
| 54910 | SEMA4C | P12T-E | Human | Esophagus | ESCC | 6.43e-21 | 3.36e-01 | 0.1122 |
| 54910 | SEMA4C | P15T-E | Human | Esophagus | ESCC | 1.78e-12 | 1.72e-01 | 0.1149 |
| 54910 | SEMA4C | P16T-E | Human | Esophagus | ESCC | 1.95e-09 | 9.11e-02 | 0.1153 |
| 54910 | SEMA4C | P20T-E | Human | Esophagus | ESCC | 1.46e-04 | 1.00e-02 | 0.1124 |
| 54910 | SEMA4C | P21T-E | Human | Esophagus | ESCC | 7.65e-06 | 8.19e-02 | 0.1617 |
| 54910 | SEMA4C | P22T-E | Human | Esophagus | ESCC | 3.19e-13 | 8.22e-02 | 0.1236 |
| 54910 | SEMA4C | P23T-E | Human | Esophagus | ESCC | 2.51e-11 | 9.41e-02 | 0.108 |
| 54910 | SEMA4C | P24T-E | Human | Esophagus | ESCC | 1.12e-05 | 5.48e-02 | 0.1287 |
| 54910 | SEMA4C | P26T-E | Human | Esophagus | ESCC | 8.05e-12 | 1.13e-01 | 0.1276 |
| 54910 | SEMA4C | P27T-E | Human | Esophagus | ESCC | 2.76e-11 | 1.01e-01 | 0.1055 |
| 54910 | SEMA4C | P28T-E | Human | Esophagus | ESCC | 4.46e-13 | 1.32e-01 | 0.1149 |
| 54910 | SEMA4C | P30T-E | Human | Esophagus | ESCC | 3.18e-09 | 2.88e-01 | 0.137 |
| 54910 | SEMA4C | P31T-E | Human | Esophagus | ESCC | 1.12e-03 | -3.00e-03 | 0.1251 |
| Page: 1 2 3 |
| Tissue | Expression Dynamics | Abbreviation |
| Esophagus | 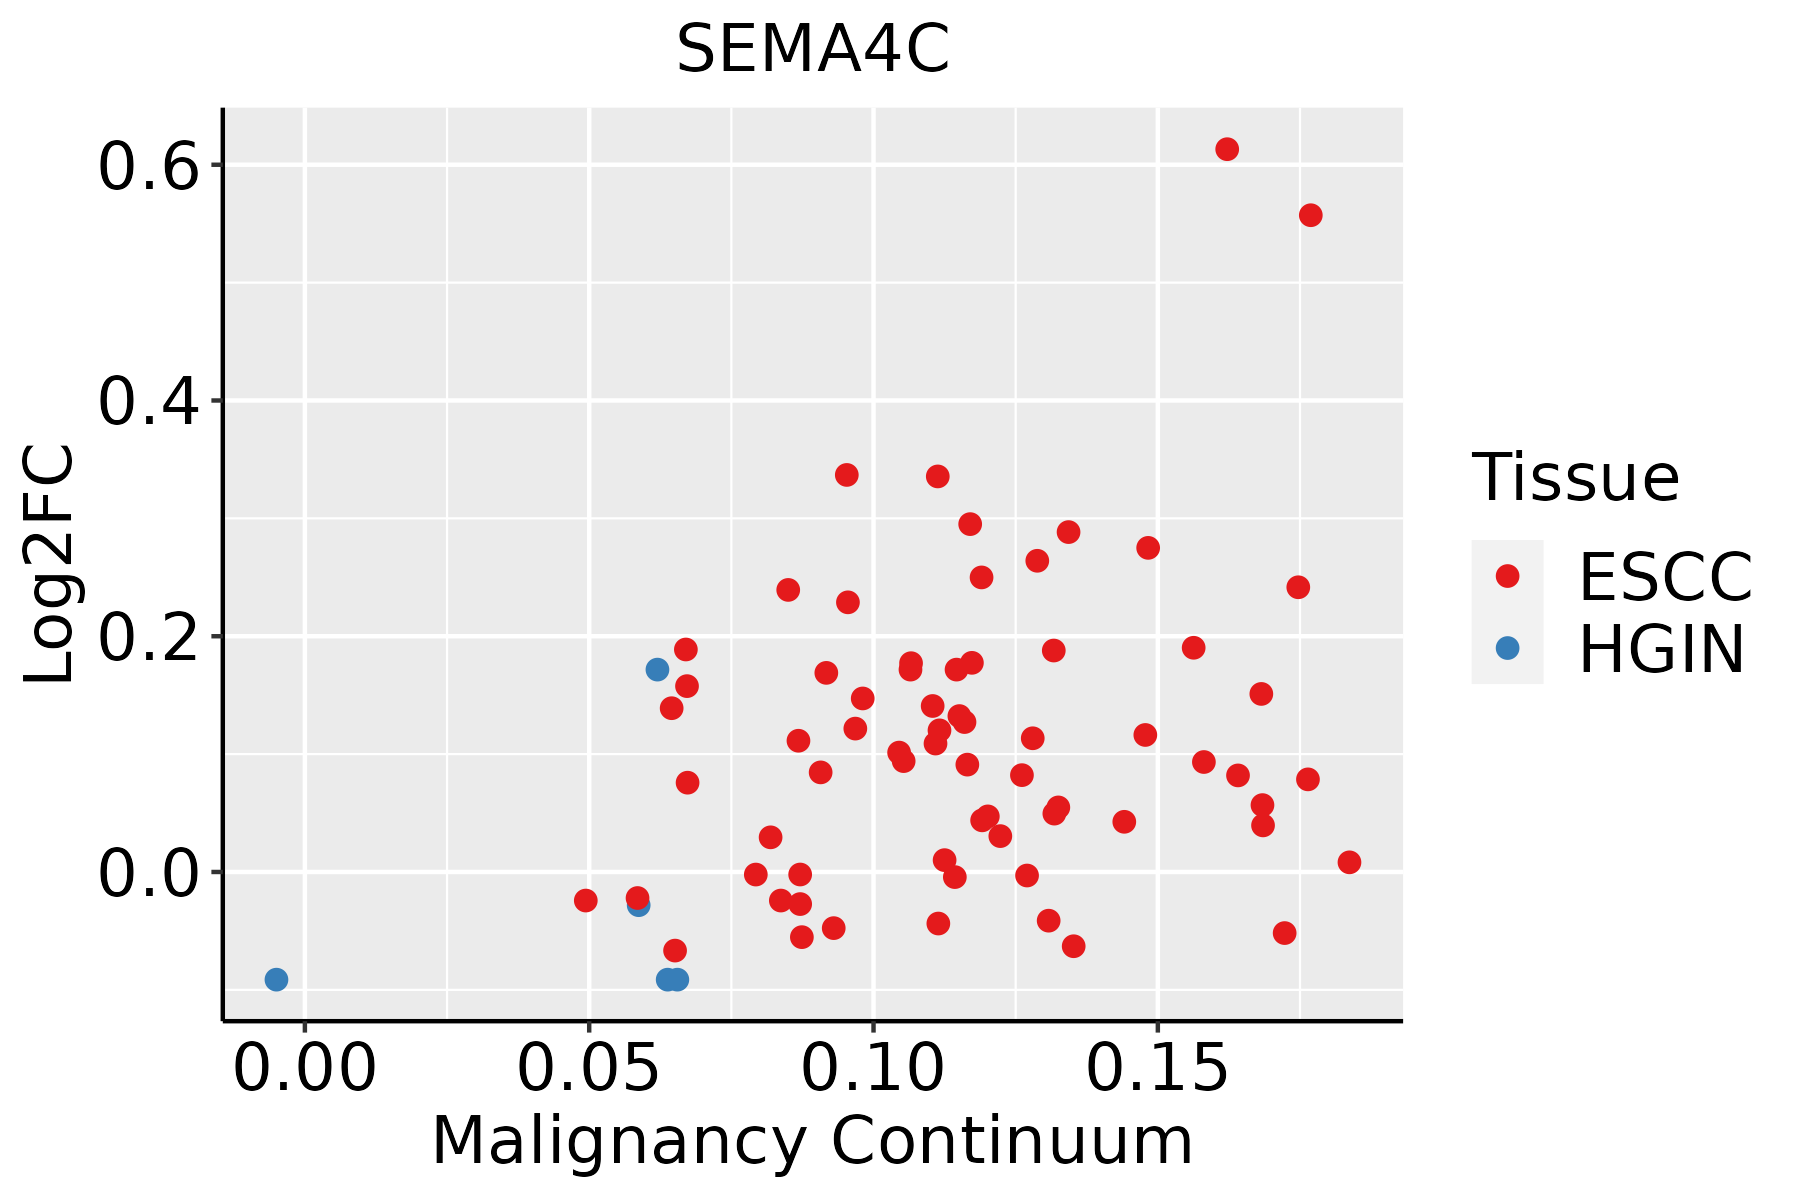 | ESCC: Esophageal squamous cell carcinoma |
| HGIN: High-grade intraepithelial neoplasias | ||
| LGIN: Low-grade intraepithelial neoplasias | ||
| Oral Cavity |  | EOLP: Erosive Oral lichen planus |
| LP: leukoplakia | ||
| NEOLP: Non-erosive oral lichen planus | ||
| OSCC: Oral squamous cell carcinoma |
| ∗log2FC in expression of this searched gene in stem-like cells from each diseased tissue sample relative to stem-like cells in normal samples in each tissue plotted against the malignancy continuum. Samples are colored based on if they are from different disease stage. |
Top |
Malignant transformation related pathway analysis |
| Find out the enriched GO biological processes and KEGG pathways involved in transition from healthy to precancer to cancer |
| Tissue | Disease Stage | Enriched GO biological Processes |
| Colorectum | AD |  |
| Colorectum | SER |  |
| Colorectum | MSS |  |
| Colorectum | MSI-H |  |
| Colorectum | FAP |  |
| ∗Top 15 enriched GO BP terms are showed in the bar plot of each disease state in each tissue. Each row represents a significant GO biological process which is colored according to the -log10(p.adjust). |
| Page: 1 2 3 4 5 6 7 8 9 |
| GO ID | Tissue | Disease Stage | Description | Gene Ratio | Bg Ratio | pvalue | p.adjust | Count |
| GO:0016049110 | Esophagus | ESCC | cell growth | 289/8552 | 482/18723 | 1.29e-10 | 3.77e-09 | 289 |
| GO:000155819 | Esophagus | ESCC | regulation of cell growth | 248/8552 | 414/18723 | 2.97e-09 | 6.45e-08 | 248 |
| GO:000184115 | Esophagus | ESCC | neural tube formation | 75/8552 | 102/18723 | 9.68e-09 | 1.95e-07 | 75 |
| GO:000184314 | Esophagus | ESCC | neural tube closure | 66/8552 | 88/18723 | 1.98e-08 | 3.82e-07 | 66 |
| GO:001402014 | Esophagus | ESCC | primary neural tube formation | 69/8552 | 94/18723 | 4.22e-08 | 7.76e-07 | 69 |
| GO:006060614 | Esophagus | ESCC | tube closure | 66/8552 | 89/18723 | 4.24e-08 | 7.76e-07 | 66 |
| GO:003253520 | Esophagus | ESCC | regulation of cellular component size | 227/8552 | 383/18723 | 4.77e-08 | 8.60e-07 | 227 |
| GO:003109818 | Esophagus | ESCC | stress-activated protein kinase signaling cascade | 154/8552 | 247/18723 | 8.53e-08 | 1.44e-06 | 154 |
| GO:00219159 | Esophagus | ESCC | neural tube development | 101/8552 | 152/18723 | 1.78e-07 | 2.79e-06 | 101 |
| GO:00163316 | Esophagus | ESCC | morphogenesis of embryonic epithelium | 98/8552 | 147/18723 | 2.12e-07 | 3.27e-06 | 98 |
| GO:000183814 | Esophagus | ESCC | embryonic epithelial tube formation | 83/8552 | 121/18723 | 2.78e-07 | 4.08e-06 | 83 |
| GO:005140318 | Esophagus | ESCC | stress-activated MAPK cascade | 147/8552 | 239/18723 | 5.43e-07 | 7.18e-06 | 147 |
| GO:003514815 | Esophagus | ESCC | tube formation | 96/8552 | 148/18723 | 1.86e-06 | 2.16e-05 | 96 |
| GO:00721759 | Esophagus | ESCC | epithelial tube formation | 86/8552 | 132/18723 | 4.81e-06 | 5.10e-05 | 86 |
| GO:00459267 | Esophagus | ESCC | negative regulation of growth | 148/8552 | 249/18723 | 7.88e-06 | 7.73e-05 | 148 |
| GO:006056210 | Esophagus | ESCC | epithelial tube morphogenesis | 187/8552 | 325/18723 | 9.95e-06 | 9.44e-05 | 187 |
| GO:007030217 | Esophagus | ESCC | regulation of stress-activated protein kinase signaling cascade | 119/8552 | 195/18723 | 1.07e-05 | 1.01e-04 | 119 |
| GO:003287217 | Esophagus | ESCC | regulation of stress-activated MAPK cascade | 116/8552 | 192/18723 | 2.63e-05 | 2.21e-04 | 116 |
| GO:00488638 | Esophagus | ESCC | stem cell differentiation | 122/8552 | 206/18723 | 5.95e-05 | 4.59e-04 | 122 |
| GO:005076710 | Esophagus | ESCC | regulation of neurogenesis | 203/8552 | 364/18723 | 6.10e-05 | 4.68e-04 | 203 |
| Page: 1 2 3 4 5 |
| Pathway ID | Tissue | Disease Stage | Description | Gene Ratio | Bg Ratio | pvalue | p.adjust | qvalue | Count |
| hsa0436016 | Esophagus | ESCC | Axon guidance | 108/4205 | 182/8465 | 5.13e-03 | 1.30e-02 | 6.67e-03 | 108 |
| hsa0436017 | Esophagus | ESCC | Axon guidance | 108/4205 | 182/8465 | 5.13e-03 | 1.30e-02 | 6.67e-03 | 108 |
| hsa0436014 | Oral cavity | OSCC | Axon guidance | 97/3704 | 182/8465 | 5.59e-03 | 1.33e-02 | 6.76e-03 | 97 |
| hsa0436015 | Oral cavity | OSCC | Axon guidance | 97/3704 | 182/8465 | 5.59e-03 | 1.33e-02 | 6.76e-03 | 97 |
| Page: 1 |
Top |
Cell-cell communication analysis |
| Identification of potential cell-cell interactions between two cell types and their ligand-receptor pairs for different disease states |
| Ligand | Receptor | LRpair | Pathway | Tissue | Disease Stage |
| SEMA4C | PLXNB2 | SEMA4C_PLXNB2 | SEMA4 | CRC | MSI-H |
| SEMA4C | PLXNB2 | SEMA4C_PLXNB2 | SEMA4 | CRC | MSS |
| SEMA4C | PLXNB2 | SEMA4C_PLXNB2 | SEMA4 | Endometrium | AEH |
| SEMA4C | PLXNB2 | SEMA4C_PLXNB2 | SEMA4 | Endometrium | Healthy |
| SEMA4C | PLXNB2 | SEMA4C_PLXNB2 | SEMA4 | HNSCC | Precancer |
| SEMA4C | PLXNB2 | SEMA4C_PLXNB2 | SEMA4 | Liver | Healthy |
| Page: 1 |
Top |
Single-cell gene regulatory network inference analysis |
| Find out the significant the regulons (TFs) and the target genes of each regulon across cell types for different disease states |
| TF | Cell Type | Tissue | Disease Stage | Target Gene | RSS | Regulon Activity |
| ∗The dot plots of a searched regulon are shown for all cell subpopulations in each disease state of each tissue based on the regulon specific score inferred using pySCENIC and by calculating the average expression. |
| Page: 1 |
Top |
Somatic mutation of malignant transformation related genes |
| Annotation of somatic variants for genes involved in malignant transformation |
| Hugo Symbol | Variant Class | Variant Classification | dbSNP RS | HGVSc | HGVSp | HGVSp Short | SWISSPROT | BIOTYPE | SIFT | PolyPhen | Tumor Sample Barcode | Tissue | Histology | Sex | Age | Stage | Therapy Types | Drugs | Outcome |
| SEMA4C | SNV | Missense_Mutation | c.295T>C | p.Cys99Arg | p.C99R | Q9C0C4 | protein_coding | deleterious(0) | probably_damaging(0.971) | TCGA-A7-A26G-01 | Breast | breast invasive carcinoma | Female | <65 | I/II | Chemotherapy | taxotere | SD | |
| SEMA4C | SNV | Missense_Mutation | novel | c.1008G>T | p.Glu336Asp | p.E336D | Q9C0C4 | protein_coding | tolerated(1) | benign(0.006) | TCGA-AC-A62V-01 | Breast | breast invasive carcinoma | Male | <65 | III/IV | Targeted Molecular therapy | denosumab | PD |
| SEMA4C | SNV | Missense_Mutation | c.1555N>C | p.Trp519Arg | p.W519R | Q9C0C4 | protein_coding | deleterious(0) | probably_damaging(1) | TCGA-AO-A128-01 | Breast | breast invasive carcinoma | Female | <65 | I/II | Chemotherapy | doxorubicin | SD | |
| SEMA4C | SNV | Missense_Mutation | novel | c.113N>C | p.Leu38Pro | p.L38P | Q9C0C4 | protein_coding | deleterious(0) | probably_damaging(0.987) | TCGA-BH-A0E2-01 | Breast | breast invasive carcinoma | Female | <65 | III/IV | Chemotherapy | doxorubicin | SD |
| SEMA4C | SNV | Missense_Mutation | novel | c.830C>T | p.Thr277Met | p.T277M | Q9C0C4 | protein_coding | deleterious(0) | probably_damaging(0.987) | TCGA-D8-A3Z6-01 | Breast | breast invasive carcinoma | Female | <65 | III/IV | Chemotherapy | cyclophosphane | SD |
| SEMA4C | insertion | Nonsense_Mutation | novel | c.2292_2293insCTGGGTCCTCCTGGTGAGTCATTGGAGCTATGAAGG | p.Gly764_Ile765insLeuGlyProProGlyGluSerLeuGluLeuTerArg | p.G764_I765insLGPPGESLEL*R | Q9C0C4 | protein_coding | TCGA-A2-A0D1-01 | Breast | breast invasive carcinoma | Female | >=65 | I/II | Chemotherapy | taxotere | SD | ||
| SEMA4C | insertion | Frame_Shift_Ins | novel | c.113_114insA | p.Ala39GlyfsTer60 | p.A39Gfs*60 | Q9C0C4 | protein_coding | TCGA-BH-A0E2-01 | Breast | breast invasive carcinoma | Female | <65 | III/IV | Chemotherapy | doxorubicin | SD | ||
| SEMA4C | SNV | Missense_Mutation | c.2059C>T | p.Arg687Cys | p.R687C | Q9C0C4 | protein_coding | tolerated(0.14) | possibly_damaging(0.877) | TCGA-2W-A8YY-01 | Cervix | cervical & endocervical cancer | Female | <65 | I/II | Chemotherapy | cisplatin | CR | |
| SEMA4C | SNV | Missense_Mutation | c.172N>G | p.Leu58Val | p.L58V | Q9C0C4 | protein_coding | deleterious(0) | probably_damaging(0.998) | TCGA-DS-A1OC-01 | Cervix | cervical & endocervical cancer | Female | <65 | I/II | Chemotherapy | gemcitabine | SD | |
| SEMA4C | SNV | Missense_Mutation | rs780410537 | c.104N>T | p.Ser35Phe | p.S35F | Q9C0C4 | protein_coding | tolerated(0.45) | benign(0.003) | TCGA-EA-A3HU-01 | Cervix | cervical & endocervical cancer | Female | <65 | I/II | Unknown | Unknown | SD |
| Page: 1 2 3 4 5 6 7 8 |
Top |
Related drugs of malignant transformation related genes |
| Identification of chemicals and drugs interact with genes involved in malignant transfromation |
| (DGIdb 4.0) |
| Entrez ID | Symbol | Category | Interaction Types | Drug Claim Name | Drug Name | PMIDs |
| Page: 1 |

Copyright 2023-Present -The University of Texas Health Science Center at Houston |