
|
|||||
|
 | |
| |
| |
| |
| |
| |
|
Gene: SEMA4B |
Gene summary for SEMA4B |
| Gene information | Species | Human | Gene symbol | SEMA4B | Gene ID | 10509 |
| Gene name | semaphorin 4B | |
| Gene Alias | SEMAC | |
| Cytomap | 15q26.1 | |
| Gene Type | protein-coding | GO ID | GO:0000902 | UniProtAcc | J3KNP4 |
Top |
Malignant transformation analysis |
| Identification of the aberrant gene expression in precancerous and cancerous lesions by comparing the gene expression of stem-like cells in diseased tissues with normal stem cells |
| Entrez ID | Symbol | Replicates | Species | Organ | Tissue | Adj P-value | Log2FC | Malignancy |
| 10509 | SEMA4B | CA_HPV_2 | Human | Cervix | CC | 3.02e-04 | 2.99e-01 | 0.0391 |
| 10509 | SEMA4B | CCI_1 | Human | Cervix | CC | 1.23e-17 | 1.70e+00 | 0.528 |
| 10509 | SEMA4B | CCI_2 | Human | Cervix | CC | 1.43e-12 | 1.43e+00 | 0.5249 |
| 10509 | SEMA4B | CCI_3 | Human | Cervix | CC | 3.53e-19 | 1.45e+00 | 0.516 |
| 10509 | SEMA4B | CCII_1 | Human | Cervix | CC | 8.98e-06 | 5.03e-01 | 0.3249 |
| 10509 | SEMA4B | Tumor | Human | Cervix | CC | 5.08e-26 | 6.05e-01 | 0.1241 |
| 10509 | SEMA4B | sample3 | Human | Cervix | CC | 3.10e-46 | 7.62e-01 | 0.1387 |
| 10509 | SEMA4B | T3 | Human | Cervix | CC | 2.83e-36 | 7.16e-01 | 0.1389 |
| 10509 | SEMA4B | HTA11_2487_2000001011 | Human | Colorectum | SER | 5.41e-05 | 6.04e-01 | -0.1808 |
| 10509 | SEMA4B | HTA11_1938_2000001011 | Human | Colorectum | AD | 6.37e-07 | 6.75e-01 | -0.0811 |
| 10509 | SEMA4B | HTA11_347_2000001011 | Human | Colorectum | AD | 1.14e-09 | 5.40e-01 | -0.1954 |
| 10509 | SEMA4B | HTA11_411_2000001011 | Human | Colorectum | SER | 1.55e-05 | 1.43e+00 | -0.2602 |
| 10509 | SEMA4B | HTA11_696_2000001011 | Human | Colorectum | AD | 3.73e-07 | 5.89e-01 | -0.1464 |
| 10509 | SEMA4B | HTA11_866_2000001011 | Human | Colorectum | AD | 3.13e-02 | 3.58e-01 | -0.1001 |
| 10509 | SEMA4B | HTA11_1391_2000001011 | Human | Colorectum | AD | 2.40e-04 | 5.75e-01 | -0.059 |
| 10509 | SEMA4B | A015-C-203 | Human | Colorectum | FAP | 1.79e-09 | -1.73e-01 | -0.1294 |
| 10509 | SEMA4B | A015-C-204 | Human | Colorectum | FAP | 5.38e-03 | -1.84e-01 | -0.0228 |
| 10509 | SEMA4B | A002-C-201 | Human | Colorectum | FAP | 2.60e-04 | -1.30e-01 | 0.0324 |
| 10509 | SEMA4B | A001-C-108 | Human | Colorectum | FAP | 1.45e-02 | -5.72e-02 | -0.0272 |
| 10509 | SEMA4B | A002-C-205 | Human | Colorectum | FAP | 4.80e-09 | -2.11e-01 | -0.1236 |
| Page: 1 2 3 4 5 6 7 8 |
| Tissue | Expression Dynamics | Abbreviation |
| Cervix | 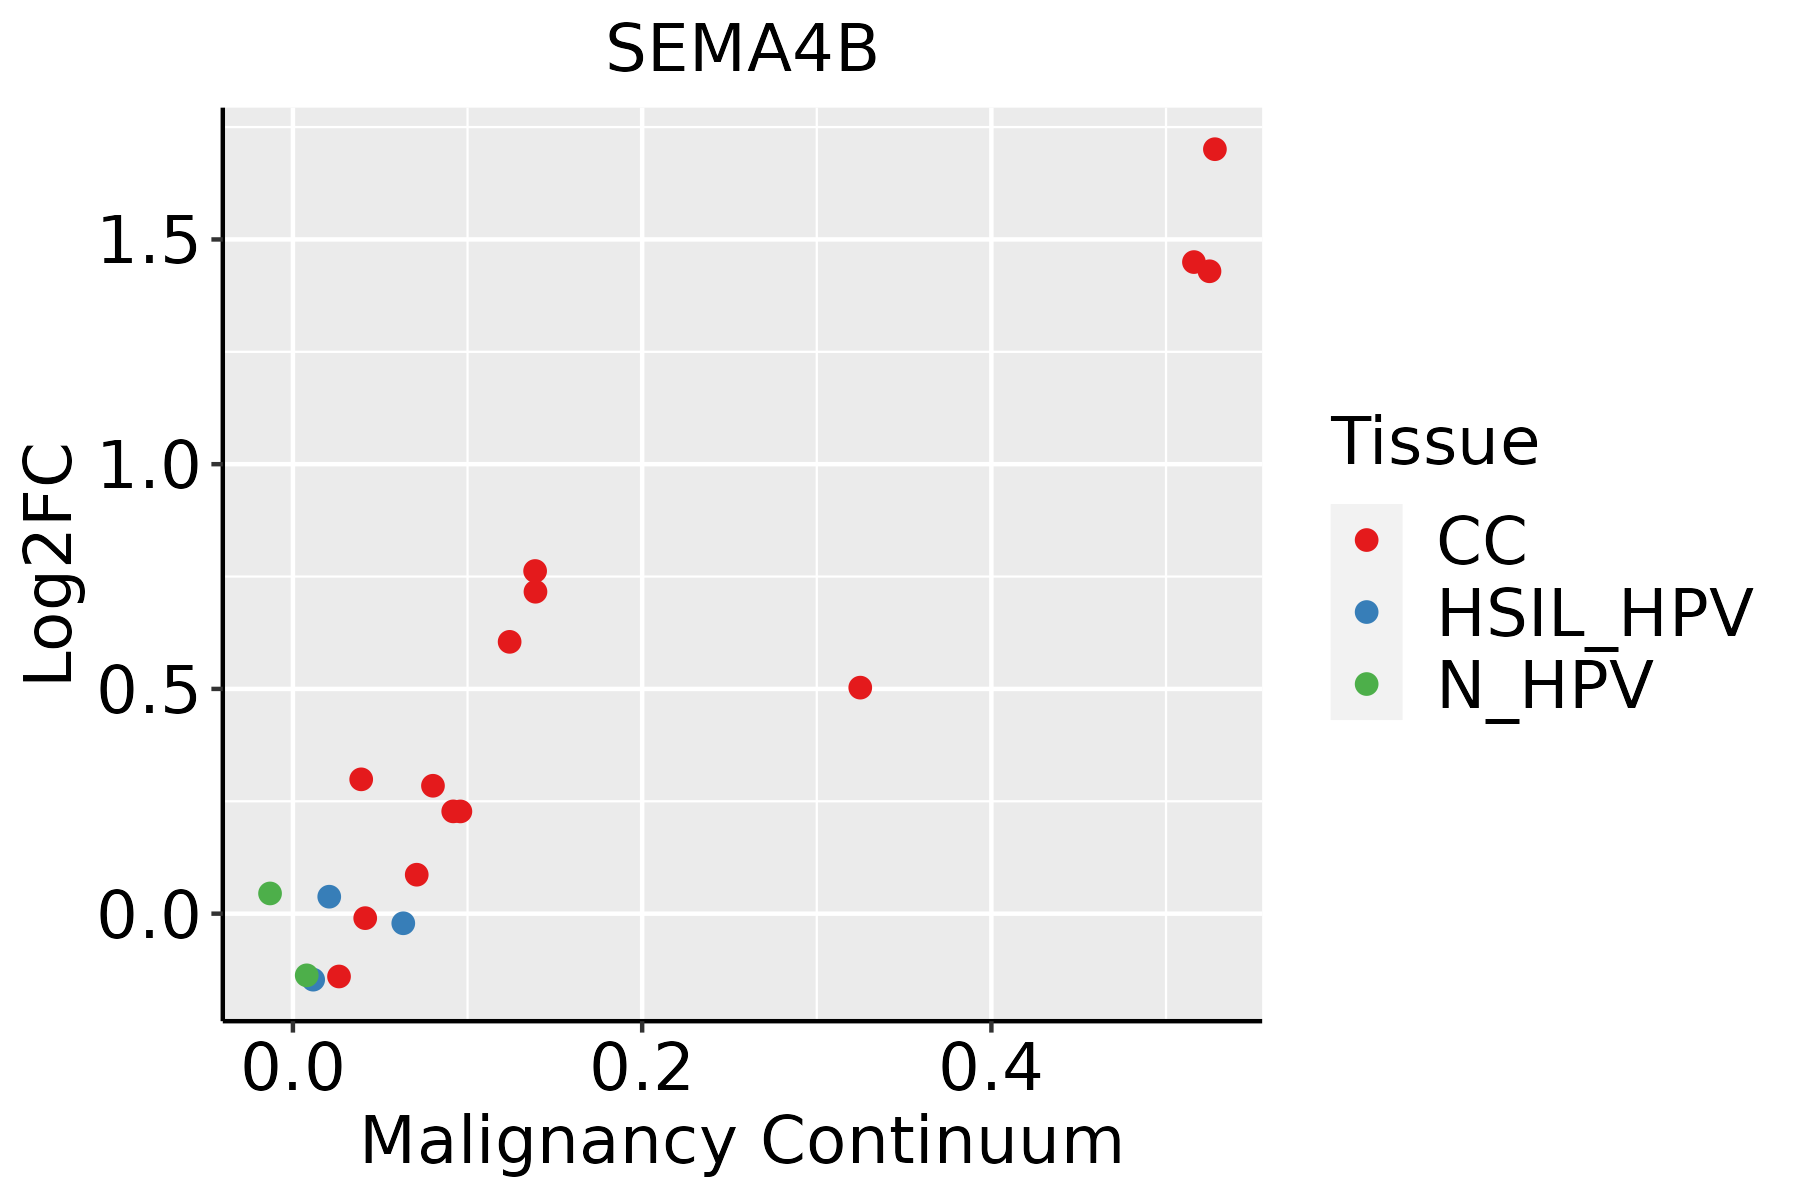 | CC: Cervix cancer |
| HSIL_HPV: HPV-infected high-grade squamous intraepithelial lesions | ||
| N_HPV: HPV-infected normal cervix | ||
| Colorectum (GSE201348) |  | FAP: Familial adenomatous polyposis |
| CRC: Colorectal cancer | ||
| Colorectum (HTA11) |  | AD: Adenomas |
| SER: Sessile serrated lesions | ||
| MSI-H: Microsatellite-high colorectal cancer | ||
| MSS: Microsatellite stable colorectal cancer | ||
| Esophagus | 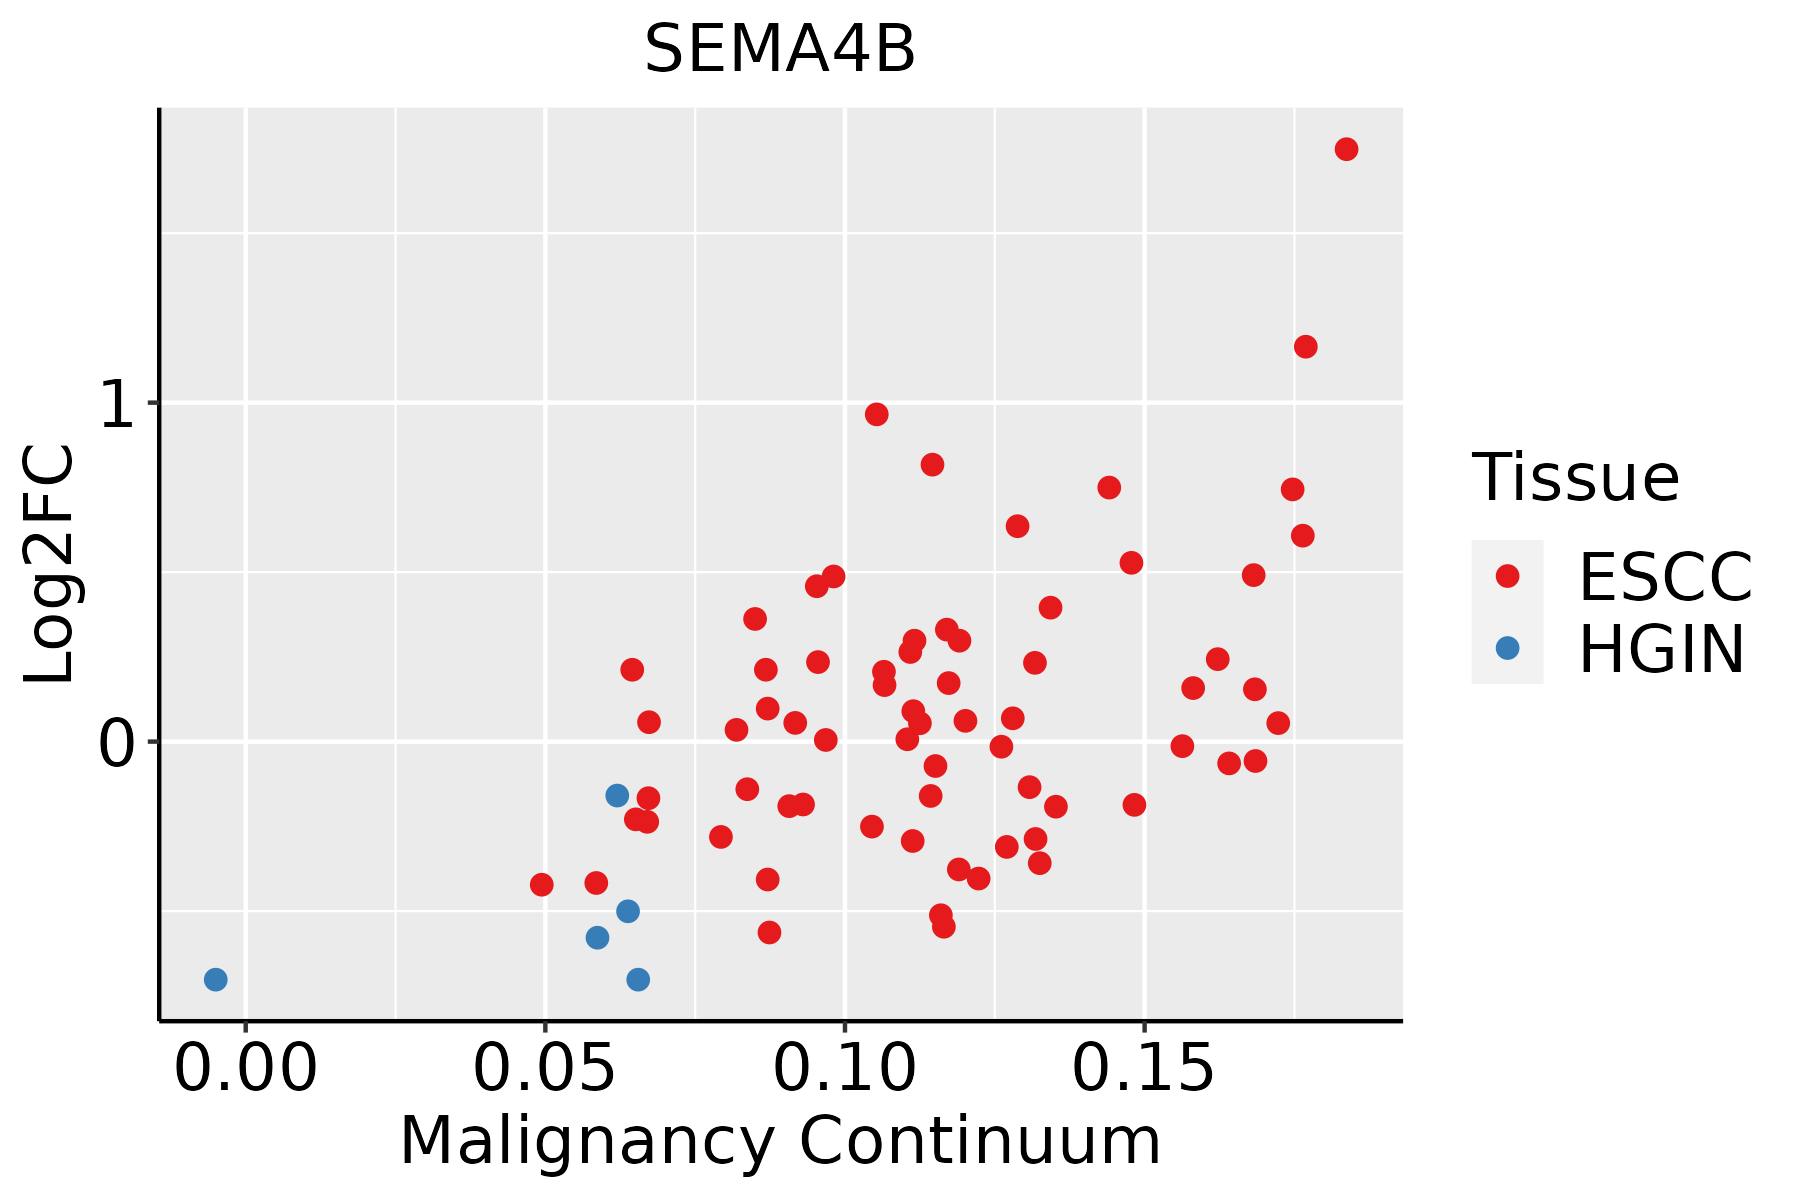 | ESCC: Esophageal squamous cell carcinoma |
| HGIN: High-grade intraepithelial neoplasias | ||
| LGIN: Low-grade intraepithelial neoplasias | ||
| Liver |  | HCC: Hepatocellular carcinoma |
| NAFLD: Non-alcoholic fatty liver disease | ||
| Lung |  | AAH: Atypical adenomatous hyperplasia |
| AIS: Adenocarcinoma in situ | ||
| IAC: Invasive lung adenocarcinoma | ||
| MIA: Minimally invasive adenocarcinoma | ||
| Oral Cavity | 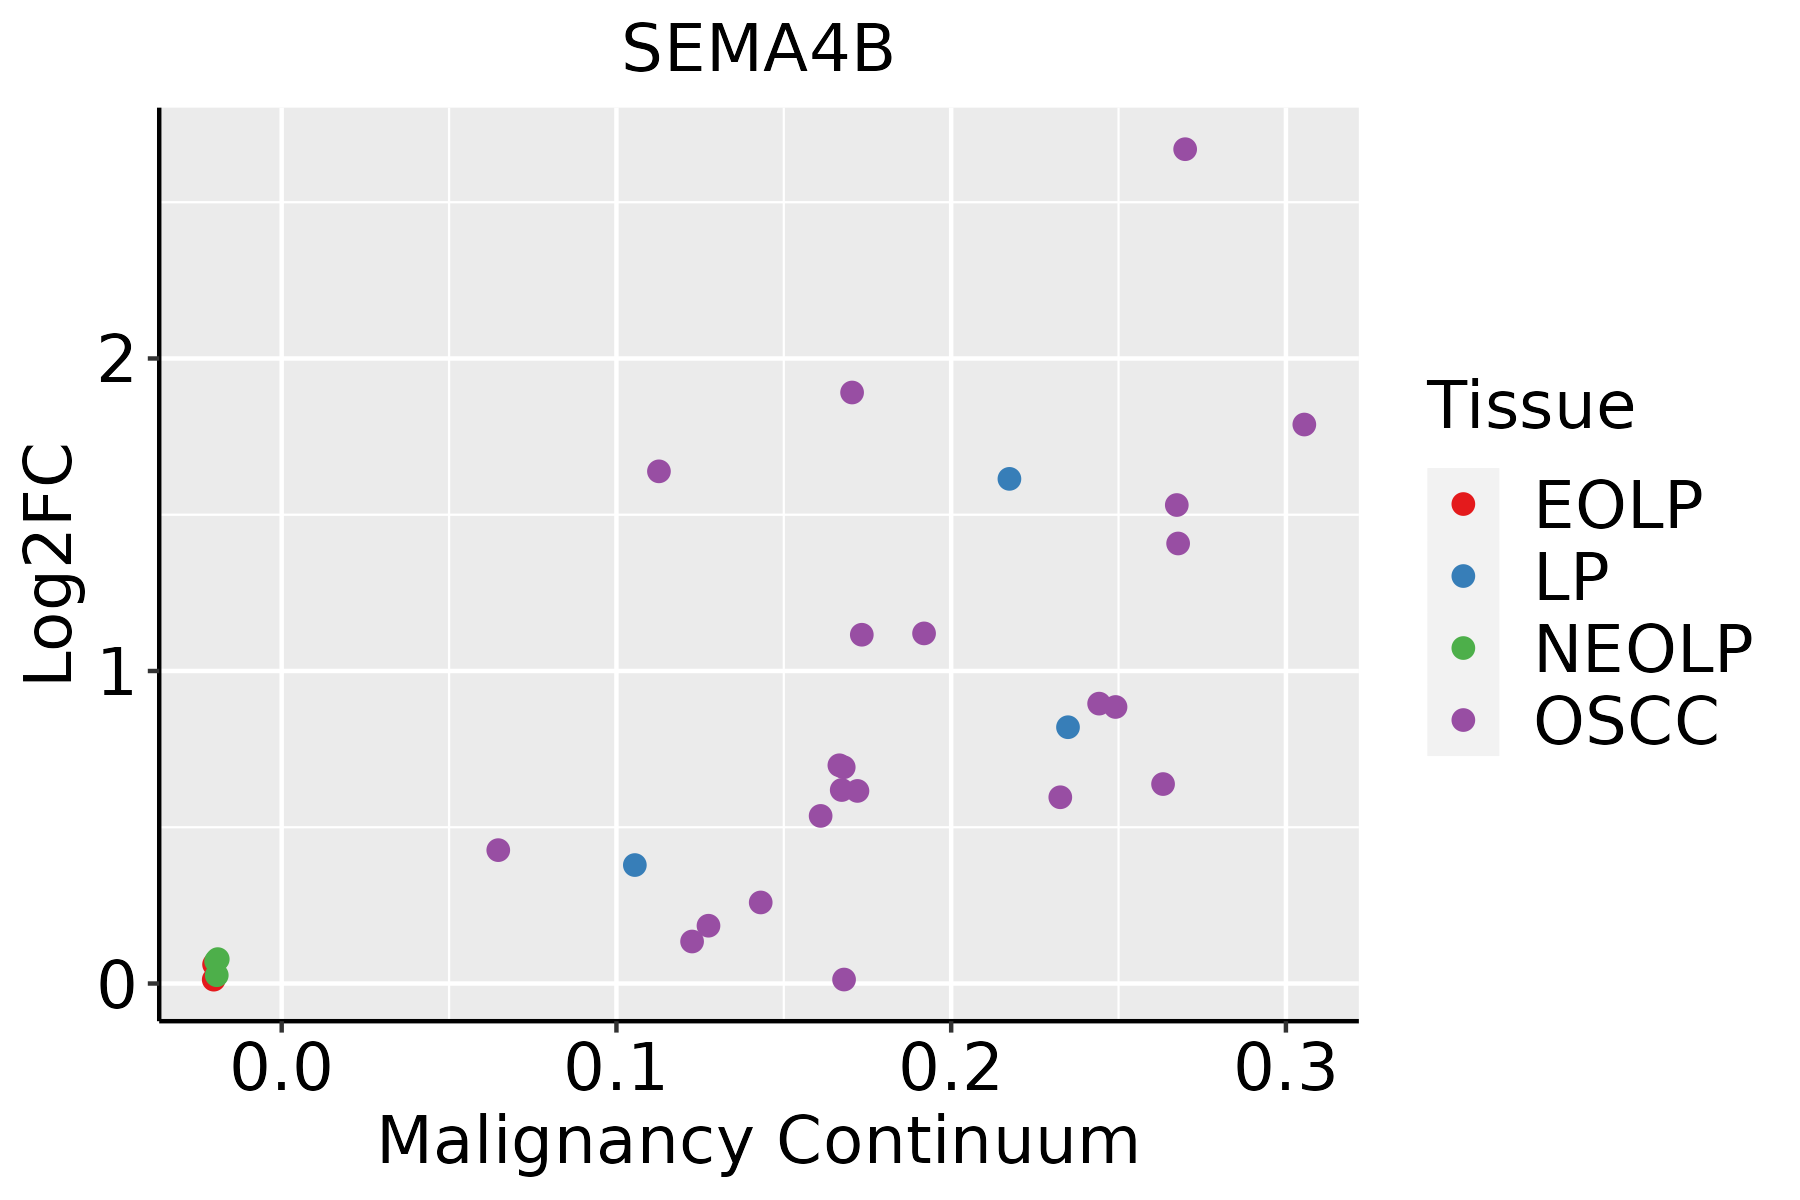 | EOLP: Erosive Oral lichen planus |
| LP: leukoplakia | ||
| NEOLP: Non-erosive oral lichen planus | ||
| OSCC: Oral squamous cell carcinoma | ||
| Skin | 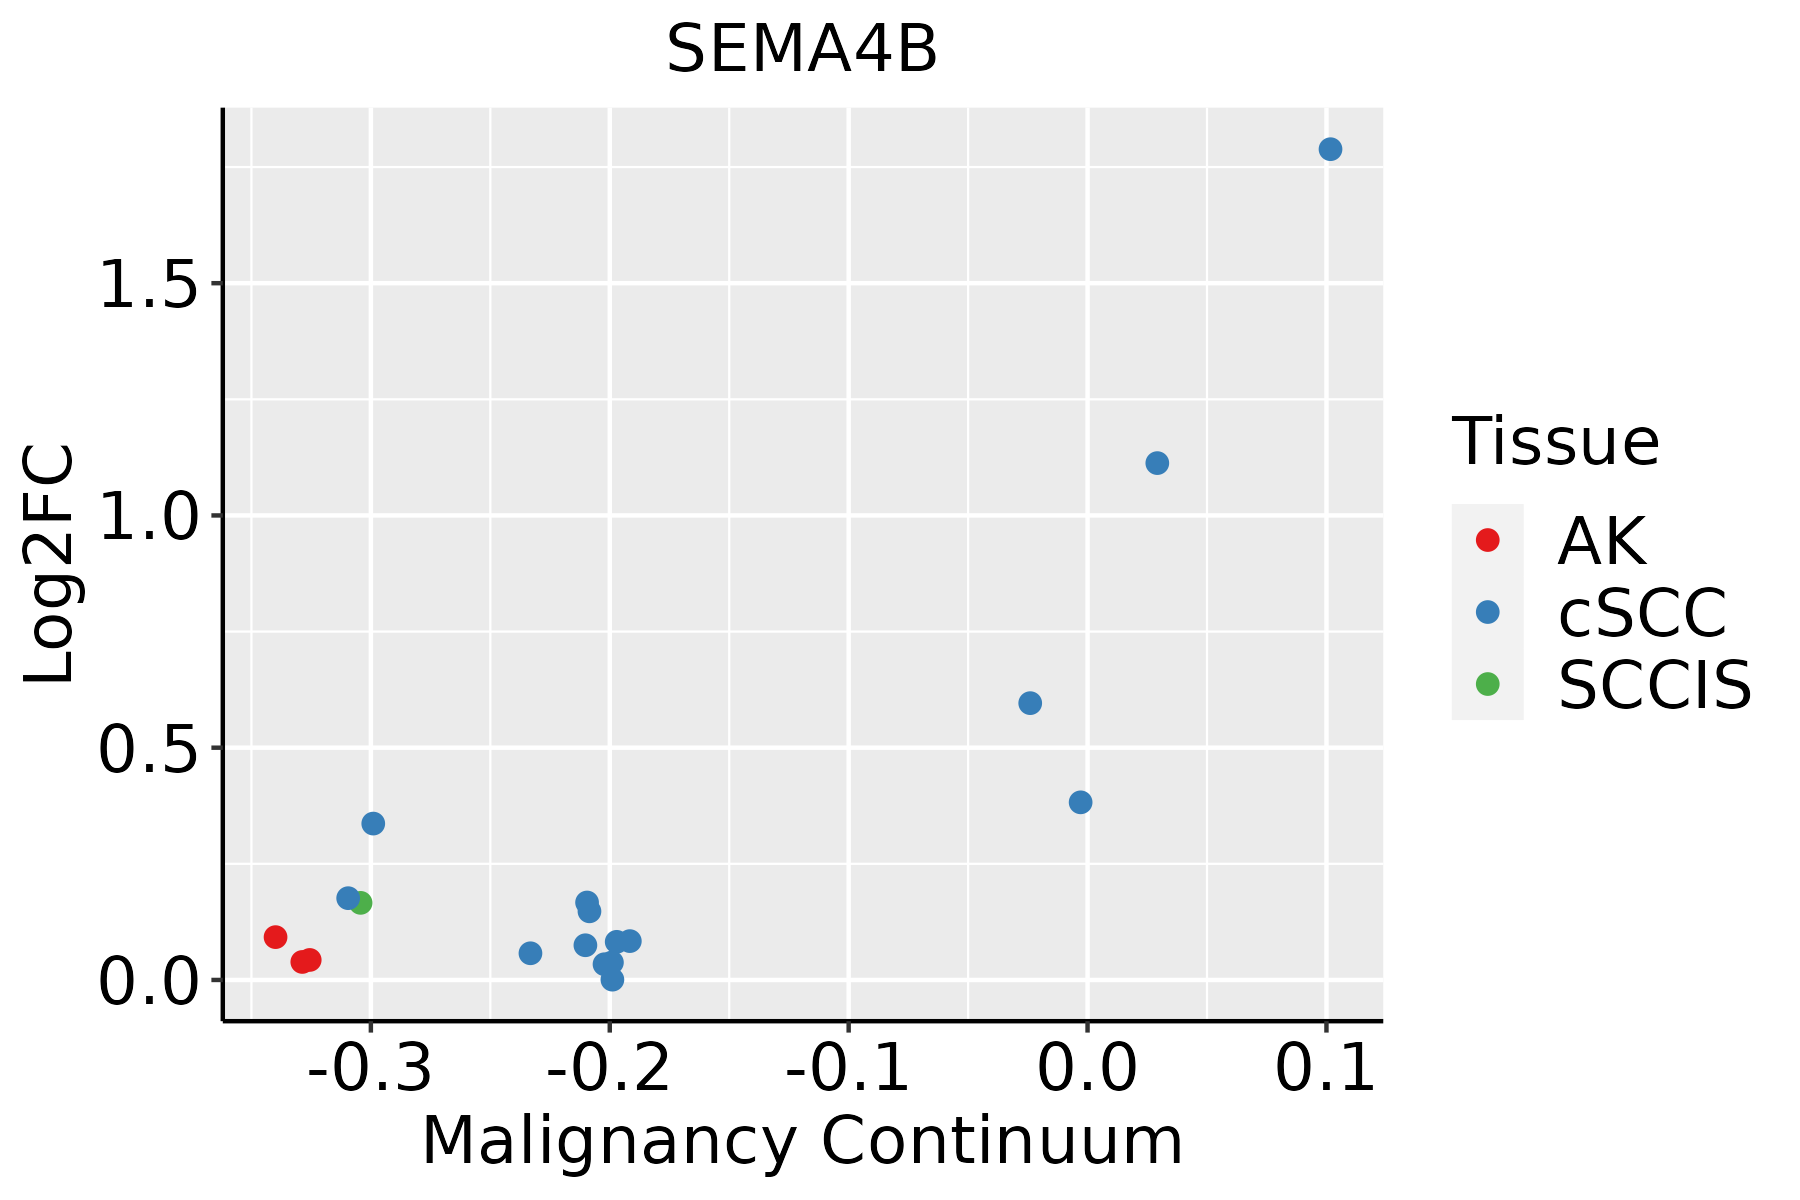 | AK: Actinic keratosis |
| cSCC: Cutaneous squamous cell carcinoma | ||
| SCCIS:squamous cell carcinoma in situ | ||
| Thyroid | 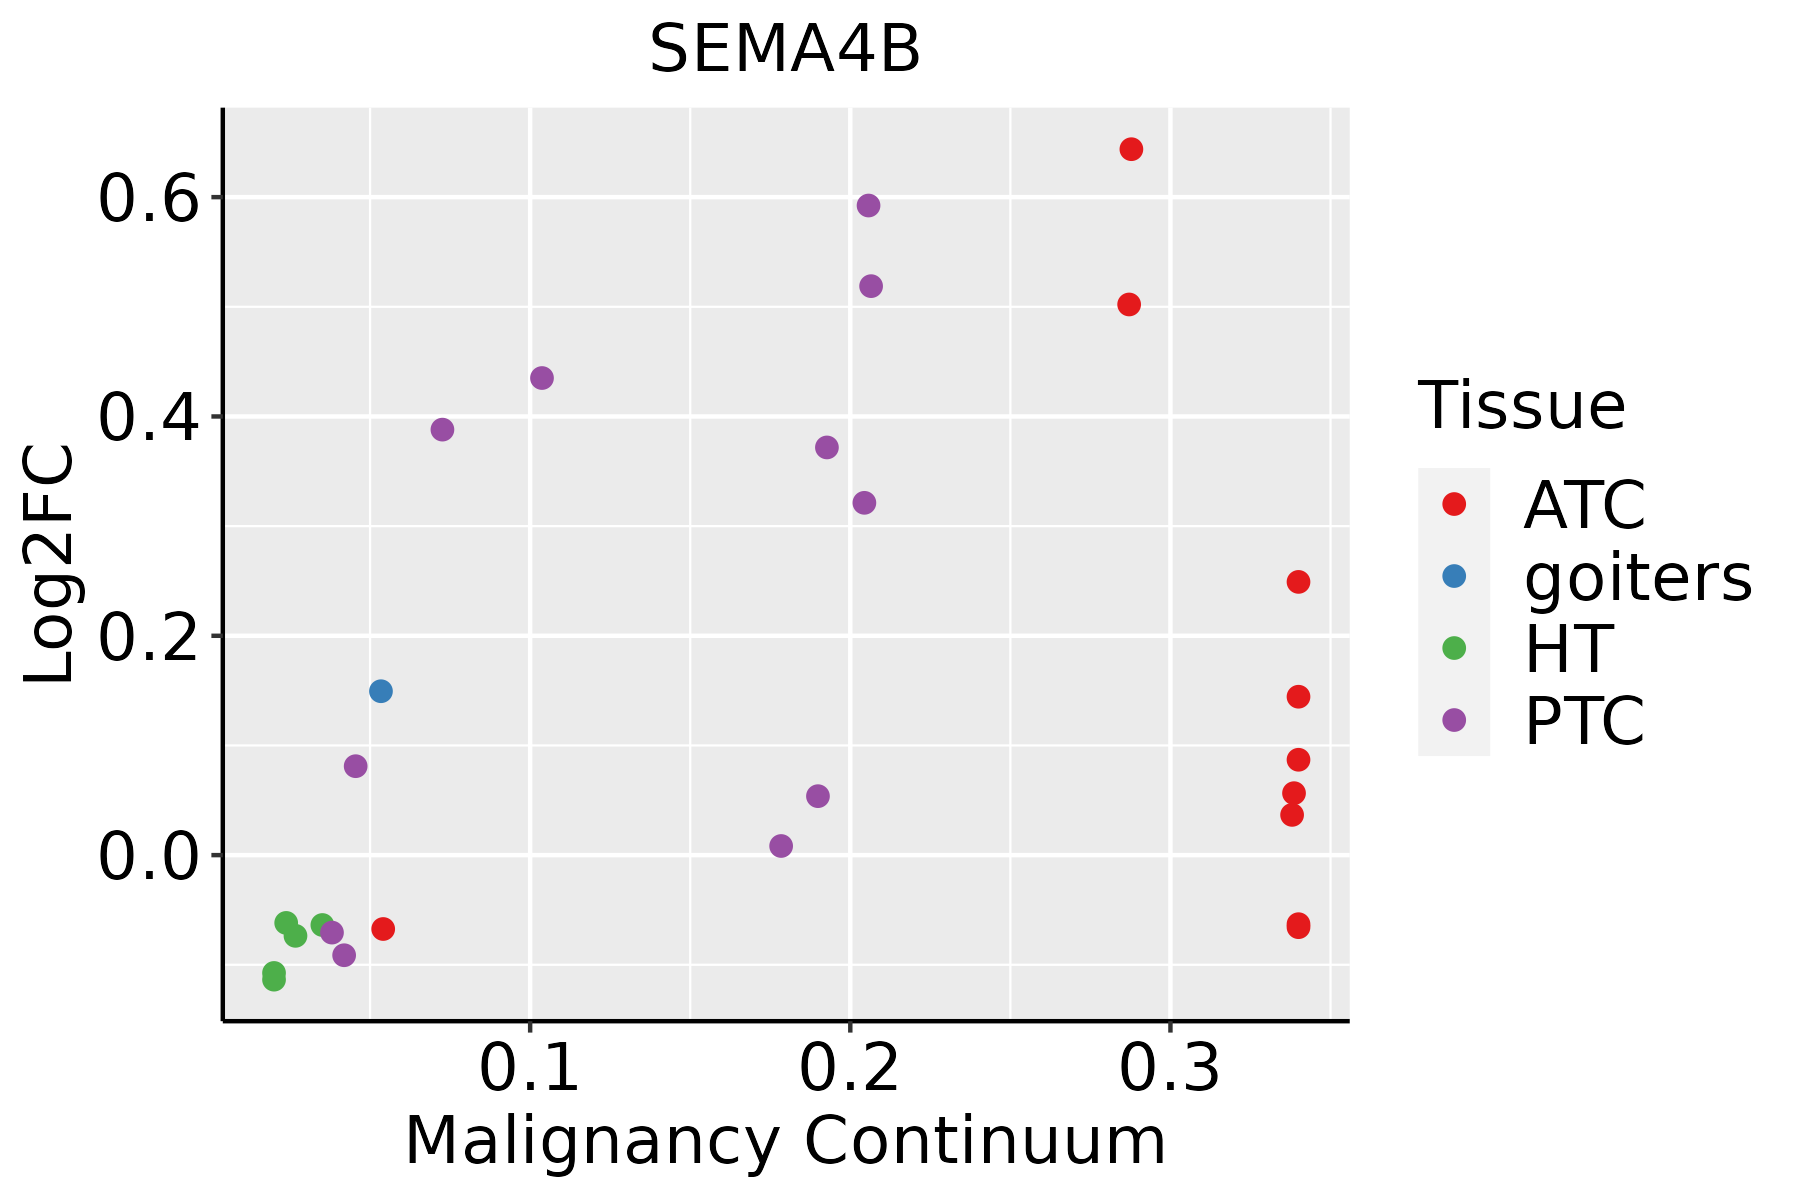 | ATC: Anaplastic thyroid cancer |
| HT: Hashimoto's thyroiditis | ||
| PTC: Papillary thyroid cancer |
| ∗log2FC in expression of this searched gene in stem-like cells from each diseased tissue sample relative to stem-like cells in normal samples in each tissue plotted against the malignancy continuum. Samples are colored based on if they are from different disease stage. |
Top |
Malignant transformation related pathway analysis |
| Find out the enriched GO biological processes and KEGG pathways involved in transition from healthy to precancer to cancer |
| Tissue | Disease Stage | Enriched GO biological Processes |
| Colorectum | AD |  |
| Colorectum | SER |  |
| Colorectum | MSS |  |
| Colorectum | MSI-H |  |
| Colorectum | FAP |  |
| ∗Top 15 enriched GO BP terms are showed in the bar plot of each disease state in each tissue. Each row represents a significant GO biological process which is colored according to the -log10(p.adjust). |
| Page: 1 2 3 4 5 6 7 8 9 |
| GO ID | Tissue | Disease Stage | Description | Gene Ratio | Bg Ratio | pvalue | p.adjust | Count |
| GO:00016679 | Cervix | CC | ameboidal-type cell migration | 110/2311 | 475/18723 | 2.66e-11 | 6.36e-09 | 110 |
| GO:00109757 | Cervix | CC | regulation of neuron projection development | 88/2311 | 445/18723 | 4.26e-06 | 1.09e-04 | 88 |
| GO:00509203 | Cervix | CC | regulation of chemotaxis | 51/2311 | 223/18723 | 8.03e-06 | 1.86e-04 | 51 |
| GO:00160498 | Cervix | CC | cell growth | 92/2311 | 482/18723 | 1.16e-05 | 2.49e-04 | 92 |
| GO:00325359 | Cervix | CC | regulation of cellular component size | 76/2311 | 383/18723 | 1.66e-05 | 3.21e-04 | 76 |
| GO:00615647 | Cervix | CC | axon development | 89/2311 | 467/18723 | 1.71e-05 | 3.27e-04 | 89 |
| GO:00400133 | Cervix | CC | negative regulation of locomotion | 76/2311 | 391/18723 | 3.47e-05 | 5.60e-04 | 76 |
| GO:00488634 | Cervix | CC | stem cell differentiation | 46/2311 | 206/18723 | 4.11e-05 | 6.36e-04 | 46 |
| GO:00074097 | Cervix | CC | axonogenesis | 78/2311 | 418/18723 | 1.14e-04 | 1.43e-03 | 78 |
| GO:00015588 | Cervix | CC | regulation of cell growth | 77/2311 | 414/18723 | 1.40e-04 | 1.70e-03 | 77 |
| GO:00507705 | Cervix | CC | regulation of axonogenesis | 34/2311 | 154/18723 | 4.87e-04 | 4.76e-03 | 34 |
| GO:00313456 | Cervix | CC | negative regulation of cell projection organization | 39/2311 | 186/18723 | 5.86e-04 | 5.57e-03 | 39 |
| GO:00321022 | Cervix | CC | negative regulation of response to external stimulus | 75/2311 | 420/18723 | 5.96e-04 | 5.61e-03 | 75 |
| GO:00486386 | Cervix | CC | regulation of developmental growth | 61/2311 | 330/18723 | 7.69e-04 | 6.85e-03 | 61 |
| GO:00605606 | Cervix | CC | developmental growth involved in morphogenesis | 46/2311 | 234/18723 | 8.82e-04 | 7.63e-03 | 46 |
| GO:00519603 | Cervix | CC | regulation of nervous system development | 77/2311 | 443/18723 | 1.13e-03 | 9.30e-03 | 77 |
| GO:00507676 | Cervix | CC | regulation of neurogenesis | 65/2311 | 364/18723 | 1.33e-03 | 1.05e-02 | 65 |
| GO:00486756 | Cervix | CC | axon extension | 26/2311 | 120/18723 | 2.80e-03 | 1.87e-02 | 26 |
| GO:19901385 | Cervix | CC | neuron projection extension | 34/2311 | 172/18723 | 3.52e-03 | 2.27e-02 | 34 |
| GO:00109775 | Cervix | CC | negative regulation of neuron projection development | 28/2311 | 137/18723 | 4.74e-03 | 2.83e-02 | 28 |
| Page: 1 2 3 4 5 6 7 8 9 10 11 12 13 14 15 |
| Pathway ID | Tissue | Disease Stage | Description | Gene Ratio | Bg Ratio | pvalue | p.adjust | qvalue | Count |
| hsa043609 | Cervix | CC | Axon guidance | 47/1267 | 182/8465 | 8.13e-05 | 5.38e-04 | 3.18e-04 | 47 |
| hsa0436012 | Cervix | CC | Axon guidance | 47/1267 | 182/8465 | 8.13e-05 | 5.38e-04 | 3.18e-04 | 47 |
| hsa04360 | Colorectum | AD | Axon guidance | 61/2092 | 182/8465 | 4.36e-03 | 2.17e-02 | 1.38e-02 | 61 |
| hsa043601 | Colorectum | AD | Axon guidance | 61/2092 | 182/8465 | 4.36e-03 | 2.17e-02 | 1.38e-02 | 61 |
| hsa043604 | Colorectum | FAP | Axon guidance | 47/1404 | 182/8465 | 9.09e-04 | 5.20e-03 | 3.16e-03 | 47 |
| hsa043605 | Colorectum | FAP | Axon guidance | 47/1404 | 182/8465 | 9.09e-04 | 5.20e-03 | 3.16e-03 | 47 |
| hsa043606 | Colorectum | CRC | Axon guidance | 43/1091 | 182/8465 | 4.38e-05 | 8.70e-04 | 5.90e-04 | 43 |
| hsa043607 | Colorectum | CRC | Axon guidance | 43/1091 | 182/8465 | 4.38e-05 | 8.70e-04 | 5.90e-04 | 43 |
| hsa0436016 | Esophagus | ESCC | Axon guidance | 108/4205 | 182/8465 | 5.13e-03 | 1.30e-02 | 6.67e-03 | 108 |
| hsa0436017 | Esophagus | ESCC | Axon guidance | 108/4205 | 182/8465 | 5.13e-03 | 1.30e-02 | 6.67e-03 | 108 |
| hsa043608 | Lung | IAC | Axon guidance | 34/1053 | 182/8465 | 9.31e-03 | 3.62e-02 | 2.41e-02 | 34 |
| hsa0436011 | Lung | IAC | Axon guidance | 34/1053 | 182/8465 | 9.31e-03 | 3.62e-02 | 2.41e-02 | 34 |
| hsa0436021 | Lung | AIS | Axon guidance | 34/961 | 182/8465 | 2.22e-03 | 1.37e-02 | 8.80e-03 | 34 |
| hsa0436031 | Lung | AIS | Axon guidance | 34/961 | 182/8465 | 2.22e-03 | 1.37e-02 | 8.80e-03 | 34 |
| hsa0436014 | Oral cavity | OSCC | Axon guidance | 97/3704 | 182/8465 | 5.59e-03 | 1.33e-02 | 6.76e-03 | 97 |
| hsa0436015 | Oral cavity | OSCC | Axon guidance | 97/3704 | 182/8465 | 5.59e-03 | 1.33e-02 | 6.76e-03 | 97 |
| Page: 1 |
Top |
Cell-cell communication analysis |
| Identification of potential cell-cell interactions between two cell types and their ligand-receptor pairs for different disease states |
| Ligand | Receptor | LRpair | Pathway | Tissue | Disease Stage |
| Page: 1 |
Top |
Single-cell gene regulatory network inference analysis |
| Find out the significant the regulons (TFs) and the target genes of each regulon across cell types for different disease states |
| TF | Cell Type | Tissue | Disease Stage | Target Gene | RSS | Regulon Activity |
| ∗The dot plots of a searched regulon are shown for all cell subpopulations in each disease state of each tissue based on the regulon specific score inferred using pySCENIC and by calculating the average expression. |
| Page: 1 |
Top |
Somatic mutation of malignant transformation related genes |
| Annotation of somatic variants for genes involved in malignant transformation |
| Hugo Symbol | Variant Class | Variant Classification | dbSNP RS | HGVSc | HGVSp | HGVSp Short | SWISSPROT | BIOTYPE | SIFT | PolyPhen | Tumor Sample Barcode | Tissue | Histology | Sex | Age | Stage | Therapy Types | Drugs | Outcome |
| SEMA4B | SNV | Missense_Mutation | novel | c.635N>A | p.Gly212Glu | p.G212E | protein_coding | deleterious(0) | probably_damaging(1) | TCGA-A7-A6VY-01 | Breast | breast invasive carcinoma | Female | <65 | I/II | Chemotherapy | cyclophosphamide | CR | |
| SEMA4B | SNV | Missense_Mutation | novel | c.1873N>C | p.Asn625His | p.N625H | protein_coding | tolerated(0.13) | possibly_damaging(0.866) | TCGA-AR-A5QM-01 | Breast | breast invasive carcinoma | Female | <65 | I/II | Hormone Therapy | anastrozole | PD | |
| SEMA4B | SNV | Missense_Mutation | c.1550N>A | p.Gly517Asp | p.G517D | protein_coding | deleterious(0) | probably_damaging(0.924) | TCGA-C8-A12K-01 | Breast | breast invasive carcinoma | Female | >=65 | I/II | Unknown | Unknown | SD | ||
| SEMA4B | SNV | Missense_Mutation | novel | c.683N>G | p.Thr228Ser | p.T228S | protein_coding | deleterious(0) | probably_damaging(0.999) | TCGA-E2-A15S-01 | Breast | breast invasive carcinoma | Female | <65 | I/II | Chemotherapy | doxorubicin | SD | |
| SEMA4B | insertion | Frame_Shift_Ins | novel | c.1743_1744insGGCCAAACATTCATATA | p.Ser582GlyfsTer31 | p.S582Gfs*31 | protein_coding | TCGA-A2-A0T2-01 | Breast | breast invasive carcinoma | Female | >=65 | III/IV | Chemotherapy | xeloda | PD | |||
| SEMA4B | deletion | Frame_Shift_Del | novel | c.1498delN | p.Asn500IlefsTer19 | p.N500Ifs*19 | protein_coding | TCGA-D8-A27V-01 | Breast | breast invasive carcinoma | Female | <65 | I/II | Hormone Therapy | tamoxiphen | SD | |||
| SEMA4B | SNV | Missense_Mutation | novel | c.1586N>G | p.Tyr529Cys | p.Y529C | protein_coding | deleterious(0) | probably_damaging(1) | TCGA-2W-A8YY-01 | Cervix | cervical & endocervical cancer | Female | <65 | I/II | Chemotherapy | cisplatin | CR | |
| SEMA4B | SNV | Missense_Mutation | rs764249282 | c.1067N>G | p.Ser356Cys | p.S356C | protein_coding | deleterious(0) | probably_damaging(1) | TCGA-C5-A1BE-01 | Cervix | cervical & endocervical cancer | Female | <65 | I/II | Chemotherapy | cisplatin | PD | |
| SEMA4B | SNV | Missense_Mutation | c.64C>T | p.Arg22Trp | p.R22W | protein_coding | deleterious_low_confidence(0.05) | benign(0.057) | TCGA-C5-A1BQ-01 | Cervix | cervical & endocervical cancer | Female | >=65 | III/IV | Chemotherapy | cisplatin | CR | ||
| SEMA4B | SNV | Missense_Mutation | novel | c.1473N>G | p.Ile491Met | p.I491M | protein_coding | deleterious(0.01) | possibly_damaging(0.681) | TCGA-C5-A2LV-01 | Cervix | cervical & endocervical cancer | Female | <65 | I/II | Unknown | Unknown | SD |
| Page: 1 2 3 4 5 6 |
Top |
Related drugs of malignant transformation related genes |
| Identification of chemicals and drugs interact with genes involved in malignant transfromation |
| (DGIdb 4.0) |
| Entrez ID | Symbol | Category | Interaction Types | Drug Claim Name | Drug Name | PMIDs |
| Page: 1 |

Copyright 2023-Present -The University of Texas Health Science Center at Houston |