
|
|||||
|
 | |
| |
| |
| |
| |
| |
|
Gene: SEMA3E |
Gene summary for SEMA3E |
| Gene information | Species | Human | Gene symbol | SEMA3E | Gene ID | 9723 |
| Gene name | semaphorin 3E | |
| Gene Alias | M-SEMAH | |
| Cytomap | 7q21.11 | |
| Gene Type | protein-coding | GO ID | GO:0000902 | UniProtAcc | O15041 |
Top |
Malignant transformation analysis |
| Identification of the aberrant gene expression in precancerous and cancerous lesions by comparing the gene expression of stem-like cells in diseased tissues with normal stem cells |
| Entrez ID | Symbol | Replicates | Species | Organ | Tissue | Adj P-value | Log2FC | Malignancy |
| 9723 | SEMA3E | HTA11_3410_2000001011 | Human | Colorectum | AD | 3.36e-15 | 3.40e-01 | 0.0155 |
| 9723 | SEMA3E | HTA11_2487_2000001011 | Human | Colorectum | SER | 4.63e-06 | 2.39e-01 | -0.1808 |
| 9723 | SEMA3E | HTA11_1938_2000001011 | Human | Colorectum | AD | 8.75e-11 | 4.41e-01 | -0.0811 |
| 9723 | SEMA3E | HTA11_78_2000001011 | Human | Colorectum | AD | 2.36e-05 | 3.48e-01 | -0.1088 |
| 9723 | SEMA3E | HTA11_347_2000001011 | Human | Colorectum | AD | 3.85e-09 | 2.42e-01 | -0.1954 |
| 9723 | SEMA3E | HTA11_3361_2000001011 | Human | Colorectum | AD | 6.60e-03 | 2.35e-01 | -0.1207 |
| 9723 | SEMA3E | HTA11_696_2000001011 | Human | Colorectum | AD | 1.15e-09 | 2.51e-01 | -0.1464 |
| 9723 | SEMA3E | HTA11_866_2000001011 | Human | Colorectum | AD | 1.17e-05 | 1.86e-01 | -0.1001 |
| 9723 | SEMA3E | HTA11_1391_2000001011 | Human | Colorectum | AD | 1.76e-07 | 2.45e-01 | -0.059 |
| 9723 | SEMA3E | HTA11_2992_2000001011 | Human | Colorectum | SER | 7.29e-03 | 3.68e-01 | -0.1706 |
| 9723 | SEMA3E | HTA11_546_2000001011 | Human | Colorectum | AD | 1.96e-03 | 3.08e-01 | -0.0842 |
| 9723 | SEMA3E | HTA11_7862_2000001011 | Human | Colorectum | AD | 5.83e-10 | 4.72e-01 | -0.0179 |
| 9723 | SEMA3E | HTA11_866_3004761011 | Human | Colorectum | AD | 6.95e-06 | 2.83e-01 | 0.096 |
| 9723 | SEMA3E | HTA11_7696_3000711011 | Human | Colorectum | AD | 2.30e-05 | 1.95e-01 | 0.0674 |
| 9723 | SEMA3E | HTA11_6818_2000001021 | Human | Colorectum | AD | 9.60e-03 | 2.43e-01 | 0.0588 |
| 9723 | SEMA3E | HTA11_99999970781_79442 | Human | Colorectum | MSS | 3.48e-21 | 5.46e-01 | 0.294 |
| 9723 | SEMA3E | HTA11_99999965062_69753 | Human | Colorectum | MSI-H | 1.29e-02 | 4.75e-01 | 0.3487 |
| 9723 | SEMA3E | HTA11_99999965104_69814 | Human | Colorectum | MSS | 5.31e-04 | 2.57e-01 | 0.281 |
| 9723 | SEMA3E | HTA11_99999971662_82457 | Human | Colorectum | MSS | 6.18e-14 | 4.71e-01 | 0.3859 |
| 9723 | SEMA3E | HTA11_99999974143_84620 | Human | Colorectum | MSS | 1.49e-65 | 1.22e+00 | 0.3005 |
| Page: 1 2 3 |
| Tissue | Expression Dynamics | Abbreviation |
| Colorectum (GSE201348) |  | FAP: Familial adenomatous polyposis |
| CRC: Colorectal cancer | ||
| Colorectum (HTA11) |  | AD: Adenomas |
| SER: Sessile serrated lesions | ||
| MSI-H: Microsatellite-high colorectal cancer | ||
| MSS: Microsatellite stable colorectal cancer | ||
| Endometrium | 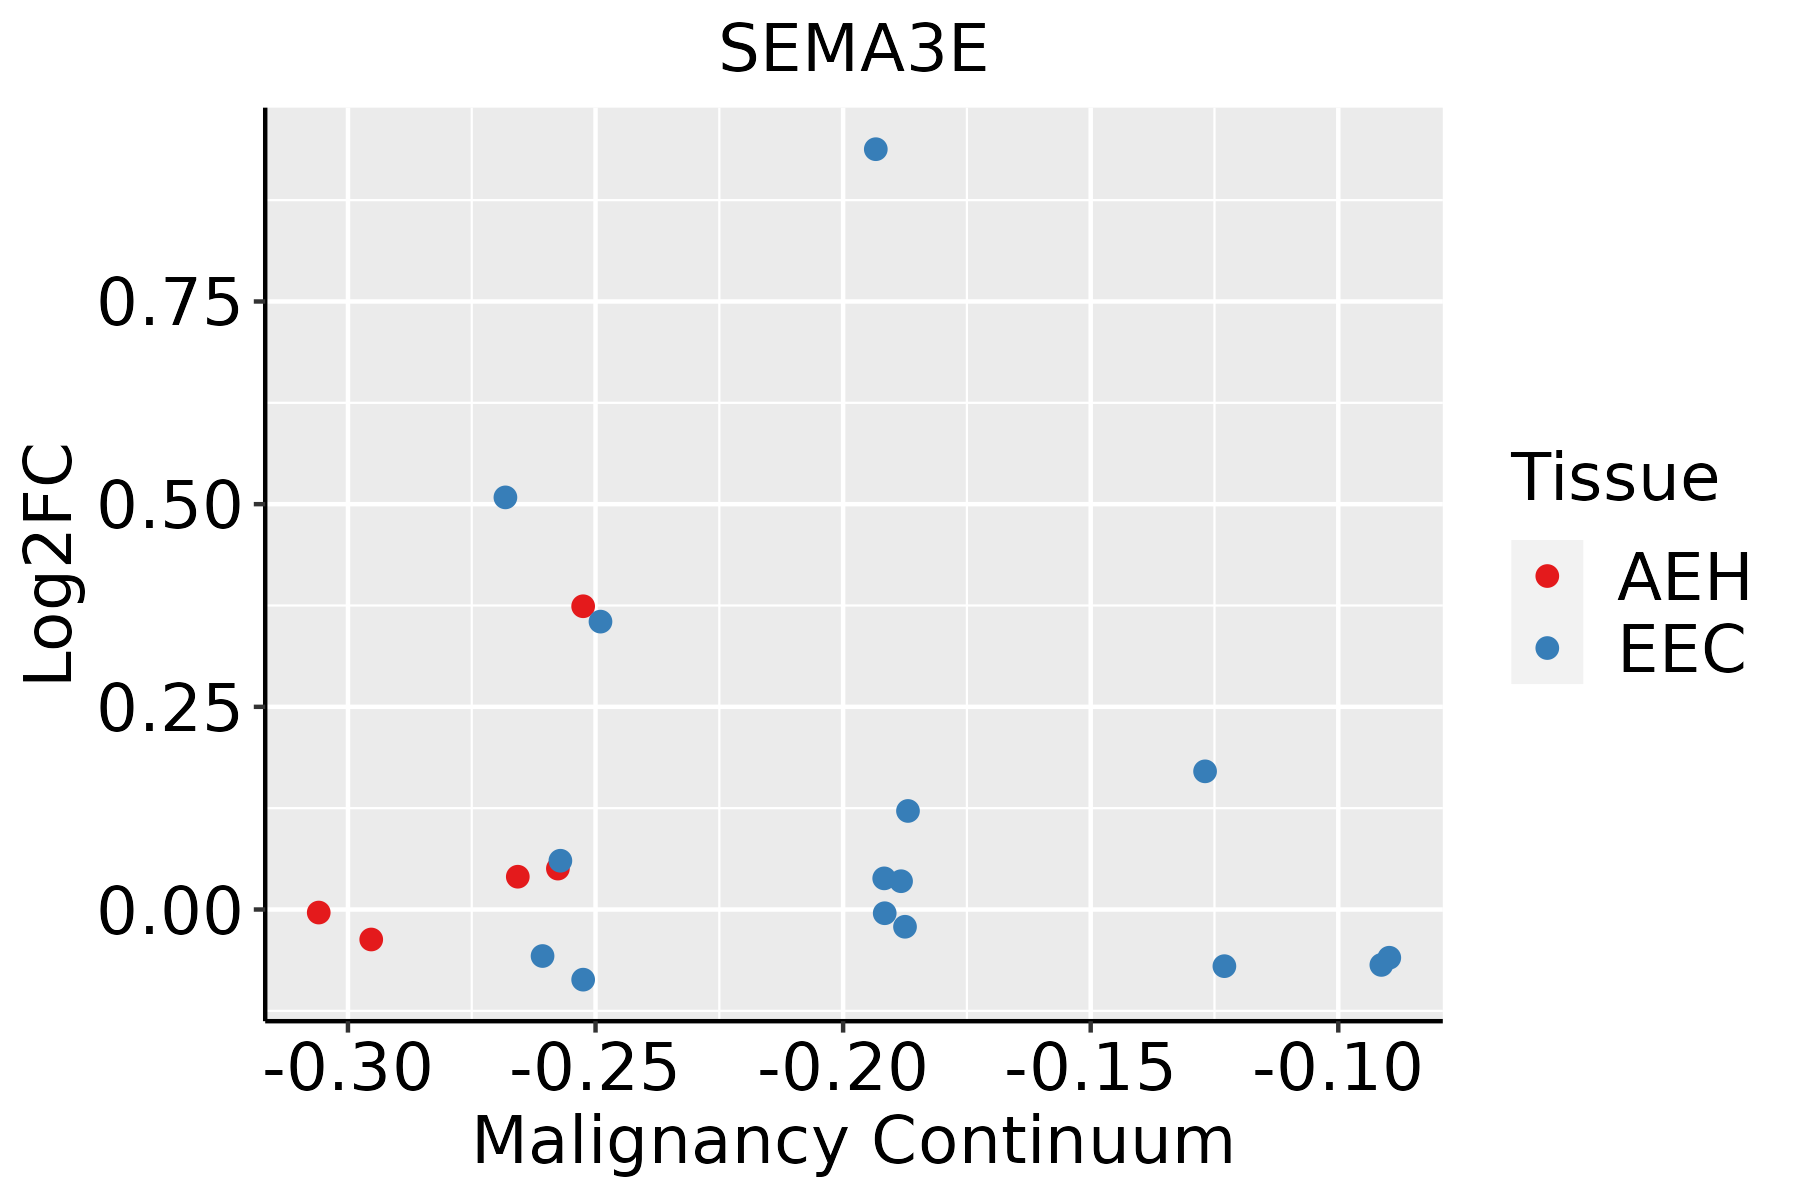 | AEH: Atypical endometrial hyperplasia |
| EEC: Endometrioid Cancer | ||
| Liver | 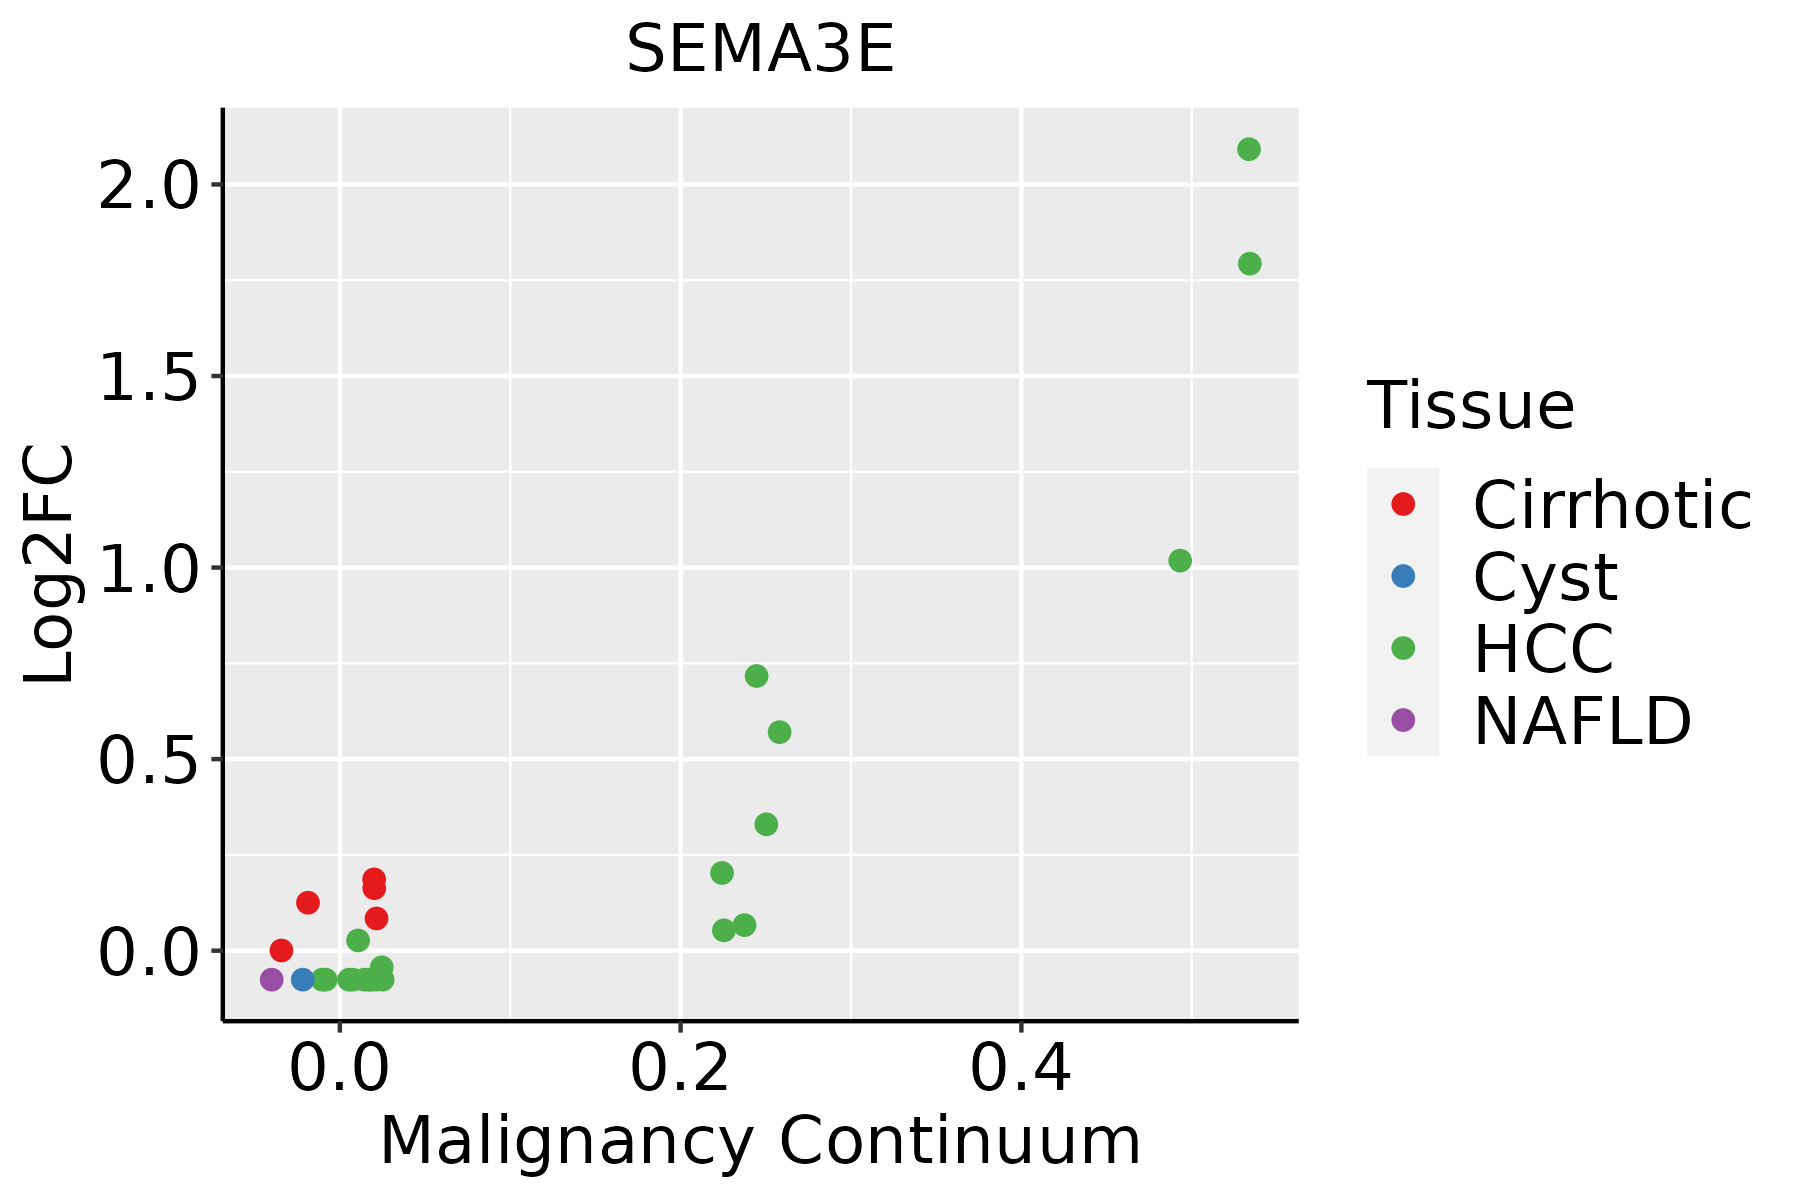 | HCC: Hepatocellular carcinoma |
| NAFLD: Non-alcoholic fatty liver disease |
| ∗log2FC in expression of this searched gene in stem-like cells from each diseased tissue sample relative to stem-like cells in normal samples in each tissue plotted against the malignancy continuum. Samples are colored based on if they are from different disease stage. |
Top |
Malignant transformation related pathway analysis |
| Find out the enriched GO biological processes and KEGG pathways involved in transition from healthy to precancer to cancer |
| Tissue | Disease Stage | Enriched GO biological Processes |
| Colorectum | AD |  |
| Colorectum | SER |  |
| Colorectum | MSS |  |
| Colorectum | MSI-H |  |
| Colorectum | FAP |  |
| ∗Top 15 enriched GO BP terms are showed in the bar plot of each disease state in each tissue. Each row represents a significant GO biological process which is colored according to the -log10(p.adjust). |
| Page: 1 2 3 4 5 6 7 8 9 |
| GO ID | Tissue | Disease Stage | Description | Gene Ratio | Bg Ratio | pvalue | p.adjust | Count |
| GO:0032535 | Colorectum | AD | regulation of cellular component size | 142/3918 | 383/18723 | 1.74e-13 | 3.41e-11 | 142 |
| GO:0032970 | Colorectum | AD | regulation of actin filament-based process | 142/3918 | 397/18723 | 4.05e-12 | 5.90e-10 | 142 |
| GO:0032956 | Colorectum | AD | regulation of actin cytoskeleton organization | 127/3918 | 358/18723 | 1.03e-10 | 1.04e-08 | 127 |
| GO:0022604 | Colorectum | AD | regulation of cell morphogenesis | 109/3918 | 309/18723 | 3.08e-09 | 2.07e-07 | 109 |
| GO:0010810 | Colorectum | AD | regulation of cell-substrate adhesion | 81/3918 | 221/18723 | 4.80e-08 | 2.55e-06 | 81 |
| GO:0031589 | Colorectum | AD | cell-substrate adhesion | 116/3918 | 363/18723 | 4.68e-07 | 1.76e-05 | 116 |
| GO:0001952 | Colorectum | AD | regulation of cell-matrix adhesion | 50/3918 | 128/18723 | 2.05e-06 | 6.05e-05 | 50 |
| GO:0016049 | Colorectum | AD | cell growth | 143/3918 | 482/18723 | 2.83e-06 | 8.09e-05 | 143 |
| GO:0008360 | Colorectum | AD | regulation of cell shape | 56/3918 | 154/18723 | 7.01e-06 | 1.73e-04 | 56 |
| GO:0001558 | Colorectum | AD | regulation of cell growth | 124/3918 | 414/18723 | 7.67e-06 | 1.86e-04 | 124 |
| GO:0001667 | Colorectum | AD | ameboidal-type cell migration | 137/3918 | 475/18723 | 2.17e-05 | 4.33e-04 | 137 |
| GO:0031532 | Colorectum | AD | actin cytoskeleton reorganization | 41/3918 | 107/18723 | 2.81e-05 | 5.28e-04 | 41 |
| GO:0010975 | Colorectum | AD | regulation of neuron projection development | 129/3918 | 445/18723 | 2.88e-05 | 5.37e-04 | 129 |
| GO:0007409 | Colorectum | AD | axonogenesis | 122/3918 | 418/18723 | 3.36e-05 | 6.15e-04 | 122 |
| GO:0007160 | Colorectum | AD | cell-matrix adhesion | 75/3918 | 233/18723 | 3.56e-05 | 6.45e-04 | 75 |
| GO:0061564 | Colorectum | AD | axon development | 132/3918 | 467/18723 | 8.40e-05 | 1.31e-03 | 132 |
| GO:0060562 | Colorectum | AD | epithelial tube morphogenesis | 93/3918 | 325/18723 | 5.65e-04 | 6.00e-03 | 93 |
| GO:0031345 | Colorectum | AD | negative regulation of cell projection organization | 58/3918 | 186/18723 | 6.37e-04 | 6.58e-03 | 58 |
| GO:0008361 | Colorectum | AD | regulation of cell size | 56/3918 | 181/18723 | 9.61e-04 | 9.07e-03 | 56 |
| GO:0050770 | Colorectum | AD | regulation of axonogenesis | 49/3918 | 154/18723 | 9.88e-04 | 9.28e-03 | 49 |
| Page: 1 2 3 4 5 6 7 8 9 10 11 |
| Pathway ID | Tissue | Disease Stage | Description | Gene Ratio | Bg Ratio | pvalue | p.adjust | qvalue | Count |
| hsa04360 | Colorectum | AD | Axon guidance | 61/2092 | 182/8465 | 4.36e-03 | 2.17e-02 | 1.38e-02 | 61 |
| hsa043601 | Colorectum | AD | Axon guidance | 61/2092 | 182/8465 | 4.36e-03 | 2.17e-02 | 1.38e-02 | 61 |
| hsa043602 | Colorectum | MSS | Axon guidance | 54/1875 | 182/8465 | 1.03e-02 | 3.69e-02 | 2.26e-02 | 54 |
| hsa043603 | Colorectum | MSS | Axon guidance | 54/1875 | 182/8465 | 1.03e-02 | 3.69e-02 | 2.26e-02 | 54 |
| hsa0436010 | Endometrium | AEH | Axon guidance | 39/1197 | 182/8465 | 4.47e-03 | 2.46e-02 | 1.80e-02 | 39 |
| hsa0436013 | Endometrium | AEH | Axon guidance | 39/1197 | 182/8465 | 4.47e-03 | 2.46e-02 | 1.80e-02 | 39 |
| hsa0436022 | Endometrium | EEC | Axon guidance | 39/1237 | 182/8465 | 7.78e-03 | 3.66e-02 | 2.73e-02 | 39 |
| hsa0436032 | Endometrium | EEC | Axon guidance | 39/1237 | 182/8465 | 7.78e-03 | 3.66e-02 | 2.73e-02 | 39 |
| Page: 1 |
Top |
Cell-cell communication analysis |
| Identification of potential cell-cell interactions between two cell types and their ligand-receptor pairs for different disease states |
| Ligand | Receptor | LRpair | Pathway | Tissue | Disease Stage |
| SEMA3E | PLXND1 | SEMA3E_PLXND1 | SEMA3 | CRC | MSI-H |
| SEMA3E | PLXND1 | SEMA3E_PLXND1 | SEMA3 | CRC | MSS |
| SEMA3E | PLXND1 | SEMA3E_PLXND1 | SEMA3 | Esophagus | ESCC |
| SEMA3E | PLXND1 | SEMA3E_PLXND1 | SEMA3 | Liver | Healthy |
| SEMA3E | PLXND1 | SEMA3E_PLXND1 | SEMA3 | Liver | Precancer |
| SEMA3E | PLXND1 | SEMA3E_PLXND1 | SEMA3 | Prostate | BPH |
| Page: 1 |
Top |
Single-cell gene regulatory network inference analysis |
| Find out the significant the regulons (TFs) and the target genes of each regulon across cell types for different disease states |
| TF | Cell Type | Tissue | Disease Stage | Target Gene | RSS | Regulon Activity |
| ∗The dot plots of a searched regulon are shown for all cell subpopulations in each disease state of each tissue based on the regulon specific score inferred using pySCENIC and by calculating the average expression. |
| Page: 1 |
Top |
Somatic mutation of malignant transformation related genes |
| Annotation of somatic variants for genes involved in malignant transformation |
| Hugo Symbol | Variant Class | Variant Classification | dbSNP RS | HGVSc | HGVSp | HGVSp Short | SWISSPROT | BIOTYPE | SIFT | PolyPhen | Tumor Sample Barcode | Tissue | Histology | Sex | Age | Stage | Therapy Types | Drugs | Outcome |
| SEMA3E | SNV | Missense_Mutation | novel | c.109N>T | p.His37Tyr | p.H37Y | O15041 | protein_coding | tolerated(1) | benign(0) | TCGA-5L-AAT1-01 | Breast | breast invasive carcinoma | Female | <65 | III/IV | Hormone Therapy | letrozol | SD |
| SEMA3E | SNV | Missense_Mutation | rs121918341 | c.2108N>T | p.Ser703Leu | p.S703L | O15041 | protein_coding | tolerated(0.26) | benign(0.001) | TCGA-BH-A0RX-01 | Breast | breast invasive carcinoma | Female | <65 | I/II | Chemotherapy | fluorouracil | SD |
| SEMA3E | SNV | Missense_Mutation | novel | c.637N>T | p.Arg213Cys | p.R213C | O15041 | protein_coding | deleterious(0) | probably_damaging(1) | TCGA-E9-A1RF-01 | Breast | breast invasive carcinoma | Female | >=65 | III/IV | Hormone Therapy | tamoxiphen | SD |
| SEMA3E | insertion | Frame_Shift_Ins | novel | c.338_339insAATGCAGGAGGAGGGAAGATTTCAAACT | p.Glu114MetfsTer10 | p.E114Mfs*10 | O15041 | protein_coding | TCGA-A8-A097-01 | Breast | breast invasive carcinoma | Female | >=65 | I/II | Hormone Therapy | tamoxiphen | SD | ||
| SEMA3E | insertion | Frame_Shift_Ins | novel | c.337-1_337insCA | p.Gly113GlnfsTer20 | p.G113Qfs*20 | O15041 | protein_coding | TCGA-A8-A09C-01 | Breast | breast invasive carcinoma | Female | >=65 | I/II | Unknown | Unknown | SD | ||
| SEMA3E | insertion | Nonsense_Mutation | novel | c.748_749insTTTAA | p.Glu250ValfsTer2 | p.E250Vfs*2 | O15041 | protein_coding | TCGA-AR-A0TY-01 | Breast | breast invasive carcinoma | Female | <65 | I/II | Unspecific | Paclitaxel | PD | ||
| SEMA3E | insertion | Frame_Shift_Ins | novel | c.747_748insCAGTA | p.Glu250GlnfsTer2 | p.E250Qfs*2 | O15041 | protein_coding | TCGA-AR-A0TY-01 | Breast | breast invasive carcinoma | Female | <65 | I/II | Unspecific | Paclitaxel | PD | ||
| SEMA3E | deletion | Frame_Shift_Del | novel | c.2307delN | p.Arg770GlyfsTer16 | p.R770Gfs*16 | O15041 | protein_coding | TCGA-EW-A2FV-01 | Breast | breast invasive carcinoma | Female | <65 | III/IV | Chemotherapy | docetaxel | SD | ||
| SEMA3E | SNV | Missense_Mutation | c.1637G>A | p.Arg546Gln | p.R546Q | O15041 | protein_coding | deleterious(0.02) | probably_damaging(0.971) | TCGA-2W-A8YY-01 | Cervix | cervical & endocervical cancer | Female | <65 | I/II | Chemotherapy | cisplatin | CR | |
| SEMA3E | SNV | Missense_Mutation | novel | c.1684G>A | p.Asp562Asn | p.D562N | O15041 | protein_coding | deleterious(0.01) | probably_damaging(1) | TCGA-4J-AA1J-01 | Cervix | cervical & endocervical cancer | Female | <65 | I/II | Unknown | Unknown | SD |
| Page: 1 2 3 4 5 6 7 8 9 10 11 12 13 |
Top |
Related drugs of malignant transformation related genes |
| Identification of chemicals and drugs interact with genes involved in malignant transfromation |
| (DGIdb 4.0) |
| Entrez ID | Symbol | Category | Interaction Types | Drug Claim Name | Drug Name | PMIDs |
| Page: 1 |

Copyright 2023-Present -The University of Texas Health Science Center at Houston |