
|
|||||
|
 | |
| |
| |
| |
| |
| |
|
Gene: SEMA3C |
Gene summary for SEMA3C |
| Gene information | Species | Human | Gene symbol | SEMA3C | Gene ID | 10512 |
| Gene name | semaphorin 3C | |
| Gene Alias | SEMAE | |
| Cytomap | 7q21.11 | |
| Gene Type | protein-coding | GO ID | GO:0000902 | UniProtAcc | Q99985 |
Top |
Malignant transformation analysis |
| Identification of the aberrant gene expression in precancerous and cancerous lesions by comparing the gene expression of stem-like cells in diseased tissues with normal stem cells |
| Entrez ID | Symbol | Replicates | Species | Organ | Tissue | Adj P-value | Log2FC | Malignancy |
| 10512 | SEMA3C | CCI_1 | Human | Cervix | CC | 1.26e-04 | 1.29e+00 | 0.528 |
| 10512 | SEMA3C | CCI_3 | Human | Cervix | CC | 1.73e-23 | 1.17e+00 | 0.516 |
| 10512 | SEMA3C | HTA11_3410_2000001011 | Human | Colorectum | AD | 2.08e-10 | -4.35e-01 | 0.0155 |
| 10512 | SEMA3C | HTA11_2487_2000001011 | Human | Colorectum | SER | 2.70e-05 | -4.77e-01 | -0.1808 |
| 10512 | SEMA3C | HTA11_2951_2000001011 | Human | Colorectum | AD | 6.06e-03 | -6.39e-01 | 0.0216 |
| 10512 | SEMA3C | HTA11_3361_2000001011 | Human | Colorectum | AD | 3.93e-07 | -6.25e-01 | -0.1207 |
| 10512 | SEMA3C | HTA11_83_2000001011 | Human | Colorectum | SER | 7.50e-04 | -5.56e-01 | -0.1526 |
| 10512 | SEMA3C | HTA11_5212_2000001011 | Human | Colorectum | AD | 2.33e-02 | -5.92e-01 | -0.2061 |
| 10512 | SEMA3C | HTA11_8622_2000001021 | Human | Colorectum | SER | 2.06e-06 | -7.70e-01 | 0.0528 |
| 10512 | SEMA3C | HTA11_10711_2000001011 | Human | Colorectum | AD | 7.74e-06 | -4.91e-01 | 0.0338 |
| 10512 | SEMA3C | HTA11_7696_3000711011 | Human | Colorectum | AD | 2.13e-02 | -3.60e-01 | 0.0674 |
| 10512 | SEMA3C | HTA11_99999965104_69814 | Human | Colorectum | MSS | 8.89e-04 | 6.44e-01 | 0.281 |
| 10512 | SEMA3C | HTA11_99999974143_84620 | Human | Colorectum | MSS | 8.97e-19 | -6.71e-01 | 0.3005 |
| 10512 | SEMA3C | A002-C-010 | Human | Colorectum | FAP | 5.15e-05 | 2.32e-01 | 0.242 |
| 10512 | SEMA3C | A015-C-203 | Human | Colorectum | FAP | 1.35e-27 | -4.18e-01 | -0.1294 |
| 10512 | SEMA3C | A015-C-204 | Human | Colorectum | FAP | 6.00e-08 | -4.01e-01 | -0.0228 |
| 10512 | SEMA3C | A014-C-040 | Human | Colorectum | FAP | 1.45e-02 | -2.75e-01 | -0.1184 |
| 10512 | SEMA3C | A002-C-201 | Human | Colorectum | FAP | 1.30e-11 | -2.60e-01 | 0.0324 |
| 10512 | SEMA3C | A002-C-203 | Human | Colorectum | FAP | 4.93e-02 | 2.19e-01 | 0.2786 |
| 10512 | SEMA3C | A001-C-119 | Human | Colorectum | FAP | 8.34e-08 | -3.31e-01 | -0.1557 |
| Page: 1 2 3 4 5 6 7 8 |
| Tissue | Expression Dynamics | Abbreviation |
| Cervix | 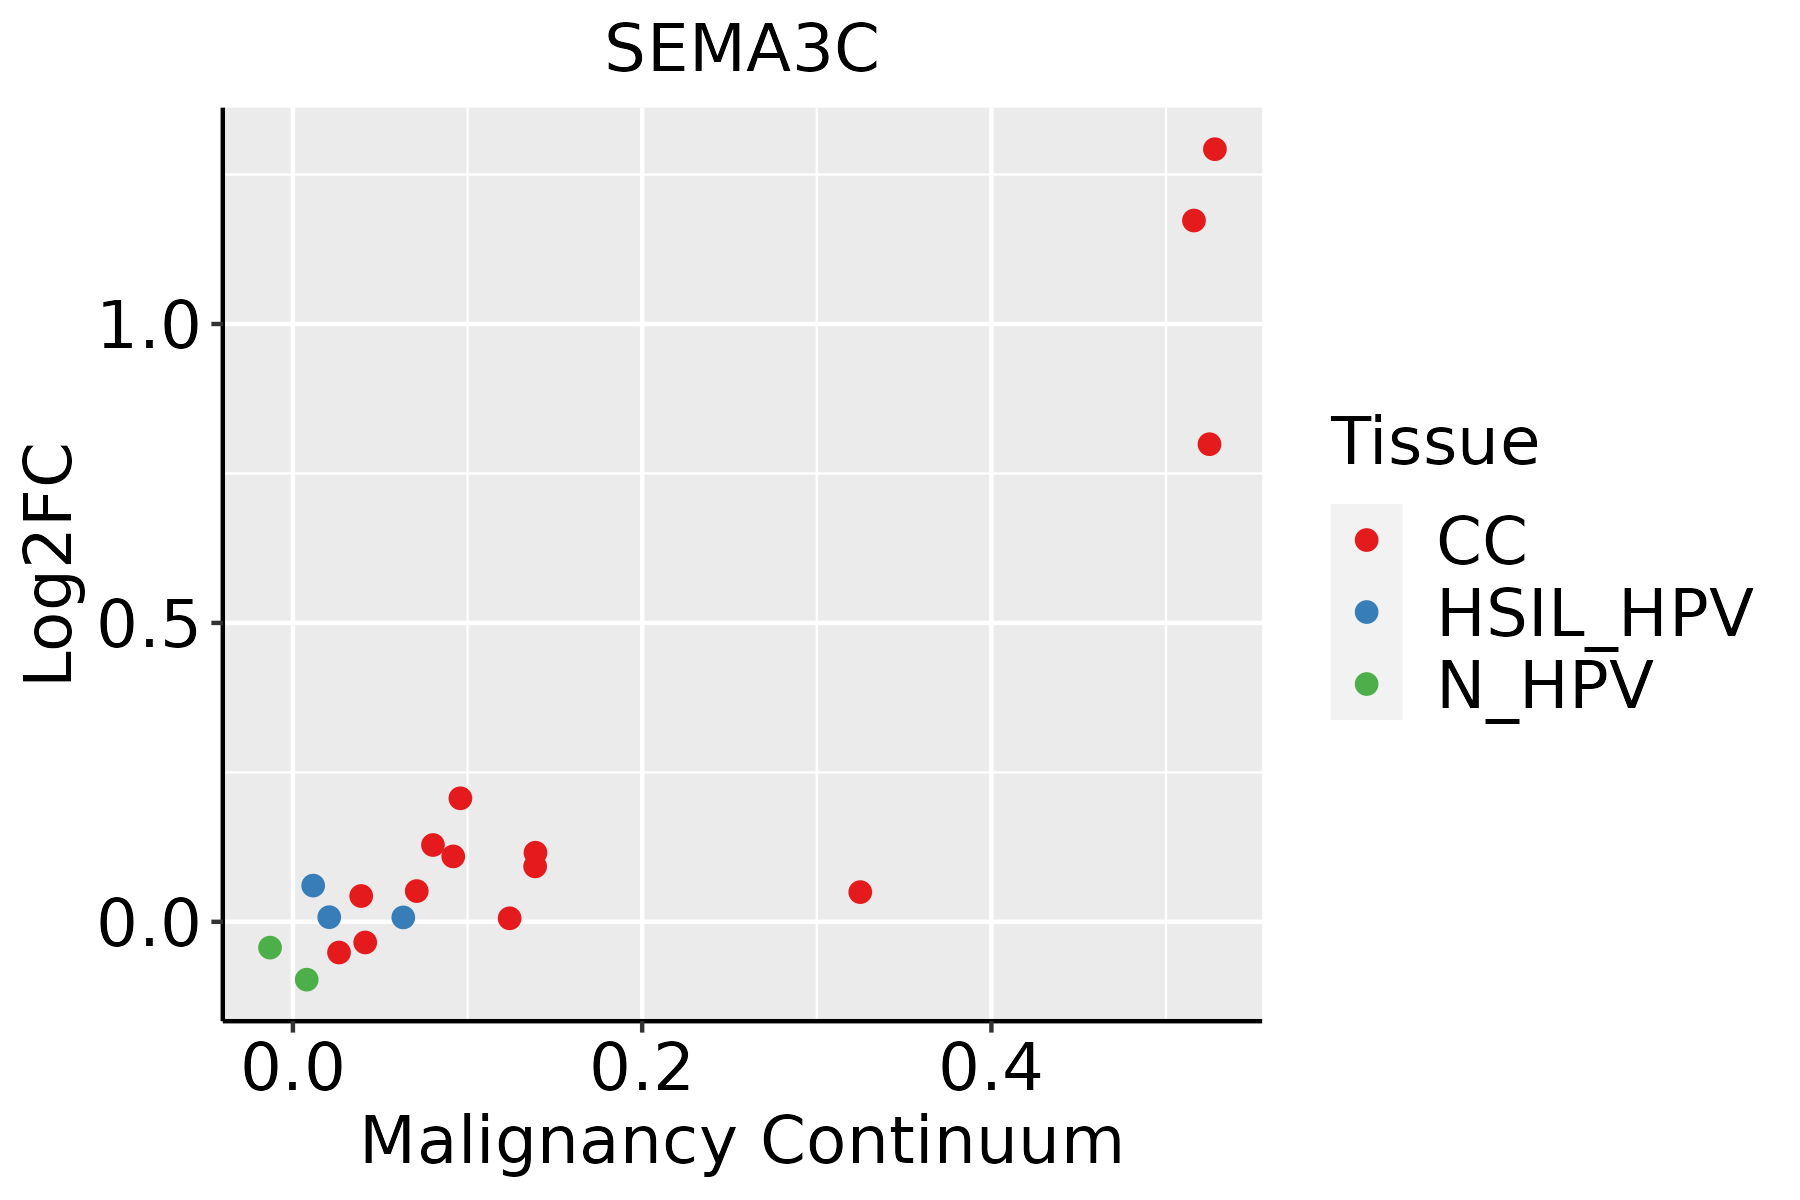 | CC: Cervix cancer |
| HSIL_HPV: HPV-infected high-grade squamous intraepithelial lesions | ||
| N_HPV: HPV-infected normal cervix | ||
| Colorectum (GSE201348) |  | FAP: Familial adenomatous polyposis |
| CRC: Colorectal cancer | ||
| Colorectum (HTA11) |  | AD: Adenomas |
| SER: Sessile serrated lesions | ||
| MSI-H: Microsatellite-high colorectal cancer | ||
| MSS: Microsatellite stable colorectal cancer | ||
| Endometrium |  | AEH: Atypical endometrial hyperplasia |
| EEC: Endometrioid Cancer | ||
| Esophagus | 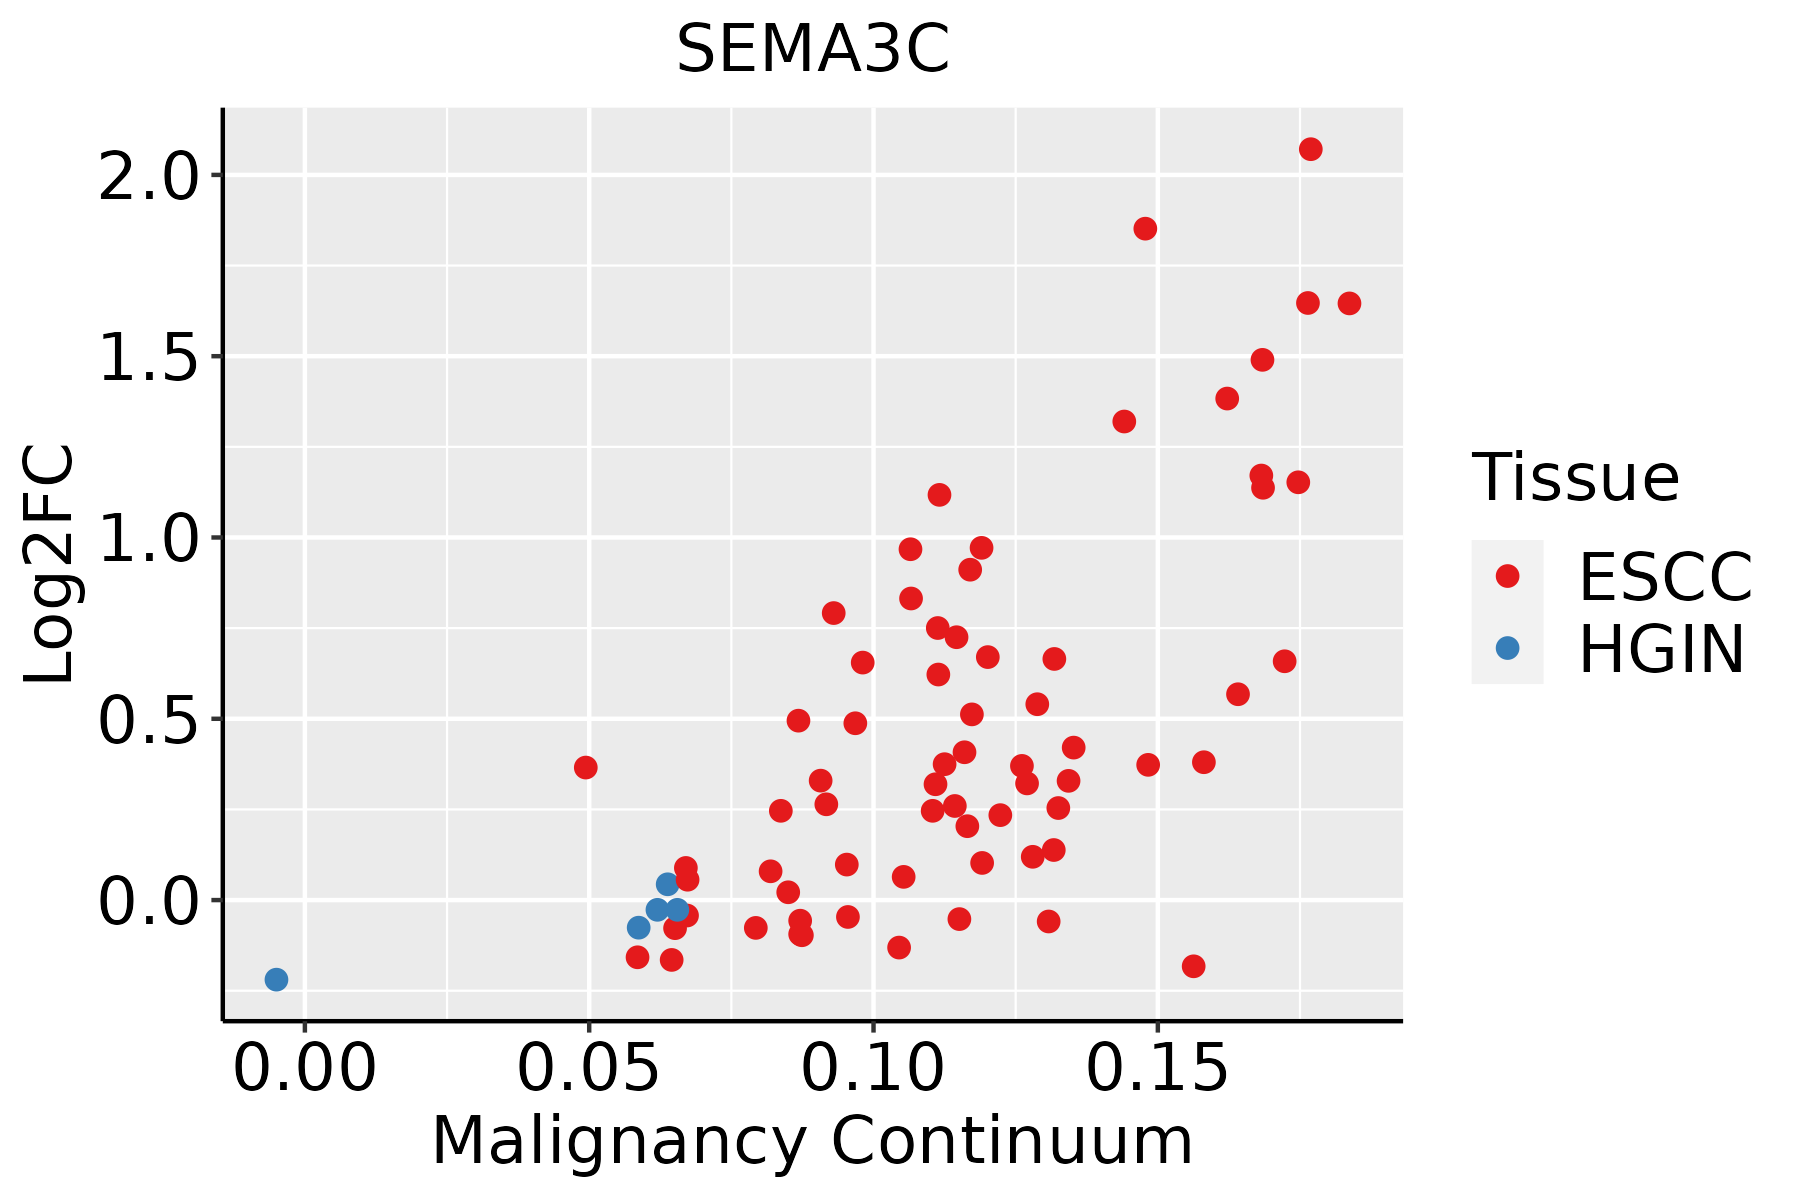 | ESCC: Esophageal squamous cell carcinoma |
| HGIN: High-grade intraepithelial neoplasias | ||
| LGIN: Low-grade intraepithelial neoplasias | ||
| Oral Cavity |  | EOLP: Erosive Oral lichen planus |
| LP: leukoplakia | ||
| NEOLP: Non-erosive oral lichen planus | ||
| OSCC: Oral squamous cell carcinoma | ||
| Prostate | 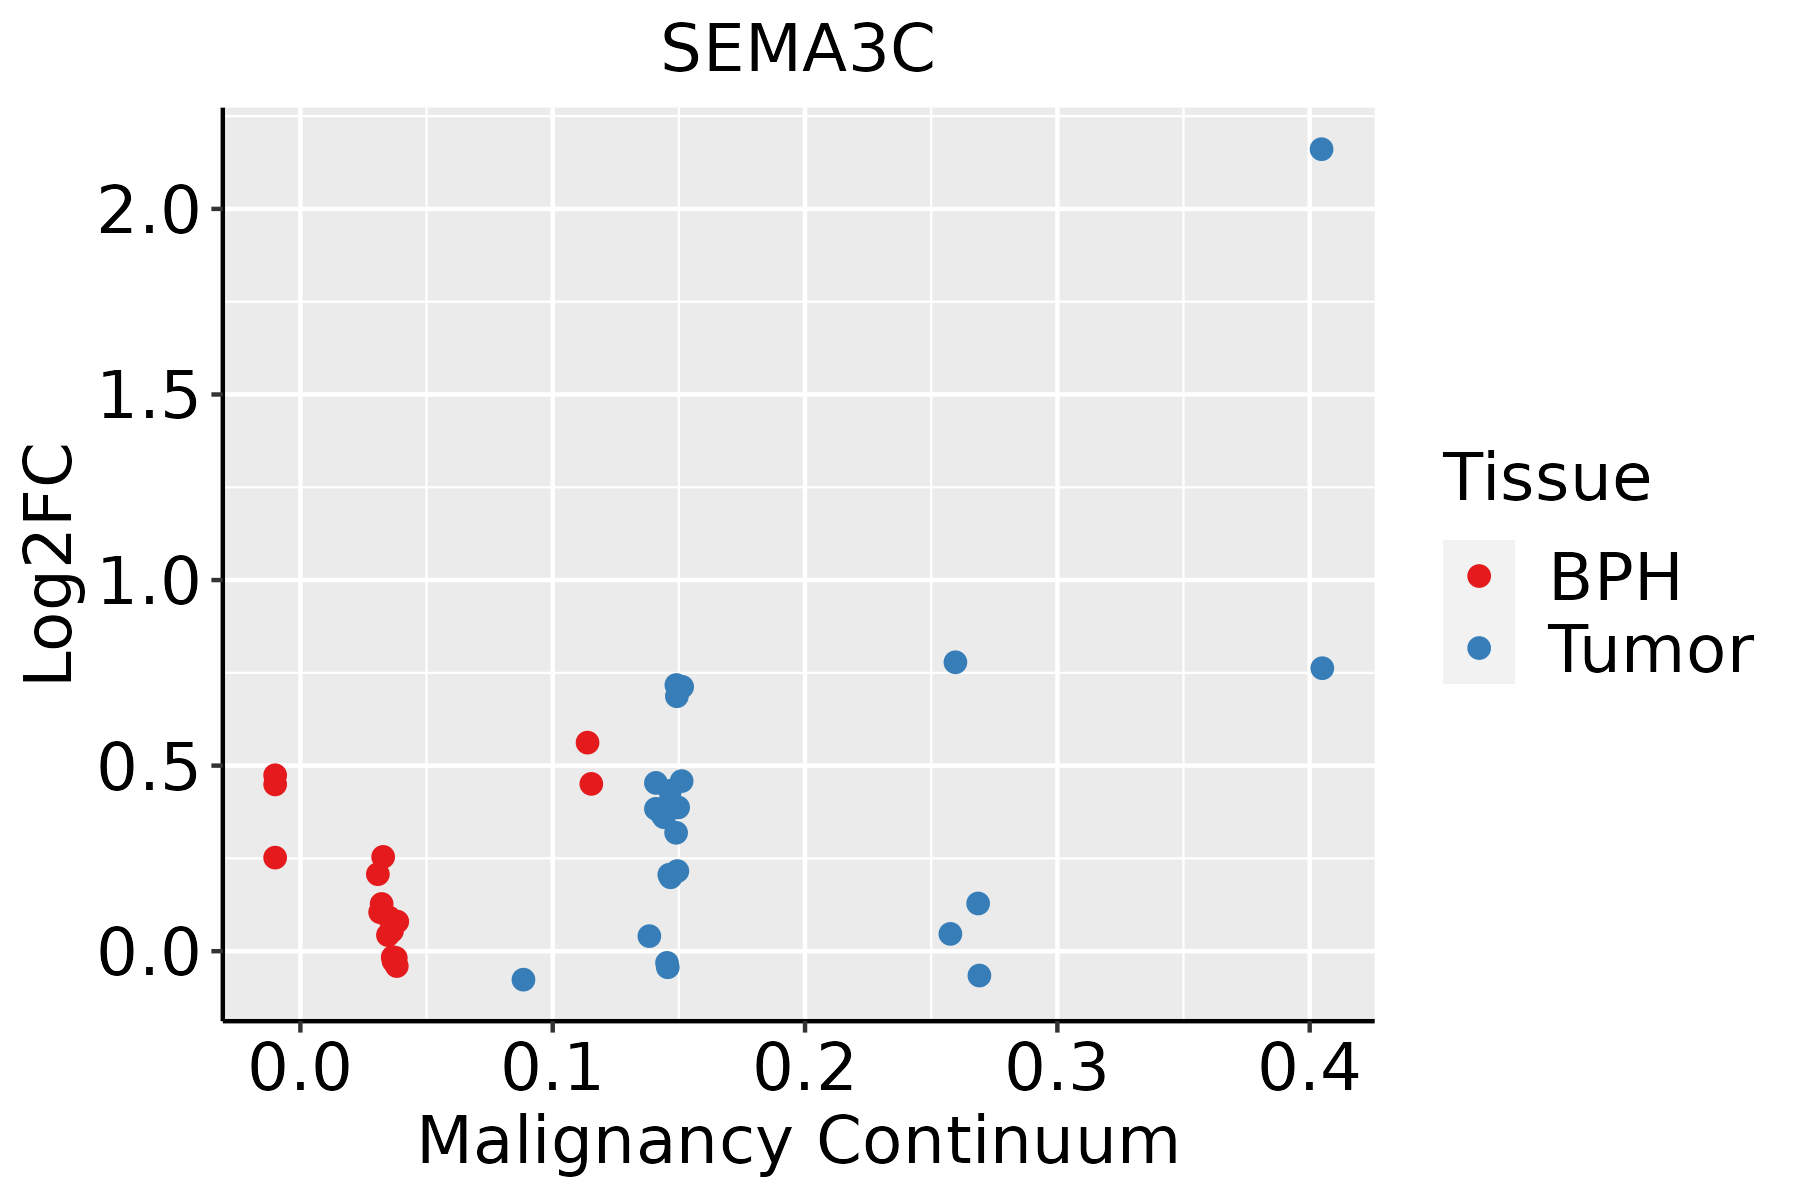 | BPH: Benign Prostatic Hyperplasia |
| Skin | 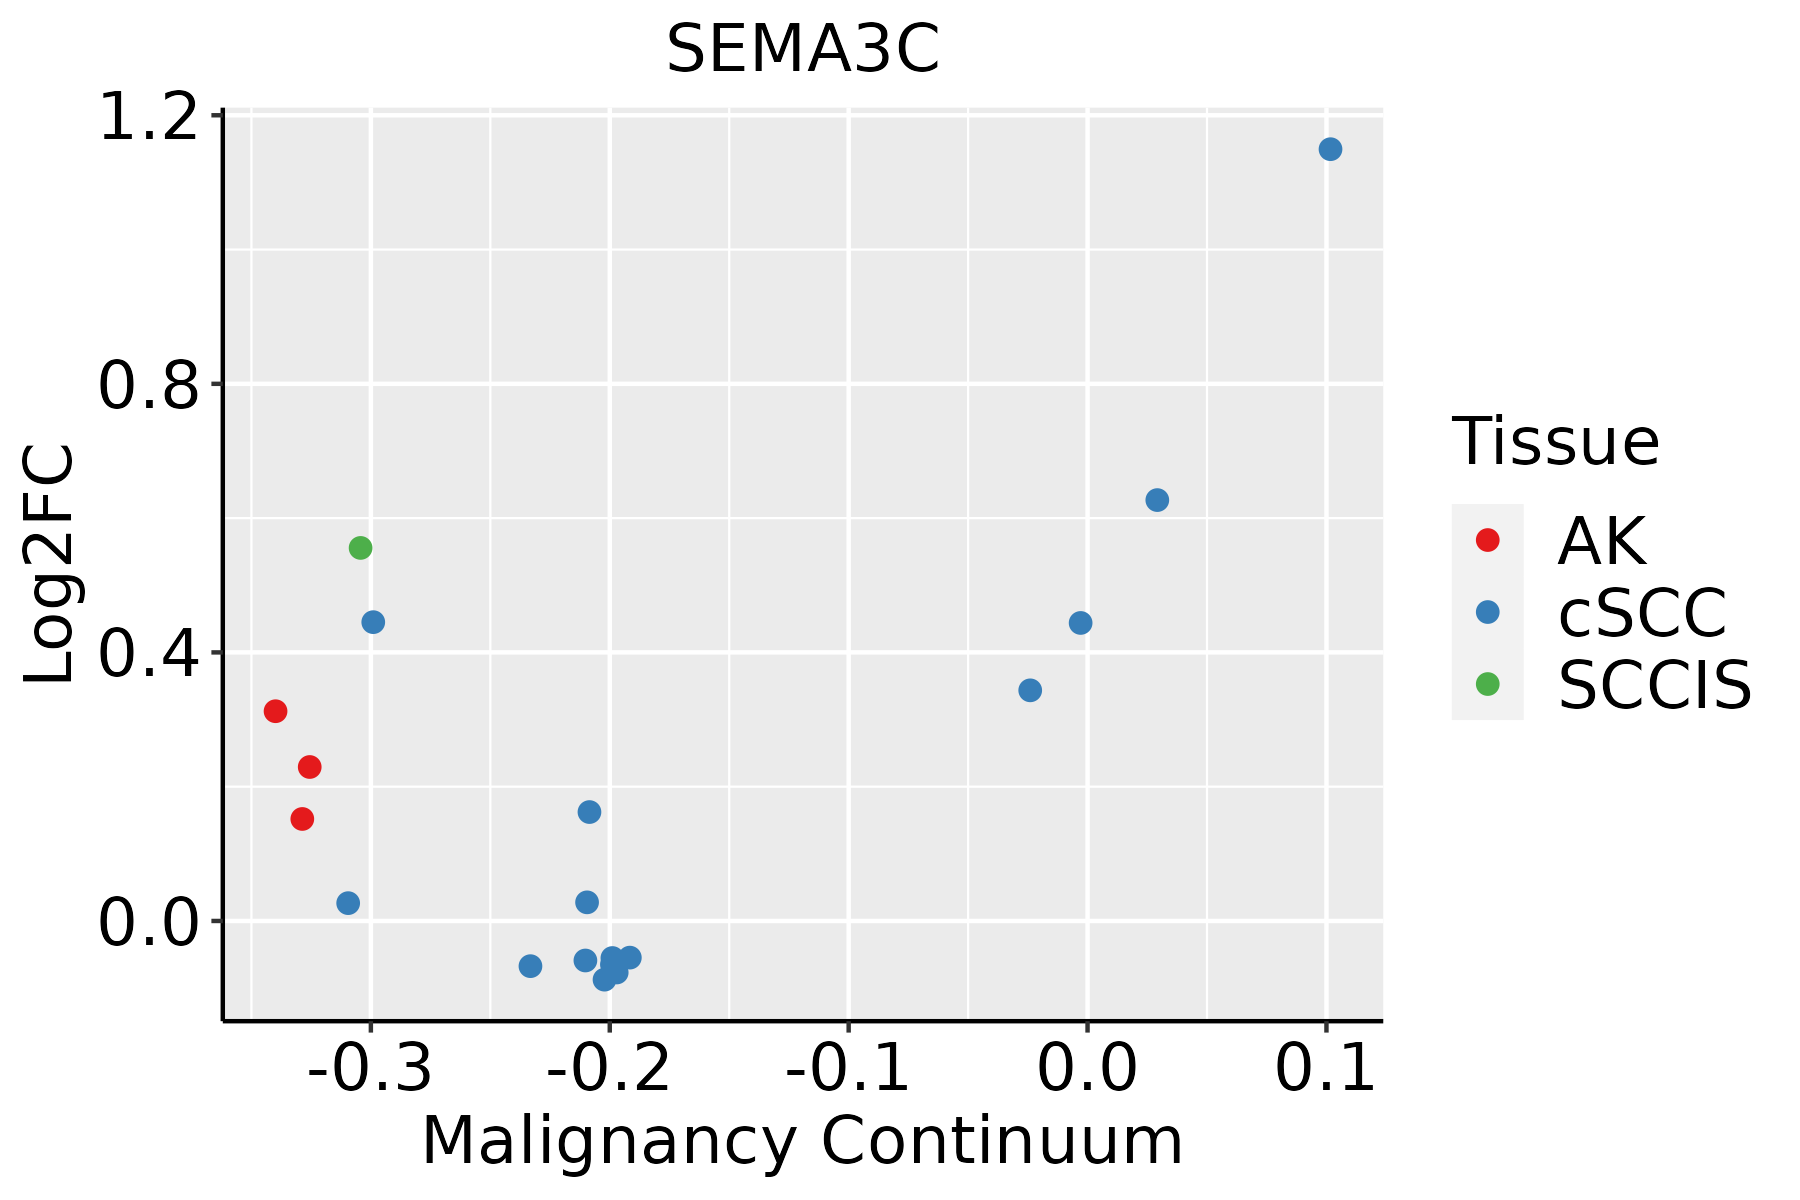 | AK: Actinic keratosis |
| cSCC: Cutaneous squamous cell carcinoma | ||
| SCCIS:squamous cell carcinoma in situ | ||
| Thyroid | 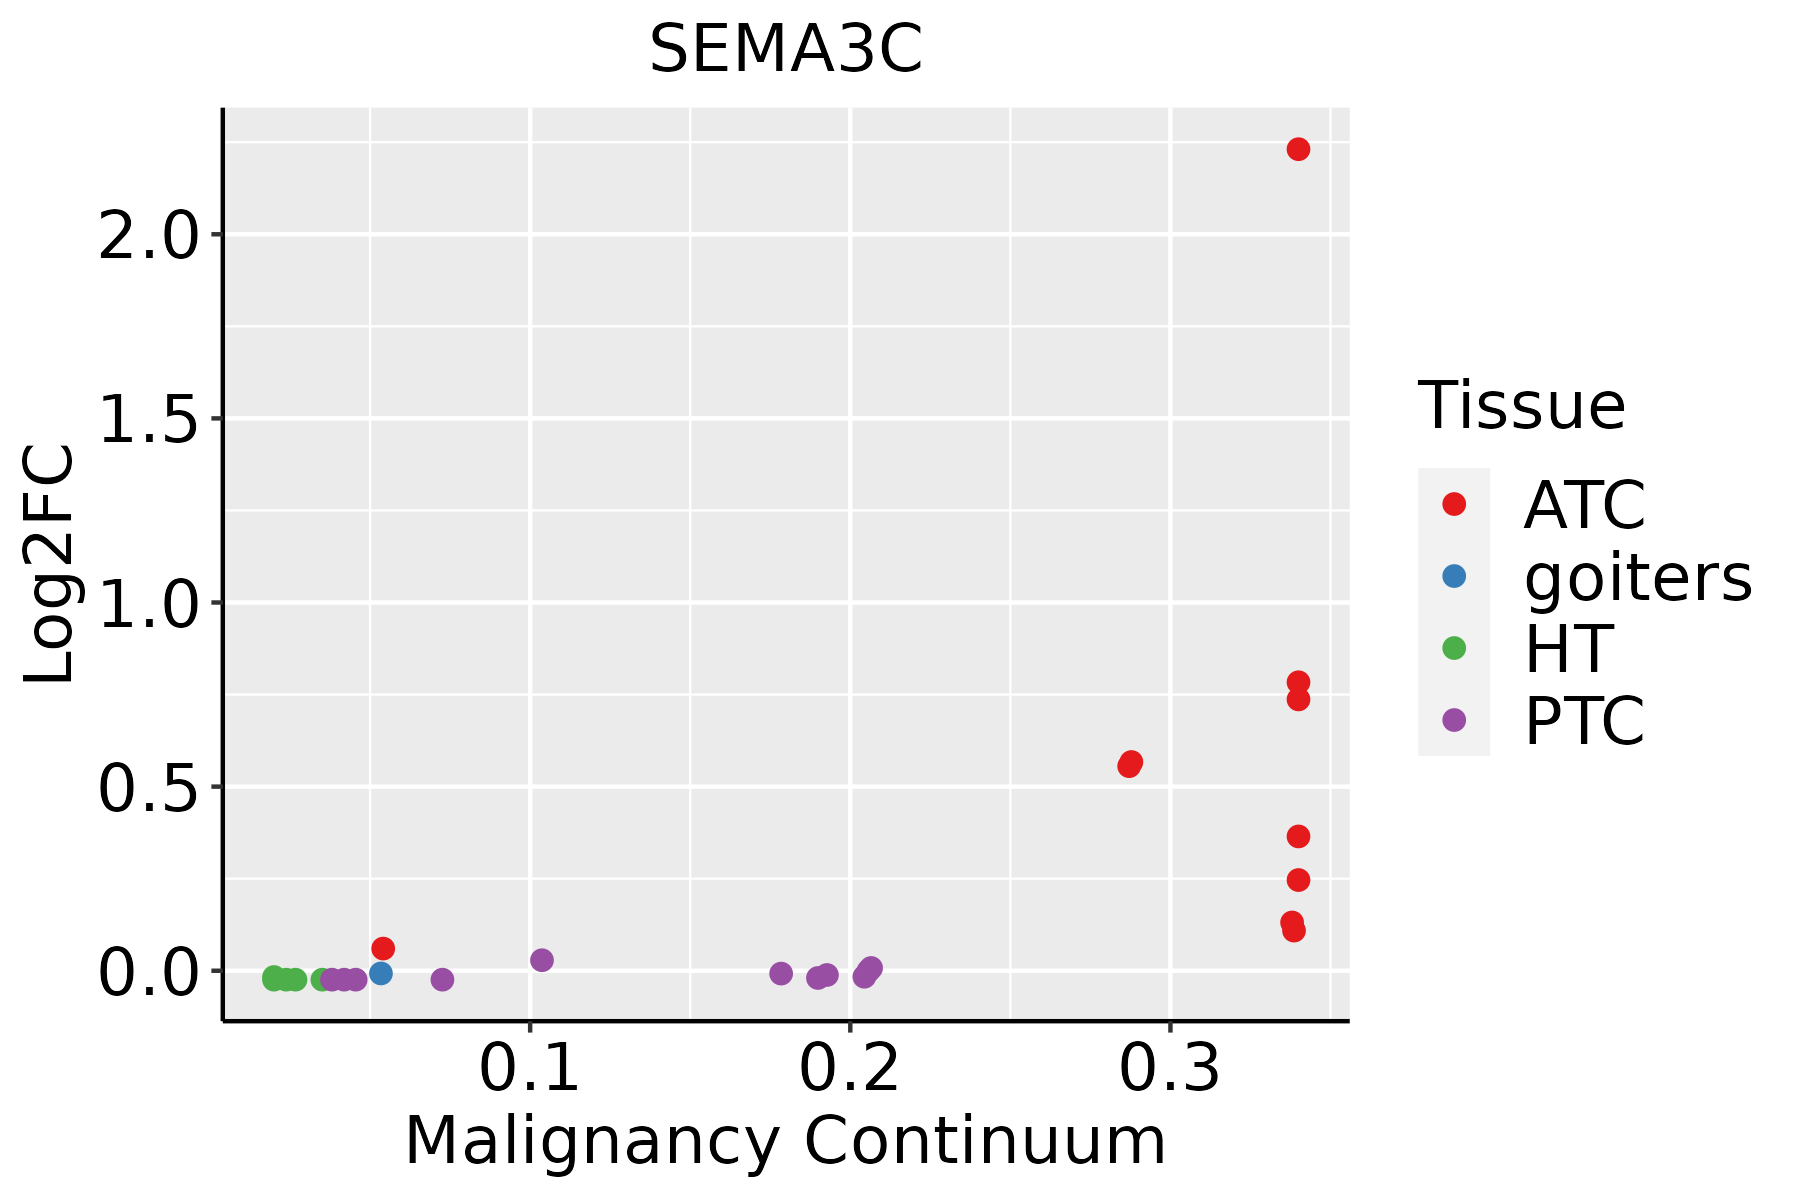 | ATC: Anaplastic thyroid cancer |
| HT: Hashimoto's thyroiditis | ||
| PTC: Papillary thyroid cancer |
| ∗log2FC in expression of this searched gene in stem-like cells from each diseased tissue sample relative to stem-like cells in normal samples in each tissue plotted against the malignancy continuum. Samples are colored based on if they are from different disease stage. |
Top |
Malignant transformation related pathway analysis |
| Find out the enriched GO biological processes and KEGG pathways involved in transition from healthy to precancer to cancer |
| Tissue | Disease Stage | Enriched GO biological Processes |
| Colorectum | AD |  |
| Colorectum | SER |  |
| Colorectum | MSS |  |
| Colorectum | MSI-H |  |
| Colorectum | FAP |  |
| ∗Top 15 enriched GO BP terms are showed in the bar plot of each disease state in each tissue. Each row represents a significant GO biological process which is colored according to the -log10(p.adjust). |
| Page: 1 2 3 4 5 6 7 8 9 |
| GO ID | Tissue | Disease Stage | Description | Gene Ratio | Bg Ratio | pvalue | p.adjust | Count |
| GO:00016679 | Cervix | CC | ameboidal-type cell migration | 110/2311 | 475/18723 | 2.66e-11 | 6.36e-09 | 110 |
| GO:00109757 | Cervix | CC | regulation of neuron projection development | 88/2311 | 445/18723 | 4.26e-06 | 1.09e-04 | 88 |
| GO:00509203 | Cervix | CC | regulation of chemotaxis | 51/2311 | 223/18723 | 8.03e-06 | 1.86e-04 | 51 |
| GO:00160498 | Cervix | CC | cell growth | 92/2311 | 482/18723 | 1.16e-05 | 2.49e-04 | 92 |
| GO:00325359 | Cervix | CC | regulation of cellular component size | 76/2311 | 383/18723 | 1.66e-05 | 3.21e-04 | 76 |
| GO:00615647 | Cervix | CC | axon development | 89/2311 | 467/18723 | 1.71e-05 | 3.27e-04 | 89 |
| GO:004873210 | Cervix | CC | gland development | 84/2311 | 436/18723 | 1.93e-05 | 3.54e-04 | 84 |
| GO:00400133 | Cervix | CC | negative regulation of locomotion | 76/2311 | 391/18723 | 3.47e-05 | 5.60e-04 | 76 |
| GO:00488634 | Cervix | CC | stem cell differentiation | 46/2311 | 206/18723 | 4.11e-05 | 6.36e-04 | 46 |
| GO:00605375 | Cervix | CC | muscle tissue development | 76/2311 | 403/18723 | 9.76e-05 | 1.27e-03 | 76 |
| GO:00074097 | Cervix | CC | axonogenesis | 78/2311 | 418/18723 | 1.14e-04 | 1.43e-03 | 78 |
| GO:00015588 | Cervix | CC | regulation of cell growth | 77/2311 | 414/18723 | 1.40e-04 | 1.70e-03 | 77 |
| GO:00147064 | Cervix | CC | striated muscle tissue development | 72/2311 | 384/18723 | 1.76e-04 | 2.07e-03 | 72 |
| GO:00507705 | Cervix | CC | regulation of axonogenesis | 34/2311 | 154/18723 | 4.87e-04 | 4.76e-03 | 34 |
| GO:00313456 | Cervix | CC | negative regulation of cell projection organization | 39/2311 | 186/18723 | 5.86e-04 | 5.57e-03 | 39 |
| GO:00321022 | Cervix | CC | negative regulation of response to external stimulus | 75/2311 | 420/18723 | 5.96e-04 | 5.61e-03 | 75 |
| GO:00486386 | Cervix | CC | regulation of developmental growth | 61/2311 | 330/18723 | 7.69e-04 | 6.85e-03 | 61 |
| GO:00605606 | Cervix | CC | developmental growth involved in morphogenesis | 46/2311 | 234/18723 | 8.82e-04 | 7.63e-03 | 46 |
| GO:00519603 | Cervix | CC | regulation of nervous system development | 77/2311 | 443/18723 | 1.13e-03 | 9.30e-03 | 77 |
| GO:00507676 | Cervix | CC | regulation of neurogenesis | 65/2311 | 364/18723 | 1.33e-03 | 1.05e-02 | 65 |
| Page: 1 2 3 4 5 6 7 8 9 10 11 12 13 14 15 16 17 18 19 20 21 22 23 24 25 26 27 28 |
| Pathway ID | Tissue | Disease Stage | Description | Gene Ratio | Bg Ratio | pvalue | p.adjust | qvalue | Count |
| hsa043609 | Cervix | CC | Axon guidance | 47/1267 | 182/8465 | 8.13e-05 | 5.38e-04 | 3.18e-04 | 47 |
| hsa0436012 | Cervix | CC | Axon guidance | 47/1267 | 182/8465 | 8.13e-05 | 5.38e-04 | 3.18e-04 | 47 |
| hsa04360 | Colorectum | AD | Axon guidance | 61/2092 | 182/8465 | 4.36e-03 | 2.17e-02 | 1.38e-02 | 61 |
| hsa043601 | Colorectum | AD | Axon guidance | 61/2092 | 182/8465 | 4.36e-03 | 2.17e-02 | 1.38e-02 | 61 |
| hsa043602 | Colorectum | MSS | Axon guidance | 54/1875 | 182/8465 | 1.03e-02 | 3.69e-02 | 2.26e-02 | 54 |
| hsa043603 | Colorectum | MSS | Axon guidance | 54/1875 | 182/8465 | 1.03e-02 | 3.69e-02 | 2.26e-02 | 54 |
| hsa043604 | Colorectum | FAP | Axon guidance | 47/1404 | 182/8465 | 9.09e-04 | 5.20e-03 | 3.16e-03 | 47 |
| hsa043605 | Colorectum | FAP | Axon guidance | 47/1404 | 182/8465 | 9.09e-04 | 5.20e-03 | 3.16e-03 | 47 |
| hsa0436010 | Endometrium | AEH | Axon guidance | 39/1197 | 182/8465 | 4.47e-03 | 2.46e-02 | 1.80e-02 | 39 |
| hsa0436013 | Endometrium | AEH | Axon guidance | 39/1197 | 182/8465 | 4.47e-03 | 2.46e-02 | 1.80e-02 | 39 |
| hsa0436022 | Endometrium | EEC | Axon guidance | 39/1237 | 182/8465 | 7.78e-03 | 3.66e-02 | 2.73e-02 | 39 |
| hsa0436032 | Endometrium | EEC | Axon guidance | 39/1237 | 182/8465 | 7.78e-03 | 3.66e-02 | 2.73e-02 | 39 |
| hsa0436016 | Esophagus | ESCC | Axon guidance | 108/4205 | 182/8465 | 5.13e-03 | 1.30e-02 | 6.67e-03 | 108 |
| hsa0436017 | Esophagus | ESCC | Axon guidance | 108/4205 | 182/8465 | 5.13e-03 | 1.30e-02 | 6.67e-03 | 108 |
| hsa0436014 | Oral cavity | OSCC | Axon guidance | 97/3704 | 182/8465 | 5.59e-03 | 1.33e-02 | 6.76e-03 | 97 |
| hsa0436015 | Oral cavity | OSCC | Axon guidance | 97/3704 | 182/8465 | 5.59e-03 | 1.33e-02 | 6.76e-03 | 97 |
| Page: 1 |
Top |
Cell-cell communication analysis |
| Identification of potential cell-cell interactions between two cell types and their ligand-receptor pairs for different disease states |
| Ligand | Receptor | LRpair | Pathway | Tissue | Disease Stage |
| SEMA3C | NRP1_PLXNA4 | SEMA3C_NRP1_PLXNA4 | SEMA3 | Breast | DCIS |
| SEMA3C | NRP1_NRP2 | SEMA3C_NRP1_NRP2 | SEMA3 | Breast | DCIS |
| SEMA3C | PLXND1 | SEMA3C_PLXND1 | SEMA3 | Breast | DCIS |
| SEMA3C | NRP1_PLXNA2 | SEMA3C_NRP1_PLXNA2 | SEMA3 | Breast | Healthy |
| SEMA3C | NRP2_PLXNA2 | SEMA3C_NRP2_PLXNA2 | SEMA3 | Breast | Healthy |
| SEMA3C | NRP1_NRP2 | SEMA3C_NRP1_NRP2 | SEMA3 | Breast | Healthy |
| SEMA3C | PLXND1 | SEMA3C_PLXND1 | SEMA3 | Breast | Healthy |
| SEMA3C | NRP1_NRP2 | SEMA3C_NRP1_NRP2 | SEMA3 | Cervix | ADJ |
| SEMA3C | PLXND1 | SEMA3C_PLXND1 | SEMA3 | Cervix | ADJ |
| SEMA3C | NRP1_PLXNA2 | SEMA3C_NRP1_PLXNA2 | SEMA3 | Cervix | CC |
| SEMA3C | NRP2_PLXNA2 | SEMA3C_NRP2_PLXNA2 | SEMA3 | Cervix | CC |
| SEMA3C | NRP1_NRP2 | SEMA3C_NRP1_NRP2 | SEMA3 | Cervix | CC |
| SEMA3C | PLXND1 | SEMA3C_PLXND1 | SEMA3 | Cervix | CC |
| SEMA3C | NRP1_NRP2 | SEMA3C_NRP1_NRP2 | SEMA3 | Cervix | Precancer |
| SEMA3C | PLXND1 | SEMA3C_PLXND1 | SEMA3 | Cervix | Precancer |
| SEMA3C | NRP1_PLXNA2 | SEMA3C_NRP1_PLXNA2 | SEMA3 | CRC | AD |
| SEMA3C | NRP2_PLXNA2 | SEMA3C_NRP2_PLXNA2 | SEMA3 | CRC | AD |
| SEMA3C | NRP1_NRP2 | SEMA3C_NRP1_NRP2 | SEMA3 | CRC | AD |
| SEMA3C | PLXND1 | SEMA3C_PLXND1 | SEMA3 | CRC | AD |
| SEMA3C | NRP1_PLXNA2 | SEMA3C_NRP1_PLXNA2 | SEMA3 | CRC | ADJ |
| Page: 1 2 3 4 5 6 7 |
Top |
Single-cell gene regulatory network inference analysis |
| Find out the significant the regulons (TFs) and the target genes of each regulon across cell types for different disease states |
| TF | Cell Type | Tissue | Disease Stage | Target Gene | RSS | Regulon Activity |
| ∗The dot plots of a searched regulon are shown for all cell subpopulations in each disease state of each tissue based on the regulon specific score inferred using pySCENIC and by calculating the average expression. |
| Page: 1 |
Top |
Somatic mutation of malignant transformation related genes |
| Annotation of somatic variants for genes involved in malignant transformation |
| Hugo Symbol | Variant Class | Variant Classification | dbSNP RS | HGVSc | HGVSp | HGVSp Short | SWISSPROT | BIOTYPE | SIFT | PolyPhen | Tumor Sample Barcode | Tissue | Histology | Sex | Age | Stage | Therapy Types | Drugs | Outcome |
| SEMA3C | SNV | Missense_Mutation | novel | c.2225N>A | p.Arg742Lys | p.R742K | Q99985 | protein_coding | deleterious(0.02) | possibly_damaging(0.9) | TCGA-5L-AAT1-01 | Breast | breast invasive carcinoma | Female | <65 | III/IV | Hormone Therapy | letrozol | SD |
| SEMA3C | SNV | Missense_Mutation | c.534N>A | p.Met178Ile | p.M178I | Q99985 | protein_coding | deleterious(0.01) | benign(0.215) | TCGA-AC-A23H-01 | Breast | breast invasive carcinoma | Female | >=65 | I/II | Unknown | Unknown | PD | |
| SEMA3C | SNV | Missense_Mutation | novel | c.280N>A | p.Ser94Thr | p.S94T | Q99985 | protein_coding | tolerated(0.58) | benign(0.1) | TCGA-AC-A8OP-01 | Breast | breast invasive carcinoma | Female | >=65 | I/II | Unknown | Unknown | SD |
| SEMA3C | SNV | Missense_Mutation | c.401N>T | p.Ala134Val | p.A134V | Q99985 | protein_coding | deleterious(0) | probably_damaging(0.995) | TCGA-AO-A124-01 | Breast | breast invasive carcinoma | Female | <65 | I/II | Chemotherapy | doxorubicin | SD | |
| SEMA3C | SNV | Missense_Mutation | c.400N>A | p.Ala134Thr | p.A134T | Q99985 | protein_coding | deleterious(0.01) | probably_damaging(0.998) | TCGA-AO-A124-01 | Breast | breast invasive carcinoma | Female | <65 | I/II | Chemotherapy | doxorubicin | SD | |
| SEMA3C | SNV | Missense_Mutation | rs769829474 | c.620C>T | p.Ala207Val | p.A207V | Q99985 | protein_coding | tolerated(0.22) | benign(0.292) | TCGA-BH-A0EE-01 | Breast | breast invasive carcinoma | Female | >=65 | I/II | Chemotherapy | docetaxel | SD |
| SEMA3C | SNV | Missense_Mutation | c.2156G>A | p.Gly719Glu | p.G719E | Q99985 | protein_coding | tolerated(1) | benign(0.001) | TCGA-D8-A1J8-01 | Breast | breast invasive carcinoma | Female | >=65 | I/II | Hormone Therapy | nolvadex | SD | |
| SEMA3C | SNV | Missense_Mutation | novel | c.314N>C | p.Gly105Ala | p.G105A | Q99985 | protein_coding | deleterious(0) | probably_damaging(0.998) | TCGA-GI-A2C8-01 | Breast | breast invasive carcinoma | Female | <65 | III/IV | Unspecific | Adriamycin | SD |
| SEMA3C | SNV | Missense_Mutation | novel | c.251A>C | p.Gln84Pro | p.Q84P | Q99985 | protein_coding | deleterious(0) | possibly_damaging(0.646) | TCGA-C5-A7X8-01 | Cervix | cervical & endocervical cancer | Female | <65 | I/II | Chemotherapy | cisplatin | SD |
| SEMA3C | SNV | Missense_Mutation | novel | c.181N>A | p.Glu61Lys | p.E61K | Q99985 | protein_coding | deleterious(0) | probably_damaging(0.976) | TCGA-EX-A1H6-01 | Cervix | cervical & endocervical cancer | Female | <65 | I/II | Unknown | Unknown | SD |
| Page: 1 2 3 4 5 6 7 8 9 10 11 12 |
Top |
Related drugs of malignant transformation related genes |
| Identification of chemicals and drugs interact with genes involved in malignant transfromation |
| (DGIdb 4.0) |
| Entrez ID | Symbol | Category | Interaction Types | Drug Claim Name | Drug Name | PMIDs |
| 10512 | SEMA3C | CLINICALLY ACTIONABLE, DRUGGABLE GENOME | irinotecan | IRINOTECAN | 22664479 |
| Page: 1 |

Copyright 2023-Present -The University of Texas Health Science Center at Houston |