
|
|||||
|
 | |
| |
| |
| |
| |
| |
|
Gene: SEMA3A |
Gene summary for SEMA3A |
| Gene information | Species | Human | Gene symbol | SEMA3A | Gene ID | 10371 |
| Gene name | semaphorin 3A | |
| Gene Alias | COLL1 | |
| Cytomap | 7q21.11 | |
| Gene Type | protein-coding | GO ID | GO:0000003 | UniProtAcc | Q14563 |
Top |
Malignant transformation analysis |
| Identification of the aberrant gene expression in precancerous and cancerous lesions by comparing the gene expression of stem-like cells in diseased tissues with normal stem cells |
| Entrez ID | Symbol | Replicates | Species | Organ | Tissue | Adj P-value | Log2FC | Malignancy |
| 10371 | SEMA3A | HCC1_Meng | Human | Liver | HCC | 2.39e-13 | 3.90e-02 | 0.0246 |
| 10371 | SEMA3A | S014 | Human | Liver | HCC | 6.74e-18 | 6.26e-01 | 0.2254 |
| 10371 | SEMA3A | S015 | Human | Liver | HCC | 1.22e-03 | 3.01e-01 | 0.2375 |
| 10371 | SEMA3A | S016 | Human | Liver | HCC | 1.21e-14 | 5.02e-01 | 0.2243 |
| 10371 | SEMA3A | ATC09 | Human | Thyroid | ATC | 4.53e-07 | 4.02e-01 | 0.2871 |
| 10371 | SEMA3A | ATC11 | Human | Thyroid | ATC | 9.94e-09 | 9.03e-01 | 0.3386 |
| 10371 | SEMA3A | ATC12 | Human | Thyroid | ATC | 2.77e-07 | 1.93e-01 | 0.34 |
| 10371 | SEMA3A | ATC1 | Human | Thyroid | ATC | 2.63e-07 | 4.37e-01 | 0.2878 |
| 10371 | SEMA3A | ATC2 | Human | Thyroid | ATC | 7.49e-03 | 4.71e-01 | 0.34 |
| 10371 | SEMA3A | ATC3 | Human | Thyroid | ATC | 6.53e-05 | 2.95e-01 | 0.338 |
| 10371 | SEMA3A | ATC4 | Human | Thyroid | ATC | 6.40e-11 | 3.20e-01 | 0.34 |
| Page: 1 |
| Tissue | Expression Dynamics | Abbreviation |
| Liver | 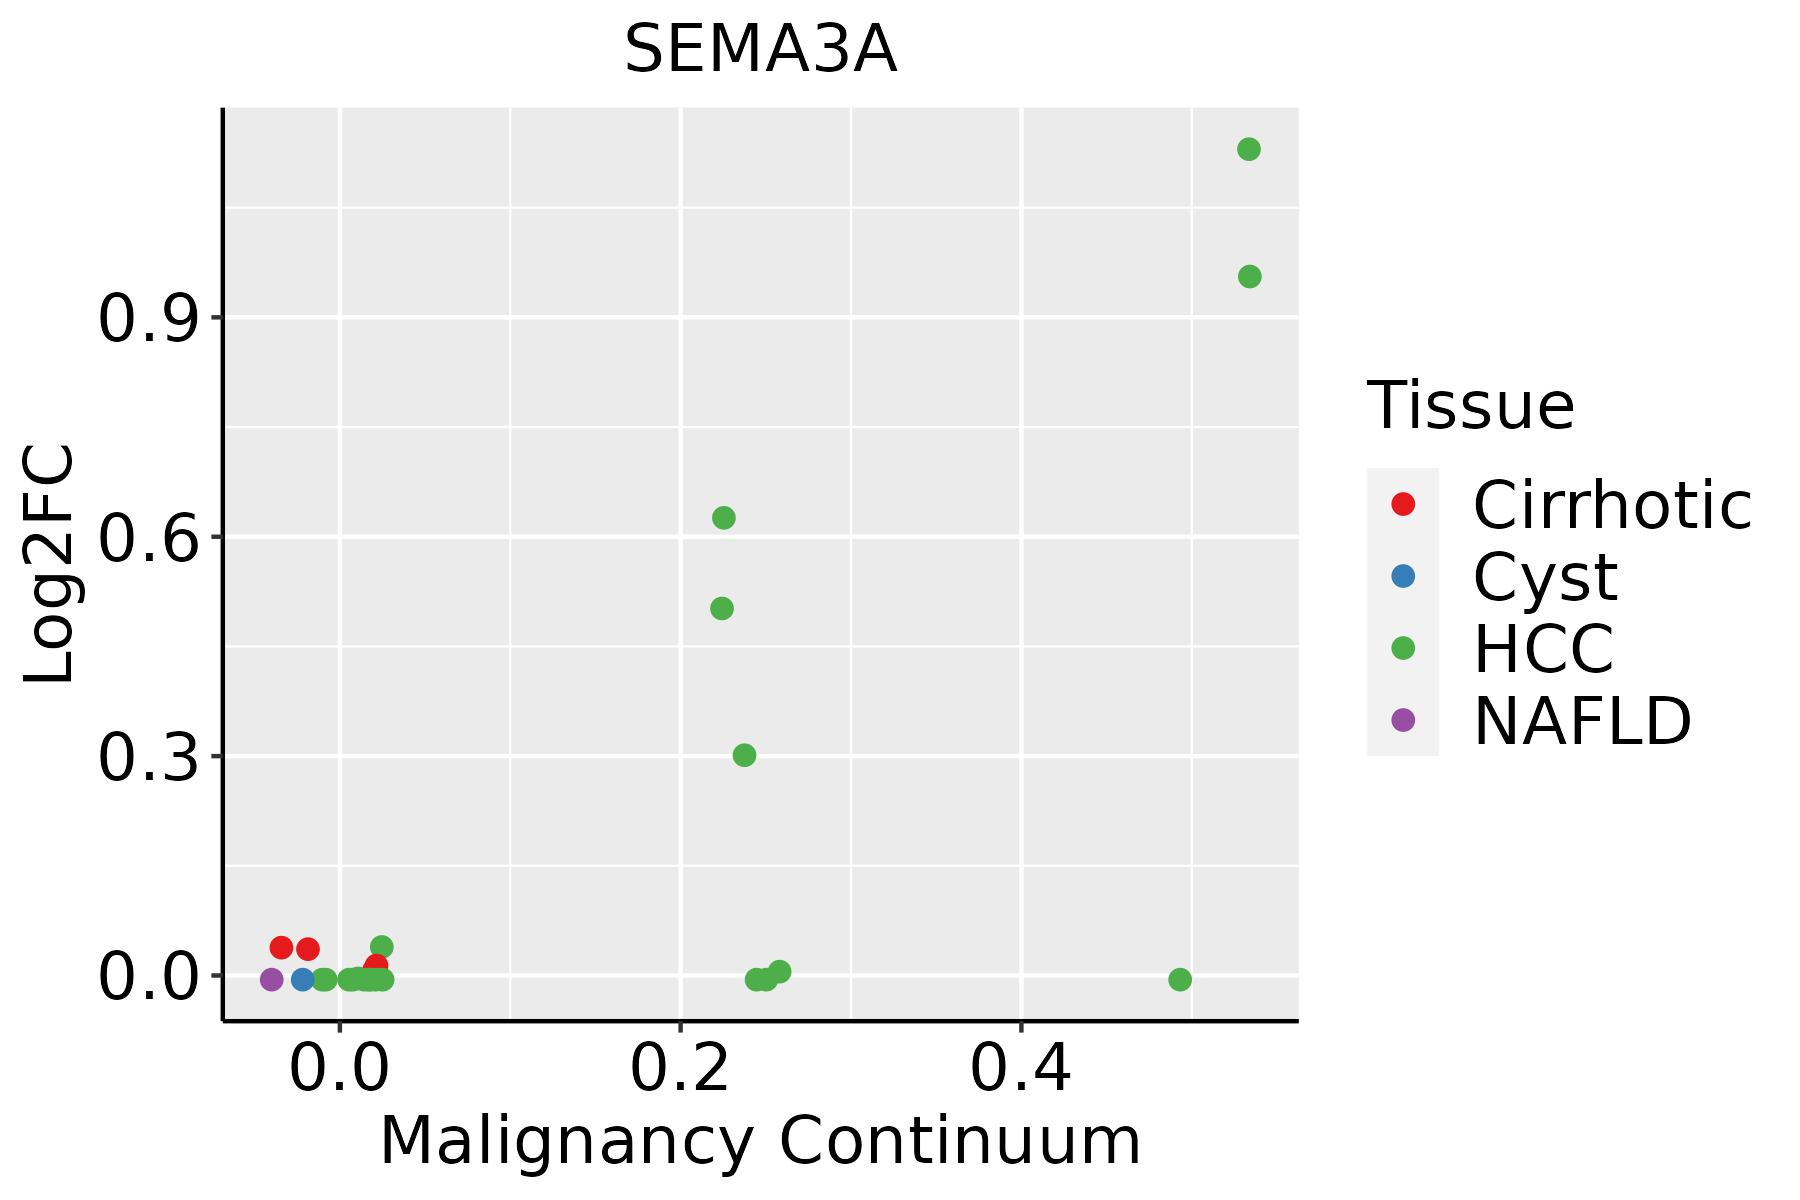 | HCC: Hepatocellular carcinoma |
| NAFLD: Non-alcoholic fatty liver disease | ||
| Thyroid | 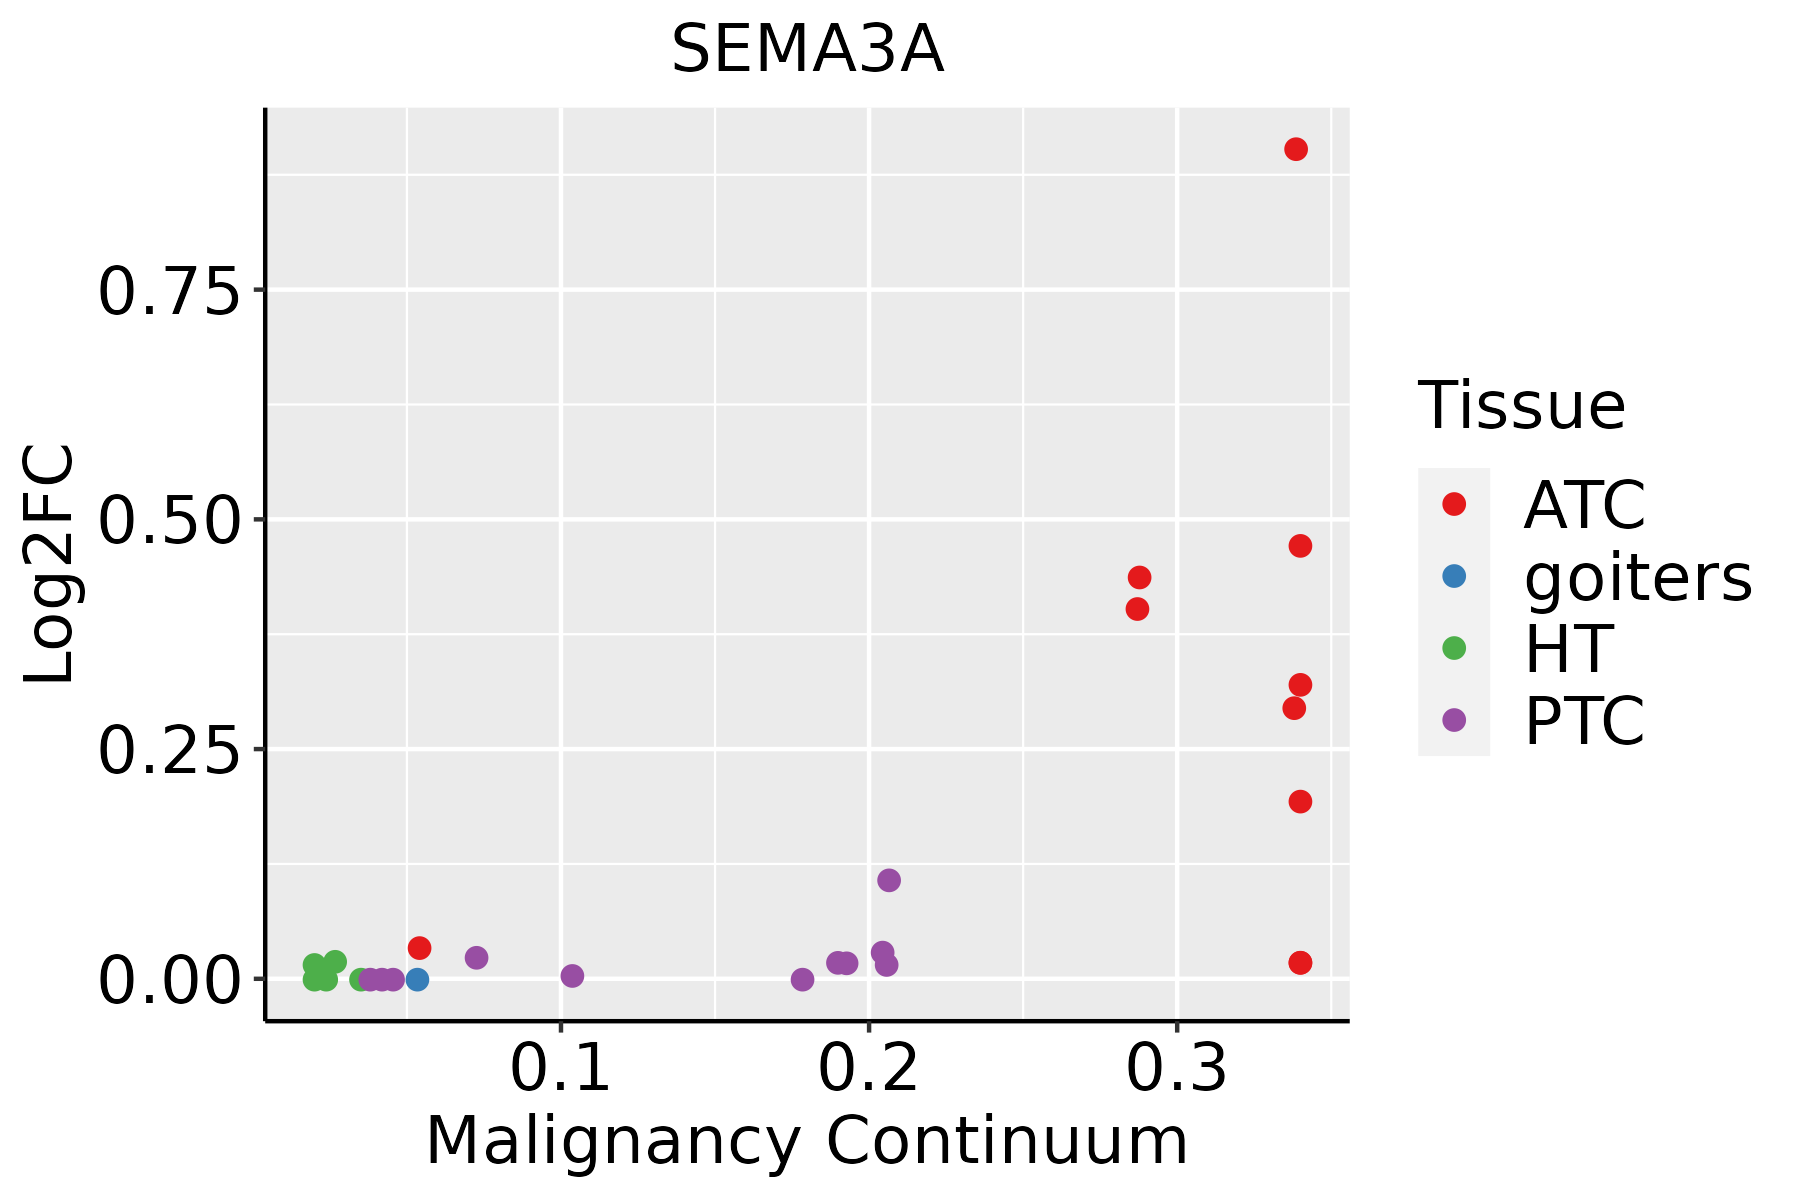 | ATC: Anaplastic thyroid cancer |
| HT: Hashimoto's thyroiditis | ||
| PTC: Papillary thyroid cancer |
| ∗log2FC in expression of this searched gene in stem-like cells from each diseased tissue sample relative to stem-like cells in normal samples in each tissue plotted against the malignancy continuum. Samples are colored based on if they are from different disease stage. |
Top |
Malignant transformation related pathway analysis |
| Find out the enriched GO biological processes and KEGG pathways involved in transition from healthy to precancer to cancer |
| Tissue | Disease Stage | Enriched GO biological Processes |
| Colorectum | AD |  |
| Colorectum | SER |  |
| Colorectum | MSS |  |
| Colorectum | MSI-H |  |
| Colorectum | FAP |  |
| ∗Top 15 enriched GO BP terms are showed in the bar plot of each disease state in each tissue. Each row represents a significant GO biological process which is colored according to the -log10(p.adjust). |
| Page: 1 2 3 4 5 6 7 8 9 |
| GO ID | Tissue | Disease Stage | Description | Gene Ratio | Bg Ratio | pvalue | p.adjust | Count |
| GO:001604921 | Liver | HCC | cell growth | 269/7958 | 482/18723 | 1.84e-09 | 5.35e-08 | 269 |
| GO:003253522 | Liver | HCC | regulation of cellular component size | 217/7958 | 383/18723 | 1.28e-08 | 3.14e-07 | 217 |
| GO:004873222 | Liver | HCC | gland development | 242/7958 | 436/18723 | 2.26e-08 | 5.28e-07 | 242 |
| GO:000155821 | Liver | HCC | regulation of cell growth | 228/7958 | 414/18723 | 1.34e-07 | 2.55e-06 | 228 |
| GO:003109822 | Liver | HCC | stress-activated protein kinase signaling cascade | 138/7958 | 247/18723 | 1.43e-05 | 1.57e-04 | 138 |
| GO:005140322 | Liver | HCC | stress-activated MAPK cascade | 134/7958 | 239/18723 | 1.50e-05 | 1.64e-04 | 134 |
| GO:2001224 | Liver | HCC | positive regulation of neuron migration | 14/7958 | 16/18723 | 2.73e-04 | 1.98e-03 | 14 |
| GO:006056011 | Liver | HCC | developmental growth involved in morphogenesis | 124/7958 | 234/18723 | 7.37e-04 | 4.47e-03 | 124 |
| GO:007030222 | Liver | HCC | regulation of stress-activated protein kinase signaling cascade | 105/7958 | 195/18723 | 8.79e-04 | 5.20e-03 | 105 |
| GO:001097511 | Liver | HCC | regulation of neuron projection development | 220/7958 | 445/18723 | 1.68e-03 | 8.78e-03 | 220 |
| GO:00459263 | Liver | HCC | negative regulation of growth | 129/7958 | 249/18723 | 1.81e-03 | 9.37e-03 | 129 |
| GO:003287222 | Liver | HCC | regulation of stress-activated MAPK cascade | 102/7958 | 192/18723 | 1.86e-03 | 9.49e-03 | 102 |
| GO:004867511 | Liver | HCC | axon extension | 67/7958 | 120/18723 | 2.17e-03 | 1.09e-02 | 67 |
| GO:199013811 | Liver | HCC | neuron projection extension | 92/7958 | 172/18723 | 2.31e-03 | 1.14e-02 | 92 |
| GO:004858811 | Liver | HCC | developmental cell growth | 121/7958 | 234/18723 | 2.68e-03 | 1.28e-02 | 121 |
| GO:00507674 | Liver | HCC | regulation of neurogenesis | 181/7958 | 364/18723 | 3.00e-03 | 1.40e-02 | 181 |
| GO:000725412 | Liver | HCC | JNK cascade | 89/7958 | 167/18723 | 3.09e-03 | 1.44e-02 | 89 |
| GO:00083614 | Liver | HCC | regulation of cell size | 95/7958 | 181/18723 | 4.15e-03 | 1.81e-02 | 95 |
| GO:0030308 | Liver | HCC | negative regulation of cell growth | 98/7958 | 188/18723 | 4.74e-03 | 2.02e-02 | 98 |
| GO:00305164 | Liver | HCC | regulation of axon extension | 52/7958 | 95/18723 | 1.07e-02 | 3.97e-02 | 52 |
| Page: 1 2 3 4 5 |
| Pathway ID | Tissue | Disease Stage | Description | Gene Ratio | Bg Ratio | pvalue | p.adjust | qvalue | Count |
| Page: 1 |
Top |
Cell-cell communication analysis |
| Identification of potential cell-cell interactions between two cell types and their ligand-receptor pairs for different disease states |
| Ligand | Receptor | LRpair | Pathway | Tissue | Disease Stage |
| SEMA3A | NRP1_PLXNA2 | SEMA3A_NRP1_PLXNA2 | SEMA3 | CRC | AD |
| SEMA3A | NRP1_PLXNA2 | SEMA3A_NRP1_PLXNA2 | SEMA3 | CRC | ADJ |
| SEMA3A | NRP1_PLXNA4 | SEMA3A_NRP1_PLXNA4 | SEMA3 | CRC | ADJ |
| SEMA3A | NRP1_PLXNA2 | SEMA3A_NRP1_PLXNA2 | SEMA3 | CRC | CRC |
| SEMA3A | NRP1_PLXNA4 | SEMA3A_NRP1_PLXNA4 | SEMA3 | CRC | CRC |
| SEMA3A | NRP1_PLXNA2 | SEMA3A_NRP1_PLXNA2 | SEMA3 | CRC | FAP |
| SEMA3A | NRP1_PLXNA4 | SEMA3A_NRP1_PLXNA4 | SEMA3 | CRC | FAP |
| SEMA3A | NRP1_PLXNA2 | SEMA3A_NRP1_PLXNA2 | SEMA3 | CRC | MSS |
| SEMA3A | NRP1_PLXNA2 | SEMA3A_NRP1_PLXNA2 | SEMA3 | Endometrium | ADJ |
| SEMA3A | NRP1_PLXNA2 | SEMA3A_NRP1_PLXNA2 | SEMA3 | Endometrium | AEH |
| SEMA3A | NRP1_PLXNA2 | SEMA3A_NRP1_PLXNA2 | SEMA3 | Endometrium | EEC |
| SEMA3A | NRP1_PLXNA2 | SEMA3A_NRP1_PLXNA2 | SEMA3 | Esophagus | ESCC |
| SEMA3A | NRP1_PLXNA2 | SEMA3A_NRP1_PLXNA2 | SEMA3 | GC | ADJ |
| SEMA3A | NRP1_PLXNA1 | SEMA3A_NRP1_PLXNA1 | SEMA3 | HNSCC | OSCC |
| SEMA3A | NRP1_PLXNA2 | SEMA3A_NRP1_PLXNA2 | SEMA3 | HNSCC | OSCC |
| SEMA3A | NRP1_PLXNA2 | SEMA3A_NRP1_PLXNA2 | SEMA3 | HNSCC | Precancer |
| SEMA3A | NRP1_PLXNA4 | SEMA3A_NRP1_PLXNA4 | SEMA3 | Lung | AAH |
| SEMA3A | NRP1_PLXNA4 | SEMA3A_NRP1_PLXNA4 | SEMA3 | Lung | ADJ |
| SEMA3A | NRP1_PLXNA2 | SEMA3A_NRP1_PLXNA2 | SEMA3 | Lung | AIS |
| SEMA3A | NRP1_PLXNA4 | SEMA3A_NRP1_PLXNA4 | SEMA3 | Lung | AIS |
| Page: 1 2 |
Top |
Single-cell gene regulatory network inference analysis |
| Find out the significant the regulons (TFs) and the target genes of each regulon across cell types for different disease states |
| TF | Cell Type | Tissue | Disease Stage | Target Gene | RSS | Regulon Activity |
| ∗The dot plots of a searched regulon are shown for all cell subpopulations in each disease state of each tissue based on the regulon specific score inferred using pySCENIC and by calculating the average expression. |
| Page: 1 |
Top |
Somatic mutation of malignant transformation related genes |
| Annotation of somatic variants for genes involved in malignant transformation |
| Hugo Symbol | Variant Class | Variant Classification | dbSNP RS | HGVSc | HGVSp | HGVSp Short | SWISSPROT | BIOTYPE | SIFT | PolyPhen | Tumor Sample Barcode | Tissue | Histology | Sex | Age | Stage | Therapy Types | Drugs | Outcome |
| SEMA3A | SNV | Missense_Mutation | rs148900275 | c.1546N>T | p.Arg516Trp | p.R516W | Q14563 | protein_coding | deleterious(0) | probably_damaging(0.997) | TCGA-A1-A0SQ-01 | Breast | breast invasive carcinoma | Female | <65 | I/II | Chemotherapy | ac | SD |
| SEMA3A | SNV | Missense_Mutation | c.1288N>G | p.Gln430Glu | p.Q430E | Q14563 | protein_coding | tolerated(0.33) | benign(0.24) | TCGA-A2-A04W-01 | Breast | breast invasive carcinoma | Female | <65 | I/II | Chemotherapy | cytoxan | SD | |
| SEMA3A | SNV | Missense_Mutation | novel | c.706G>C | p.Asp236His | p.D236H | Q14563 | protein_coding | tolerated(0.16) | possibly_damaging(0.529) | TCGA-A2-A3XX-01 | Breast | breast invasive carcinoma | Female | <65 | I/II | Chemotherapy | cyclophosphamide | CR |
| SEMA3A | SNV | Missense_Mutation | c.88C>G | p.Pro30Ala | p.P30A | Q14563 | protein_coding | deleterious(0) | possibly_damaging(0.543) | TCGA-AR-A1AQ-01 | Breast | breast invasive carcinoma | Female | <65 | I/II | Chemotherapy | doxorubicin | SD | |
| SEMA3A | SNV | Missense_Mutation | c.80N>G | p.Asn27Ser | p.N27S | Q14563 | protein_coding | tolerated(0.97) | benign(0) | TCGA-D8-A1XQ-01 | Breast | breast invasive carcinoma | Female | >=65 | I/II | Unknown | Unknown | SD | |
| SEMA3A | SNV | Missense_Mutation | c.527N>A | p.Leu176Gln | p.L176Q | Q14563 | protein_coding | tolerated(0.22) | benign(0.014) | TCGA-E9-A22E-01 | Breast | breast invasive carcinoma | Female | <65 | III/IV | Chemotherapy | cyclophosphane | SD | |
| SEMA3A | SNV | Missense_Mutation | c.2094C>A | p.Ser698Arg | p.S698R | Q14563 | protein_coding | tolerated(0.34) | benign(0.056) | TCGA-E9-A22G-01 | Breast | breast invasive carcinoma | Female | <65 | I/II | Chemotherapy | doxorubicin | SD | |
| SEMA3A | SNV | Missense_Mutation | c.613C>T | p.Leu205Phe | p.L205F | Q14563 | protein_coding | deleterious(0.05) | probably_damaging(0.986) | TCGA-EW-A1J5-01 | Breast | breast invasive carcinoma | Female | <65 | I/II | Chemotherapy | adriamycin | SD | |
| SEMA3A | deletion | In_Frame_Del | novel | c.2173_2181delNNNNNNNNN | p.Val725_Lys727del | p.V725_K727del | Q14563 | protein_coding | TCGA-AR-A0TP-01 | Breast | breast invasive carcinoma | Female | <65 | I/II | Chemotherapy | doxorubicin | SD | ||
| SEMA3A | SNV | Missense_Mutation | c.1655G>A | p.Arg552His | p.R552H | Q14563 | protein_coding | deleterious(0) | probably_damaging(0.997) | TCGA-2W-A8YY-01 | Cervix | cervical & endocervical cancer | Female | <65 | I/II | Chemotherapy | cisplatin | CR |
| Page: 1 2 3 4 5 6 7 8 9 10 11 12 13 14 15 |
Top |
Related drugs of malignant transformation related genes |
| Identification of chemicals and drugs interact with genes involved in malignant transfromation |
| (DGIdb 4.0) |
| Entrez ID | Symbol | Category | Interaction Types | Drug Claim Name | Drug Name | PMIDs |
| Page: 1 |

Copyright 2023-Present -The University of Texas Health Science Center at Houston |