
|
|||||
|
 | |
| |
| |
| |
| |
| |
|
Gene: SELENOW |
Gene summary for SELENOW |
| Gene information | Species | Human | Gene symbol | SELENOW | Gene ID | 6415 |
| Gene name | selenoprotein W | |
| Gene Alias | SEPW1 | |
| Cytomap | 19q13.33 | |
| Gene Type | protein-coding | GO ID | GO:0008150 | UniProtAcc | P63302 |
Top |
Malignant transformation analysis |
| Identification of the aberrant gene expression in precancerous and cancerous lesions by comparing the gene expression of stem-like cells in diseased tissues with normal stem cells |
| Entrez ID | Symbol | Replicates | Species | Organ | Tissue | Adj P-value | Log2FC | Malignancy |
| 6415 | SELENOW | GSM4909281 | Human | Breast | IDC | 1.18e-28 | 7.29e-01 | 0.21 |
| 6415 | SELENOW | GSM4909285 | Human | Breast | IDC | 1.65e-10 | 1.85e-01 | 0.21 |
| 6415 | SELENOW | GSM4909286 | Human | Breast | IDC | 5.62e-14 | -7.34e-02 | 0.1081 |
| 6415 | SELENOW | GSM4909288 | Human | Breast | IDC | 5.19e-05 | 5.21e-01 | 0.0988 |
| 6415 | SELENOW | GSM4909289 | Human | Breast | IDC | 8.10e-07 | 5.91e-01 | 0.1064 |
| 6415 | SELENOW | GSM4909290 | Human | Breast | IDC | 3.74e-14 | 4.78e-01 | 0.2096 |
| 6415 | SELENOW | GSM4909291 | Human | Breast | IDC | 5.13e-29 | 8.02e-01 | 0.1753 |
| 6415 | SELENOW | GSM4909293 | Human | Breast | IDC | 1.16e-12 | 3.01e-01 | 0.1581 |
| 6415 | SELENOW | GSM4909295 | Human | Breast | IDC | 1.33e-02 | 1.93e-01 | 0.0898 |
| 6415 | SELENOW | GSM4909296 | Human | Breast | IDC | 3.84e-11 | 4.71e-01 | 0.1524 |
| 6415 | SELENOW | GSM4909297 | Human | Breast | IDC | 3.96e-12 | 3.37e-01 | 0.1517 |
| 6415 | SELENOW | GSM4909298 | Human | Breast | IDC | 1.89e-12 | 3.88e-01 | 0.1551 |
| 6415 | SELENOW | GSM4909301 | Human | Breast | IDC | 8.20e-14 | 5.70e-01 | 0.1577 |
| 6415 | SELENOW | GSM4909302 | Human | Breast | IDC | 1.07e-07 | 3.83e-01 | 0.1545 |
| 6415 | SELENOW | GSM4909303 | Human | Breast | IDC | 6.59e-05 | 5.14e-01 | 0.0438 |
| 6415 | SELENOW | GSM4909304 | Human | Breast | IDC | 3.76e-14 | 4.65e-01 | 0.1636 |
| 6415 | SELENOW | GSM4909305 | Human | Breast | IDC | 3.66e-08 | 2.85e-01 | 0.0436 |
| 6415 | SELENOW | GSM4909306 | Human | Breast | IDC | 4.12e-38 | 8.32e-01 | 0.1564 |
| 6415 | SELENOW | GSM4909307 | Human | Breast | IDC | 2.58e-08 | 4.90e-01 | 0.1569 |
| 6415 | SELENOW | GSM4909308 | Human | Breast | IDC | 4.56e-23 | 4.68e-01 | 0.158 |
| Page: 1 2 3 4 5 6 7 8 9 10 11 12 13 14 15 |
| Tissue | Expression Dynamics | Abbreviation |
| Breast |  | IDC: Invasive ductal carcinoma |
| DCIS: Ductal carcinoma in situ | ||
| Precancer(BRCA1-mut): Precancerous lesion from BRCA1 mutation carriers | ||
| Cervix |  | CC: Cervix cancer |
| HSIL_HPV: HPV-infected high-grade squamous intraepithelial lesions | ||
| N_HPV: HPV-infected normal cervix | ||
| Colorectum (GSE201348) |  | FAP: Familial adenomatous polyposis |
| CRC: Colorectal cancer | ||
| Colorectum (HTA11) | 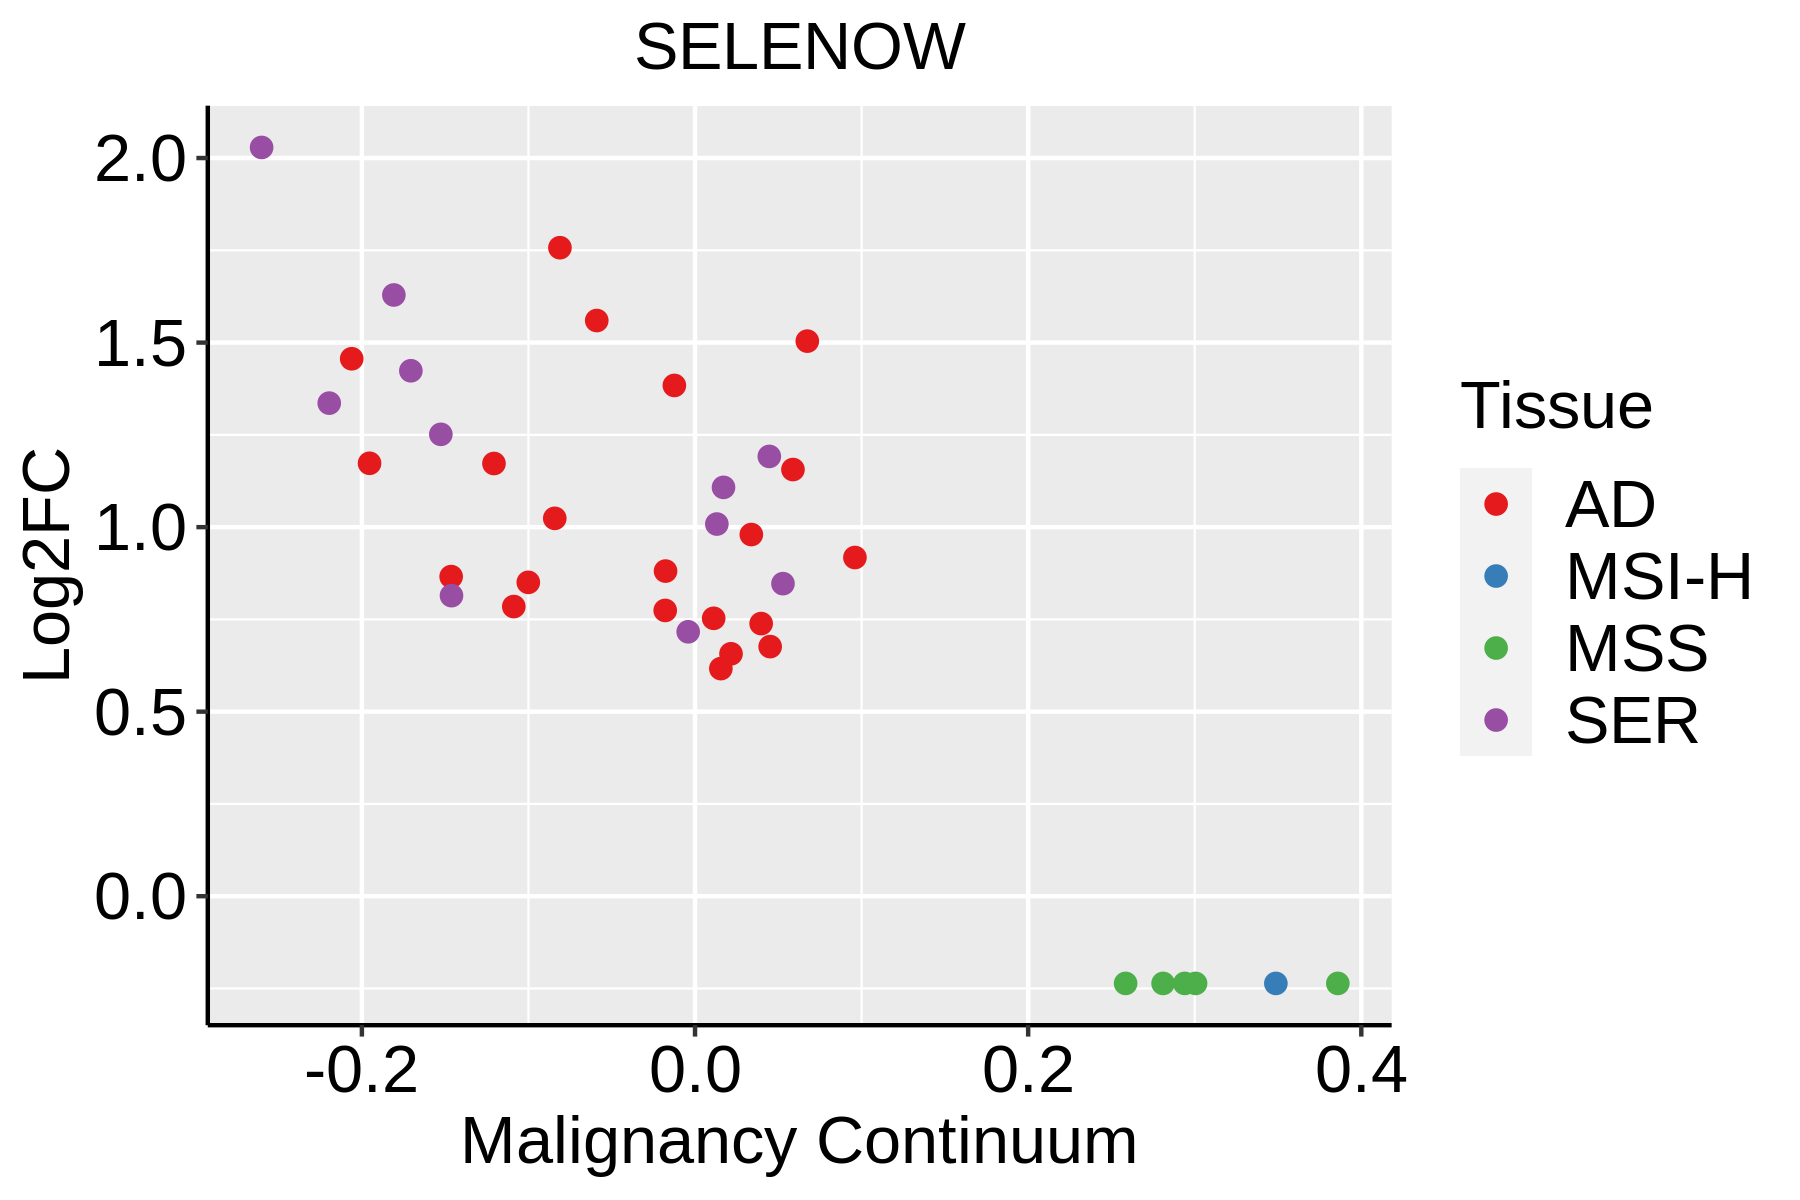 | AD: Adenomas |
| SER: Sessile serrated lesions | ||
| MSI-H: Microsatellite-high colorectal cancer | ||
| MSS: Microsatellite stable colorectal cancer | ||
| Endometrium | 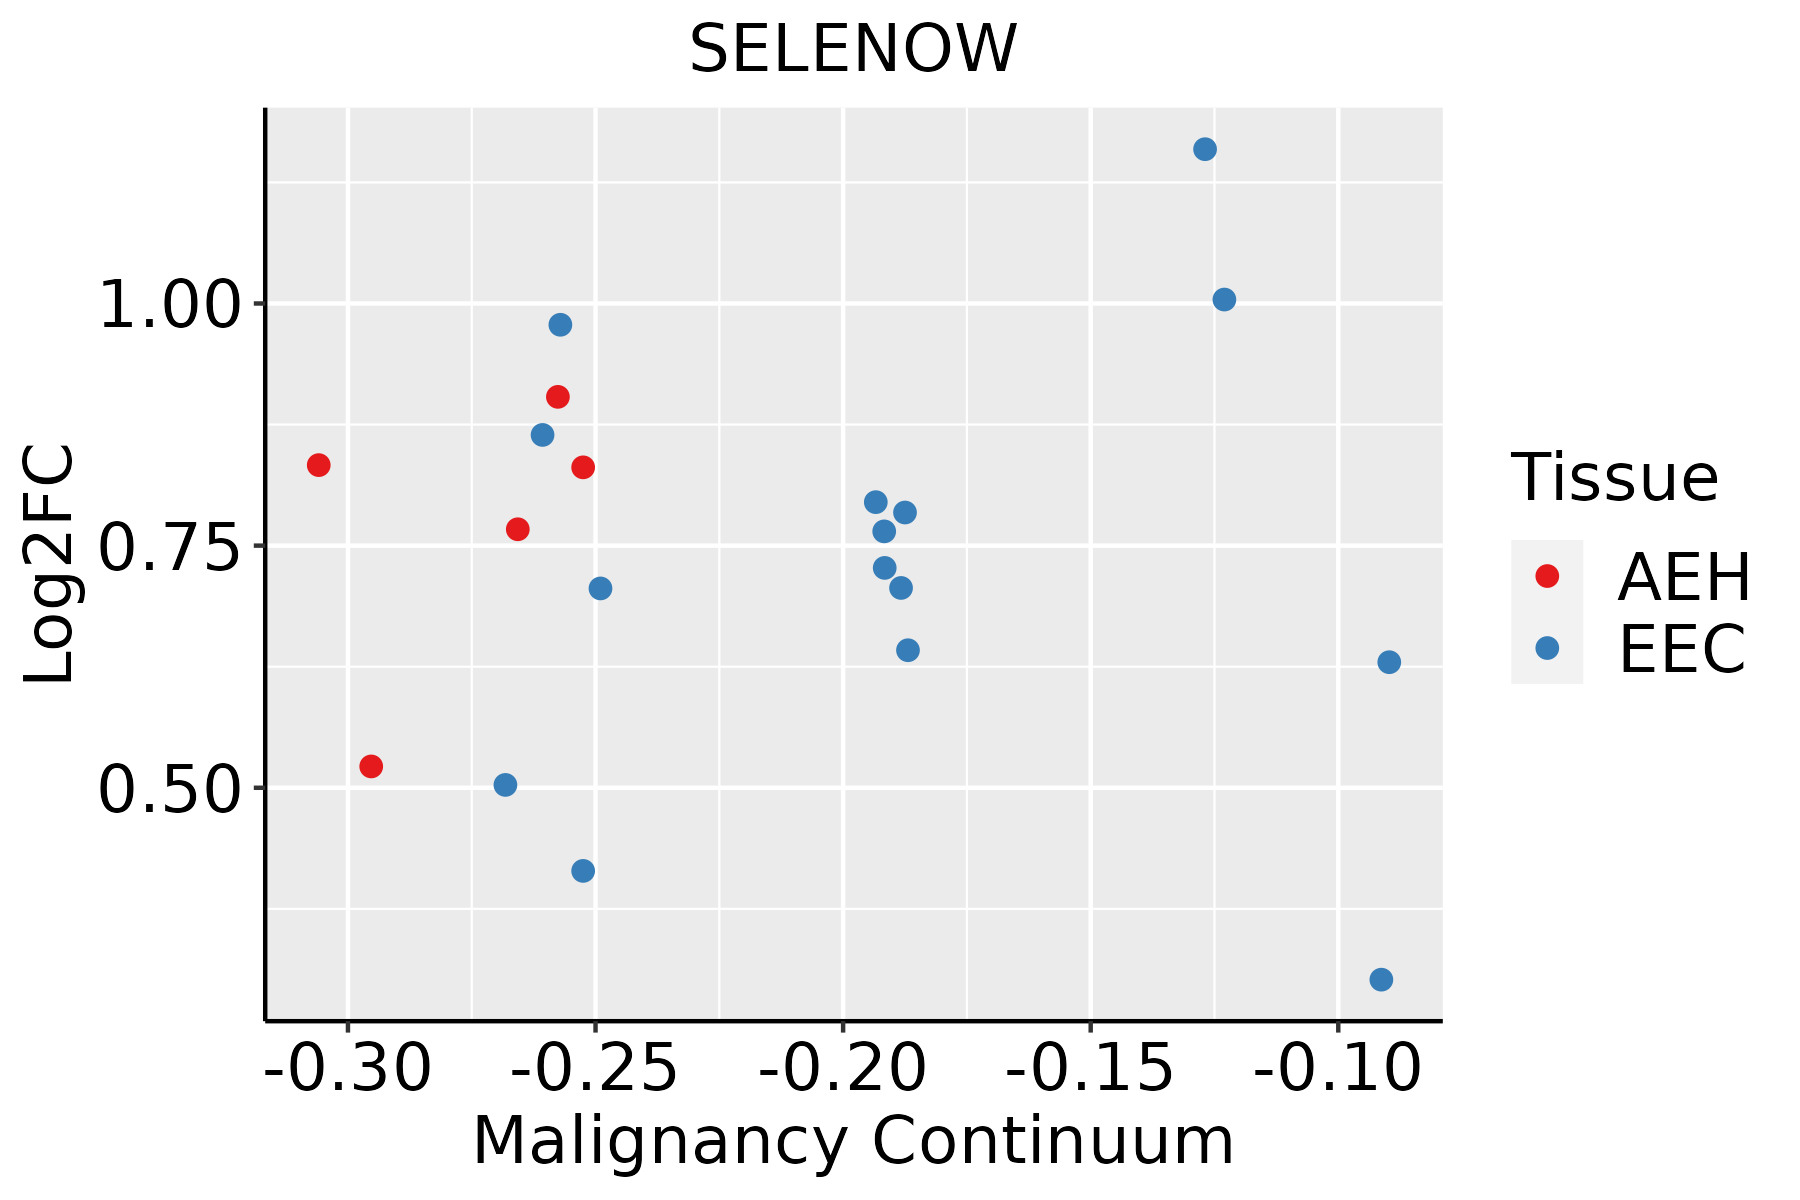 | AEH: Atypical endometrial hyperplasia |
| EEC: Endometrioid Cancer | ||
| Esophagus | 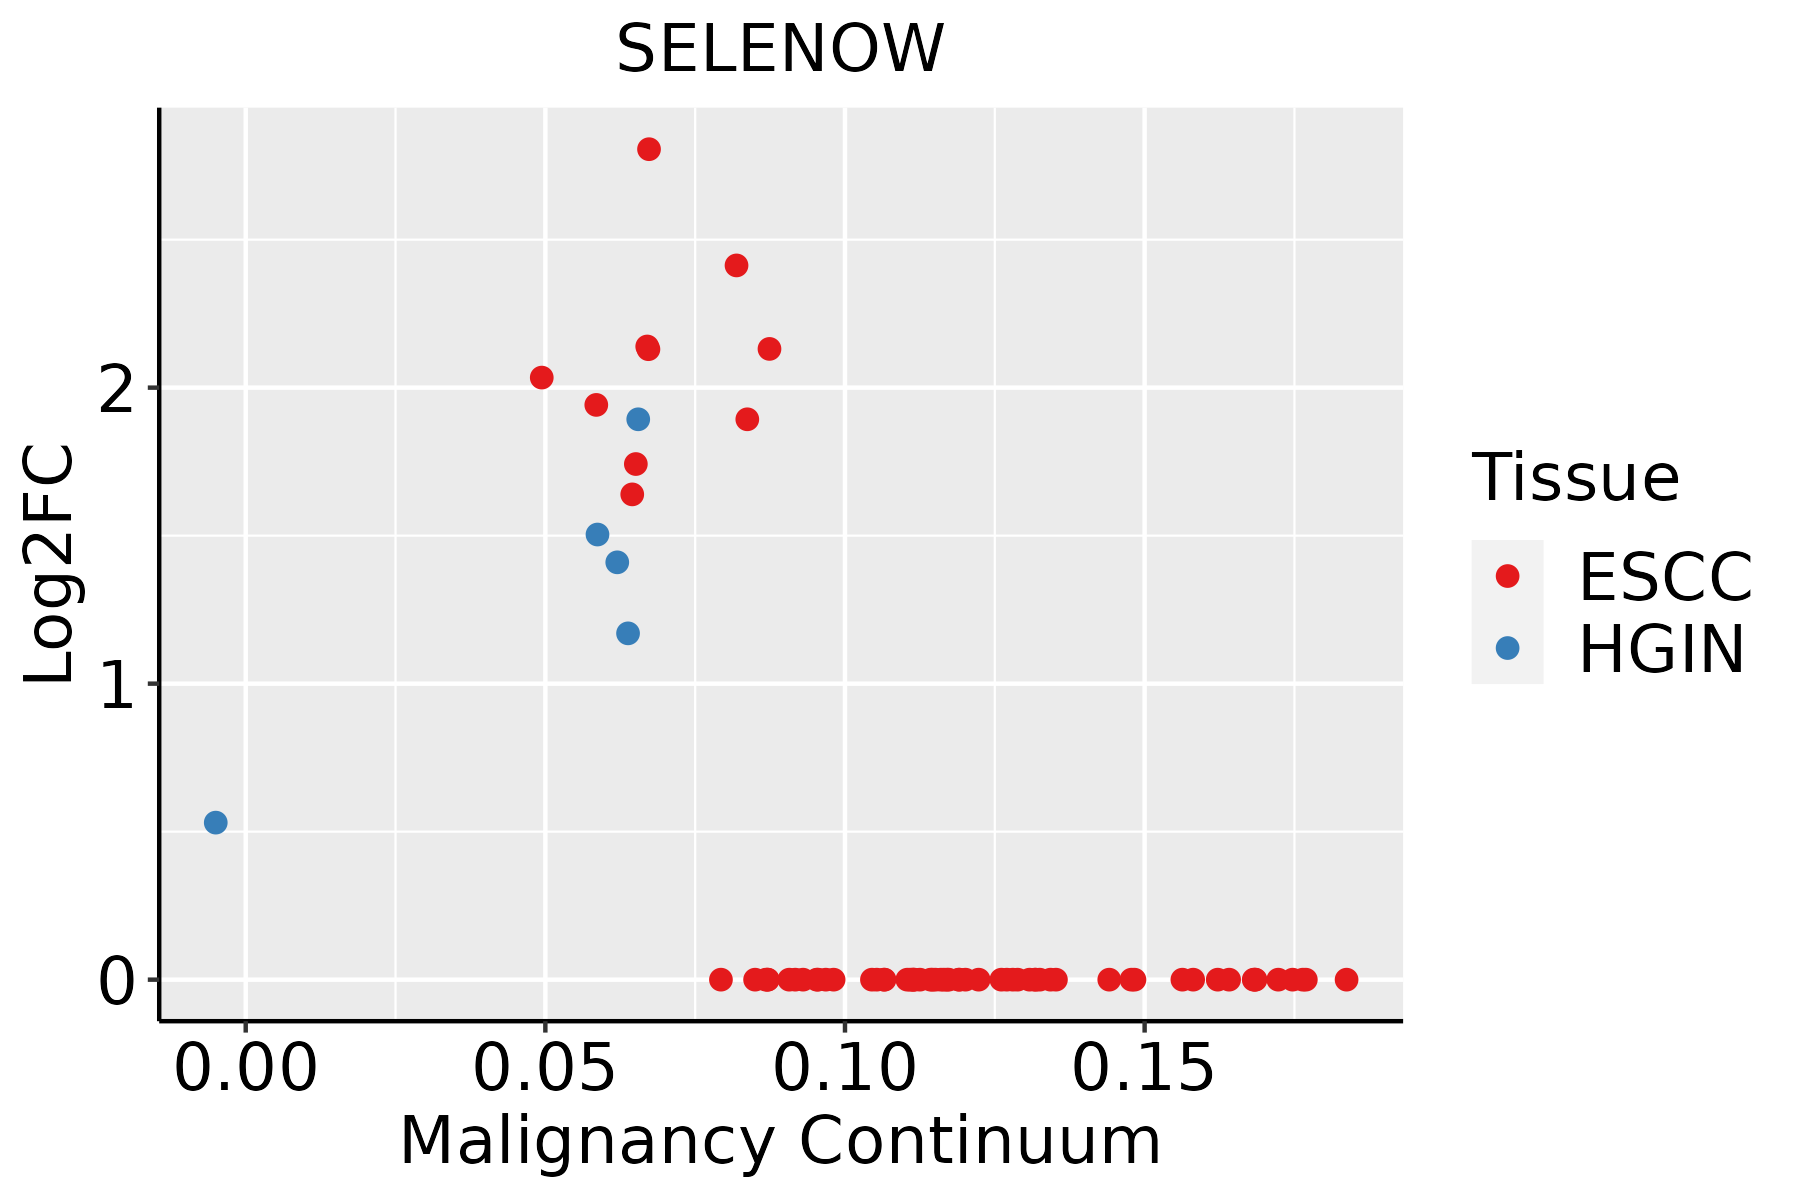 | ESCC: Esophageal squamous cell carcinoma |
| HGIN: High-grade intraepithelial neoplasias | ||
| LGIN: Low-grade intraepithelial neoplasias | ||
| GC | 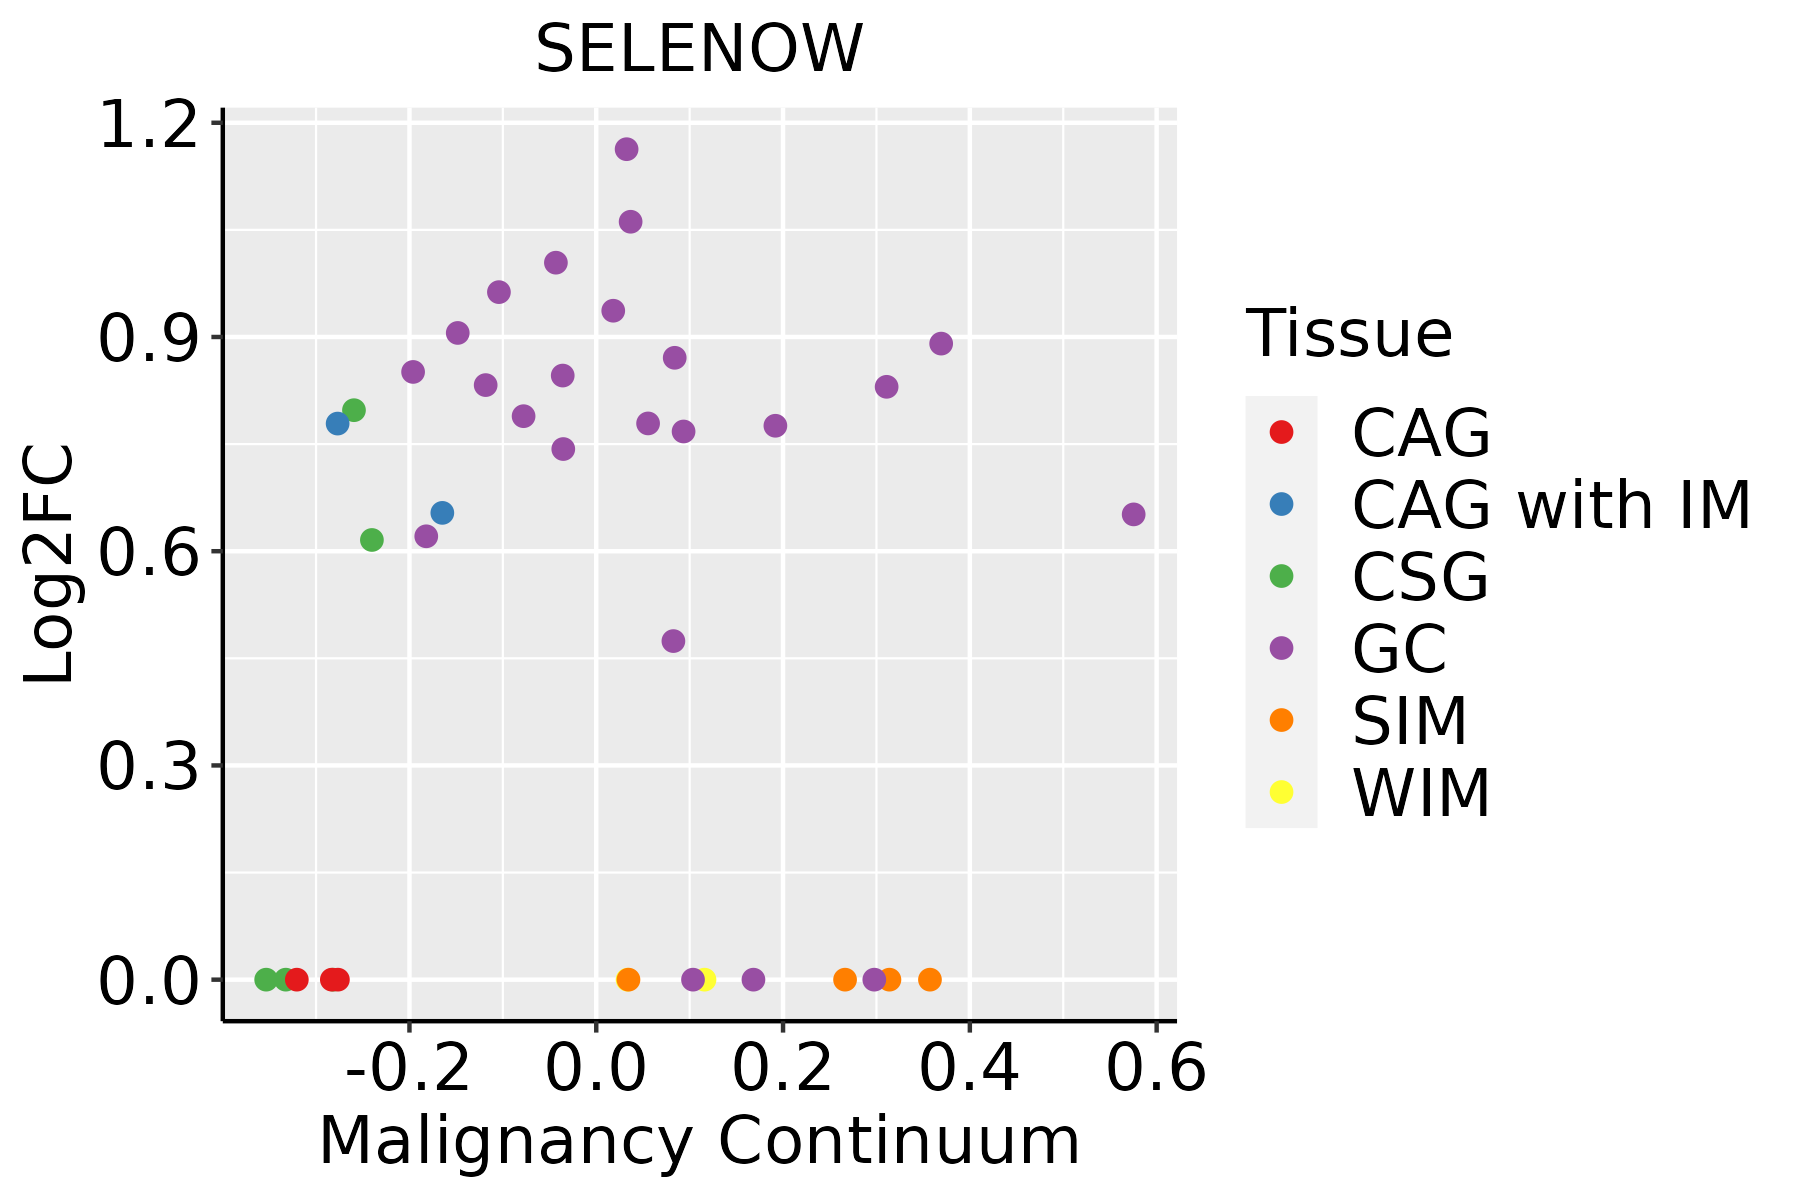 | CAG: Chronic atrophic gastritis |
| CAG with IM: Chronic atrophic gastritis with intestinal metaplasia | ||
| CSG: Chronic superficial gastritis | ||
| GC: Gastric cancer | ||
| SIM: Severe intestinal metaplasia | ||
| WIM: Wild intestinal metaplasia | ||
| Liver | 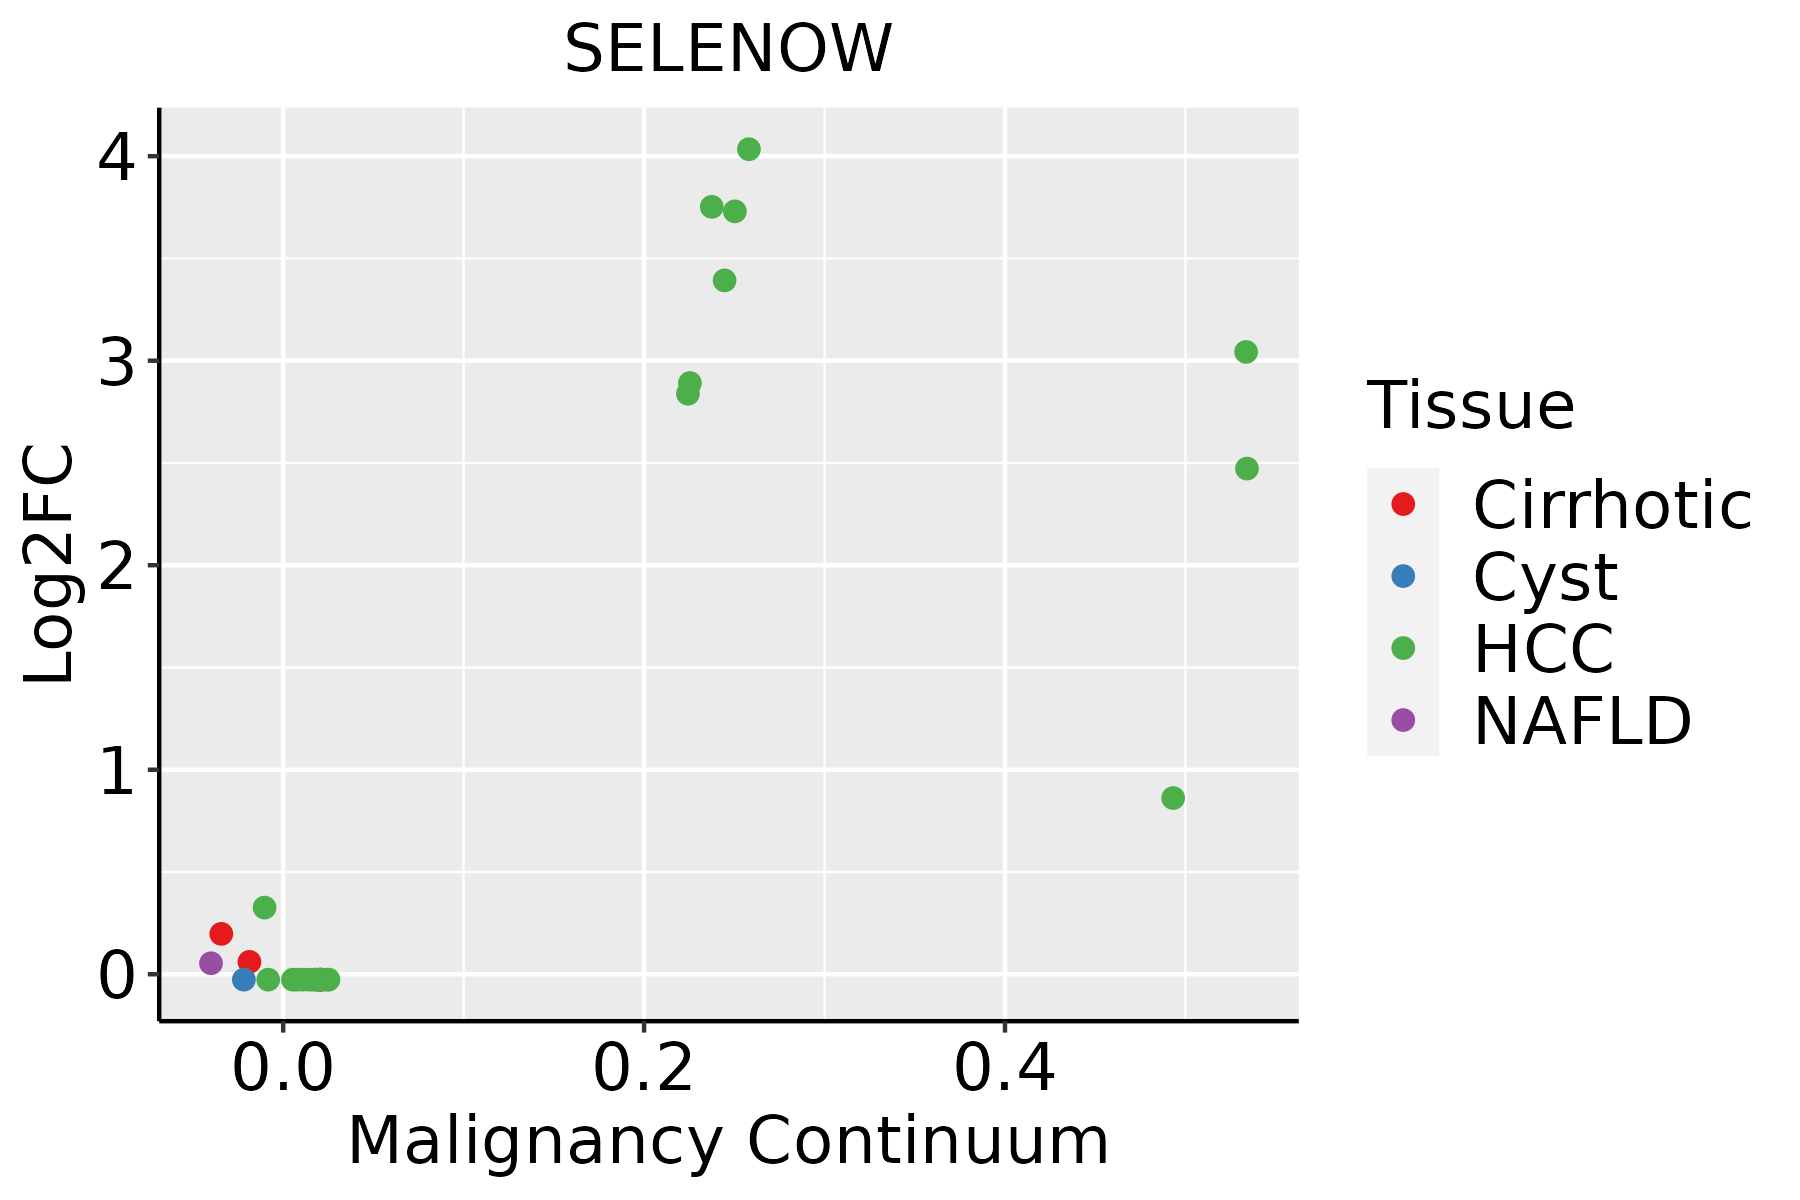 | HCC: Hepatocellular carcinoma |
| NAFLD: Non-alcoholic fatty liver disease | ||
| Lung | 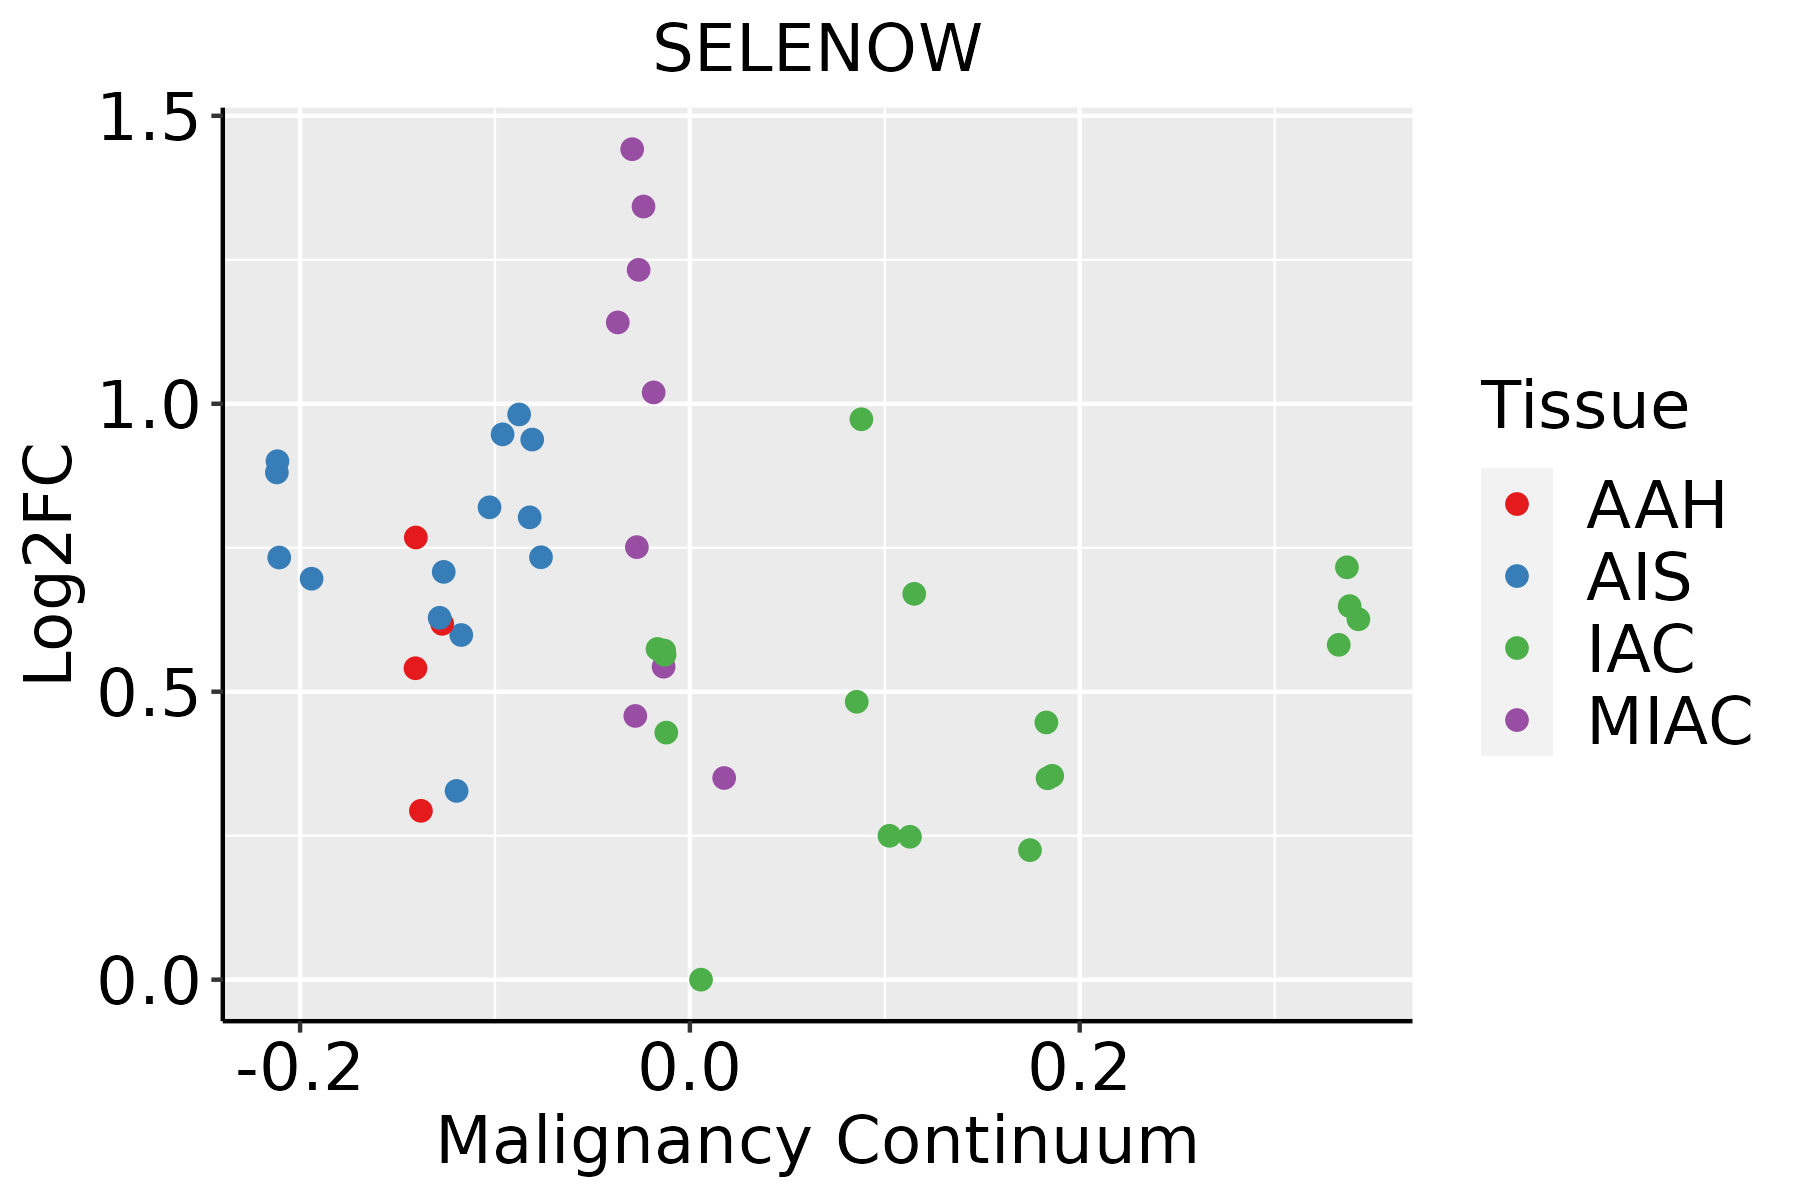 | AAH: Atypical adenomatous hyperplasia |
| AIS: Adenocarcinoma in situ | ||
| IAC: Invasive lung adenocarcinoma | ||
| MIA: Minimally invasive adenocarcinoma | ||
| Oral Cavity |  | EOLP: Erosive Oral lichen planus |
| LP: leukoplakia | ||
| NEOLP: Non-erosive oral lichen planus | ||
| OSCC: Oral squamous cell carcinoma | ||
| Prostate | 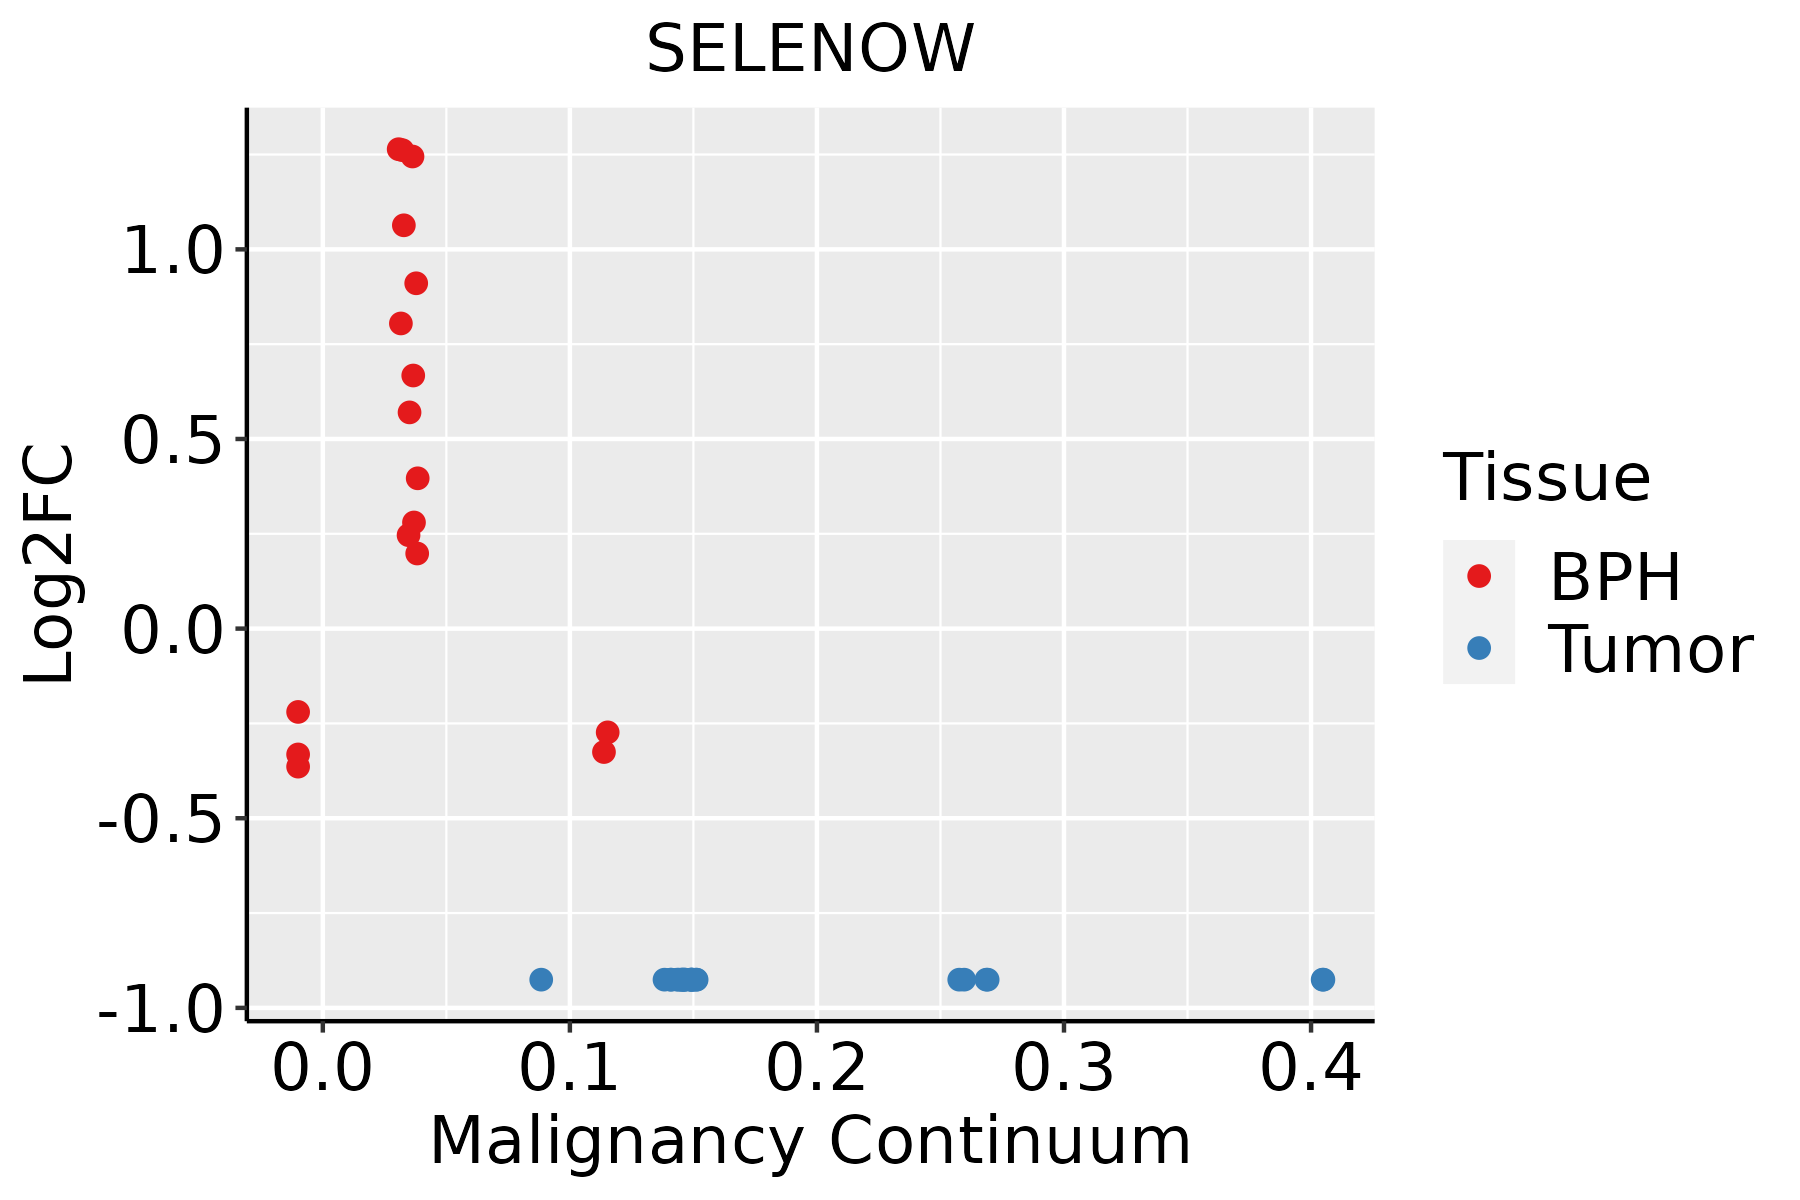 | BPH: Benign Prostatic Hyperplasia |
| Skin | 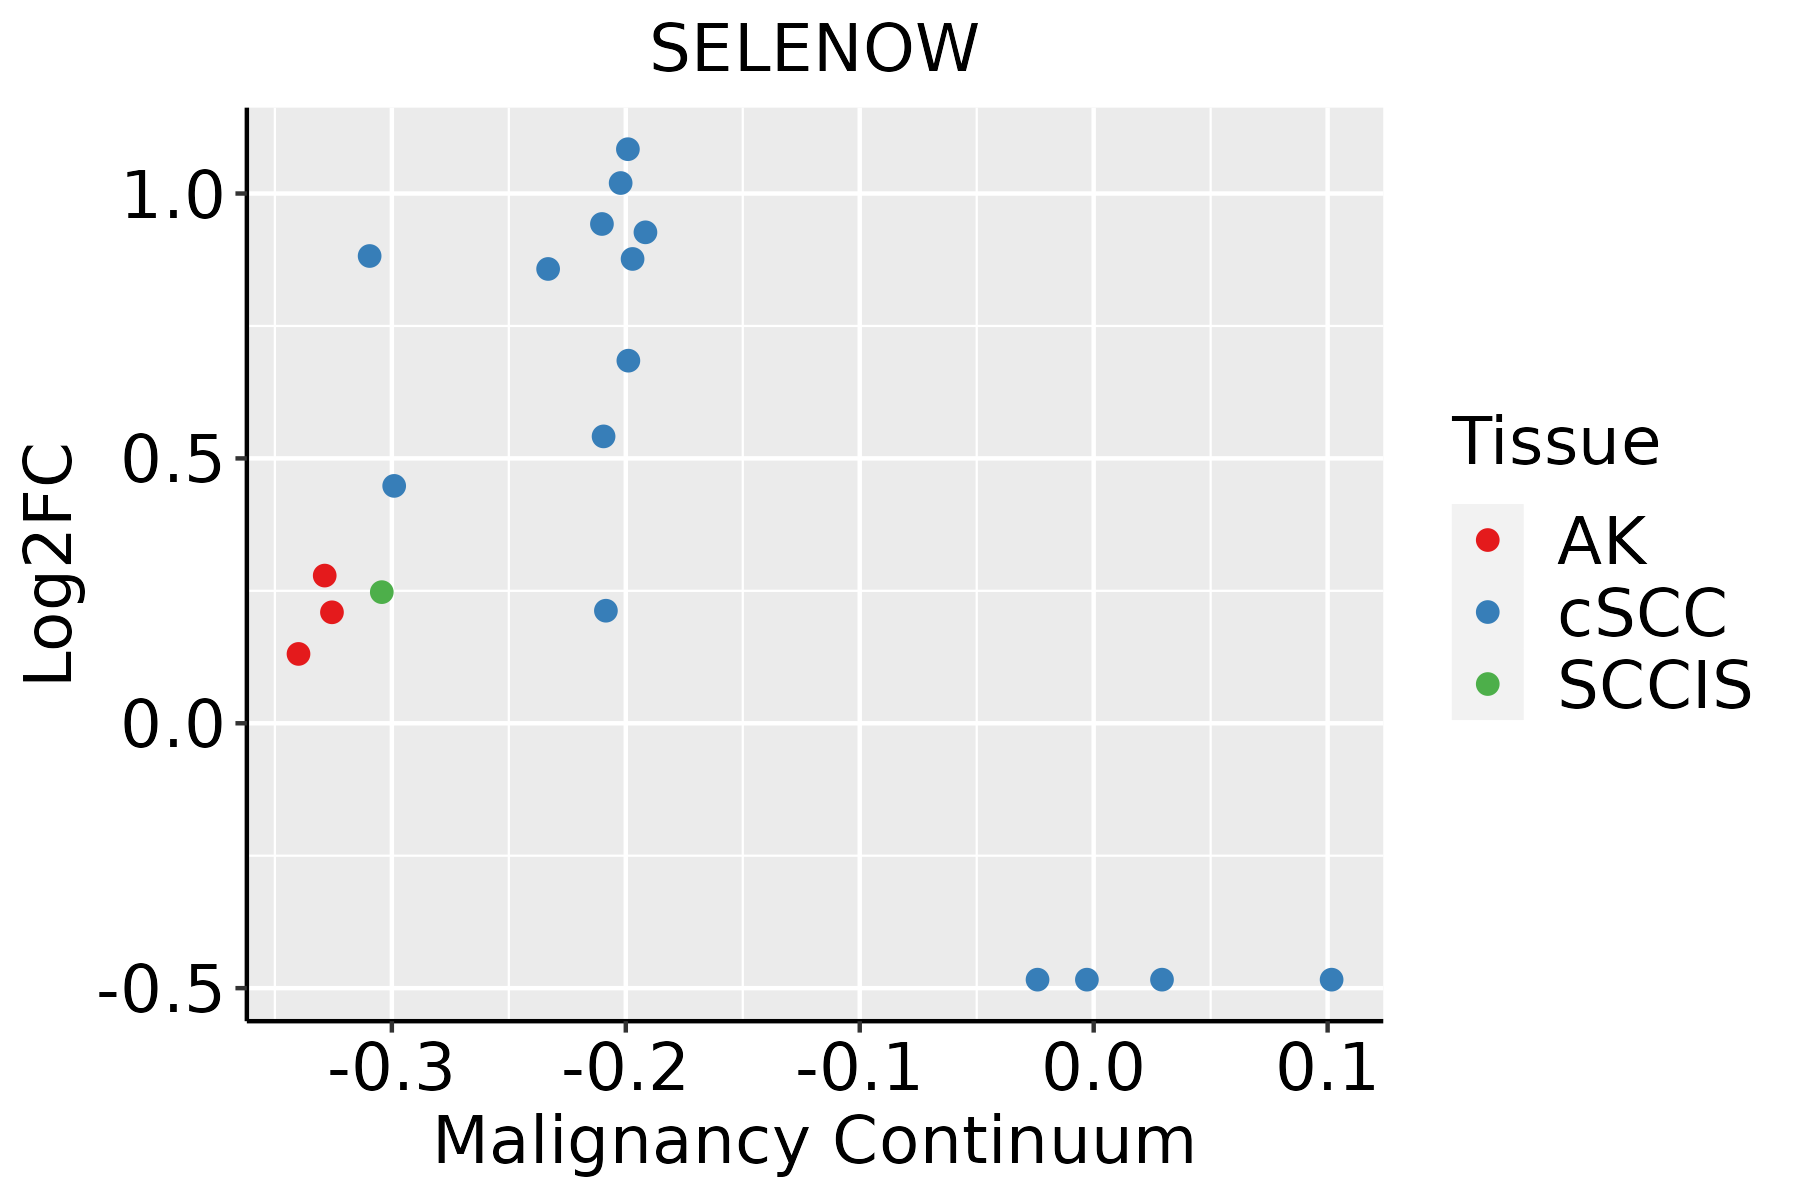 | AK: Actinic keratosis |
| cSCC: Cutaneous squamous cell carcinoma | ||
| SCCIS:squamous cell carcinoma in situ | ||
| Thyroid |  | ATC: Anaplastic thyroid cancer |
| HT: Hashimoto's thyroiditis | ||
| PTC: Papillary thyroid cancer |
| ∗log2FC in expression of this searched gene in stem-like cells from each diseased tissue sample relative to stem-like cells in normal samples in each tissue plotted against the malignancy continuum. Samples are colored based on if they are from different disease stage. |
Top |
Malignant transformation related pathway analysis |
| Find out the enriched GO biological processes and KEGG pathways involved in transition from healthy to precancer to cancer |
| Tissue | Disease Stage | Enriched GO biological Processes |
| Colorectum | AD |  |
| Colorectum | SER |  |
| Colorectum | MSS |  |
| Colorectum | MSI-H |  |
| Colorectum | FAP |  |
| ∗Top 15 enriched GO BP terms are showed in the bar plot of each disease state in each tissue. Each row represents a significant GO biological process which is colored according to the -log10(p.adjust). |
| Page: 1 2 3 4 5 6 7 8 9 |
| GO ID | Tissue | Disease Stage | Description | Gene Ratio | Bg Ratio | pvalue | p.adjust | Count |
| GO:00988698 | Breast | Precancer | cellular oxidant detoxification | 20/1080 | 101/18723 | 1.07e-06 | 4.18e-05 | 20 |
| GO:19907488 | Breast | Precancer | cellular detoxification | 21/1080 | 116/18723 | 2.67e-06 | 8.89e-05 | 21 |
| GO:00987548 | Breast | Precancer | detoxification | 24/1080 | 152/18723 | 6.49e-06 | 1.81e-04 | 24 |
| GO:00972378 | Breast | Precancer | cellular response to toxic substance | 21/1080 | 124/18723 | 7.98e-06 | 2.17e-04 | 21 |
| GO:00096368 | Breast | Precancer | response to toxic substance | 31/1080 | 262/18723 | 1.18e-04 | 2.12e-03 | 31 |
| GO:00102693 | Breast | Precancer | response to selenium ion | 4/1080 | 11/18723 | 2.62e-03 | 2.34e-02 | 4 |
| GO:000963613 | Breast | IDC | response to toxic substance | 44/1434 | 262/18723 | 6.33e-07 | 3.00e-05 | 44 |
| GO:009875413 | Breast | IDC | detoxification | 29/1434 | 152/18723 | 3.97e-06 | 1.43e-04 | 29 |
| GO:009886913 | Breast | IDC | cellular oxidant detoxification | 22/1434 | 101/18723 | 6.31e-06 | 1.98e-04 | 22 |
| GO:199074813 | Breast | IDC | cellular detoxification | 23/1434 | 116/18723 | 2.02e-05 | 4.92e-04 | 23 |
| GO:009723713 | Breast | IDC | cellular response to toxic substance | 24/1434 | 124/18723 | 2.05e-05 | 4.97e-04 | 24 |
| GO:00102691 | Breast | IDC | response to selenium ion | 6/1434 | 11/18723 | 6.59e-05 | 1.35e-03 | 6 |
| GO:000963623 | Breast | DCIS | response to toxic substance | 42/1390 | 262/18723 | 1.76e-06 | 6.56e-05 | 42 |
| GO:009875423 | Breast | DCIS | detoxification | 29/1390 | 152/18723 | 2.15e-06 | 7.79e-05 | 29 |
| GO:009886923 | Breast | DCIS | cellular oxidant detoxification | 22/1390 | 101/18723 | 3.82e-06 | 1.16e-04 | 22 |
| GO:199074823 | Breast | DCIS | cellular detoxification | 23/1390 | 116/18723 | 1.22e-05 | 3.12e-04 | 23 |
| GO:009723723 | Breast | DCIS | cellular response to toxic substance | 24/1390 | 124/18723 | 1.22e-05 | 3.12e-04 | 24 |
| GO:00102692 | Breast | DCIS | response to selenium ion | 6/1390 | 11/18723 | 5.53e-05 | 1.12e-03 | 6 |
| GO:00988699 | Cervix | CC | cellular oxidant detoxification | 30/2311 | 101/18723 | 2.72e-06 | 7.93e-05 | 30 |
| GO:19907489 | Cervix | CC | cellular detoxification | 30/2311 | 116/18723 | 5.34e-05 | 7.94e-04 | 30 |
| Page: 1 2 3 4 5 6 7 |
| Pathway ID | Tissue | Disease Stage | Description | Gene Ratio | Bg Ratio | pvalue | p.adjust | qvalue | Count |
| Page: 1 |
Top |
Cell-cell communication analysis |
| Identification of potential cell-cell interactions between two cell types and their ligand-receptor pairs for different disease states |
| Ligand | Receptor | LRpair | Pathway | Tissue | Disease Stage |
| Page: 1 |
Top |
Single-cell gene regulatory network inference analysis |
| Find out the significant the regulons (TFs) and the target genes of each regulon across cell types for different disease states |
| TF | Cell Type | Tissue | Disease Stage | Target Gene | RSS | Regulon Activity |
| ∗The dot plots of a searched regulon are shown for all cell subpopulations in each disease state of each tissue based on the regulon specific score inferred using pySCENIC and by calculating the average expression. |
| Page: 1 |
Top |
Somatic mutation of malignant transformation related genes |
| Annotation of somatic variants for genes involved in malignant transformation |
| Hugo Symbol | Variant Class | Variant Classification | dbSNP RS | HGVSc | HGVSp | HGVSp Short | SWISSPROT | BIOTYPE | SIFT | PolyPhen | Tumor Sample Barcode | Tissue | Histology | Sex | Age | Stage | Therapy Types | Drugs | Outcome |
| SELENOW | SNV | Missense_Mutation | novel | c.210A>C | p.Glu70Asp | p.E70D | P63302 | protein_coding | tolerated(0.48) | possibly_damaging(0.787) | TCGA-F5-6814-01 | Colorectum | rectum adenocarcinoma | Male | <65 | I/II | Unknown | Unknown | SD |
| SELENOW | SNV | Missense_Mutation | c.235G>A | p.Ala79Thr | p.A79T | P63302 | protein_coding | tolerated(0.16) | possibly_damaging(0.893) | TCGA-AJ-A3BH-01 | Endometrium | uterine corpus endometrioid carcinoma | Female | Unknown | I/II | Unknown | Unknown | SD | |
| SELENOW | SNV | Missense_Mutation | novel | c.212N>T | p.Ser71Ile | p.S71I | P63302 | protein_coding | tolerated(0.06) | benign(0.006) | TCGA-AX-A0J1-01 | Endometrium | uterine corpus endometrioid carcinoma | Female | >=65 | I/II | Unknown | Unknown | SD |
| SELENOW | SNV | Missense_Mutation | novel | c.72G>T | p.Lys24Asn | p.K24N | P63302 | protein_coding | tolerated(0.11) | possibly_damaging(0.463) | TCGA-BS-A0UF-01 | Endometrium | uterine corpus endometrioid carcinoma | Female | >=65 | I/II | Unknown | Unknown | SD |
| SELENOW | SNV | Missense_Mutation | novel | c.251N>C | p.Leu84Ser | p.L84S | P63302 | protein_coding | deleterious(0) | benign(0.146) | TCGA-EO-A3AU-01 | Endometrium | uterine corpus endometrioid carcinoma | Female | >=65 | I/II | Unknown | Unknown | PD |
| SELENOW | SNV | Missense_Mutation | novel | c.157N>T | p.Ala53Ser | p.A53S | P63302 | protein_coding | tolerated(0.56) | benign(0.303) | TCGA-VQ-A8DT-01 | Stomach | stomach adenocarcinoma | Male | <65 | III/IV | Chemotherapy | fluorouracil | PD |
| Page: 1 |
Top |
Related drugs of malignant transformation related genes |
| Identification of chemicals and drugs interact with genes involved in malignant transfromation |
| (DGIdb 4.0) |
| Entrez ID | Symbol | Category | Interaction Types | Drug Claim Name | Drug Name | PMIDs |
| Page: 1 |

Copyright 2023-Present -The University of Texas Health Science Center at Houston |