| Tissue | Expression Dynamics | Abbreviation |
| Breast |  | IDC: Invasive ductal carcinoma |
| DCIS: Ductal carcinoma in situ |
| Precancer(BRCA1-mut): Precancerous lesion from BRCA1 mutation carriers |
| Cervix | 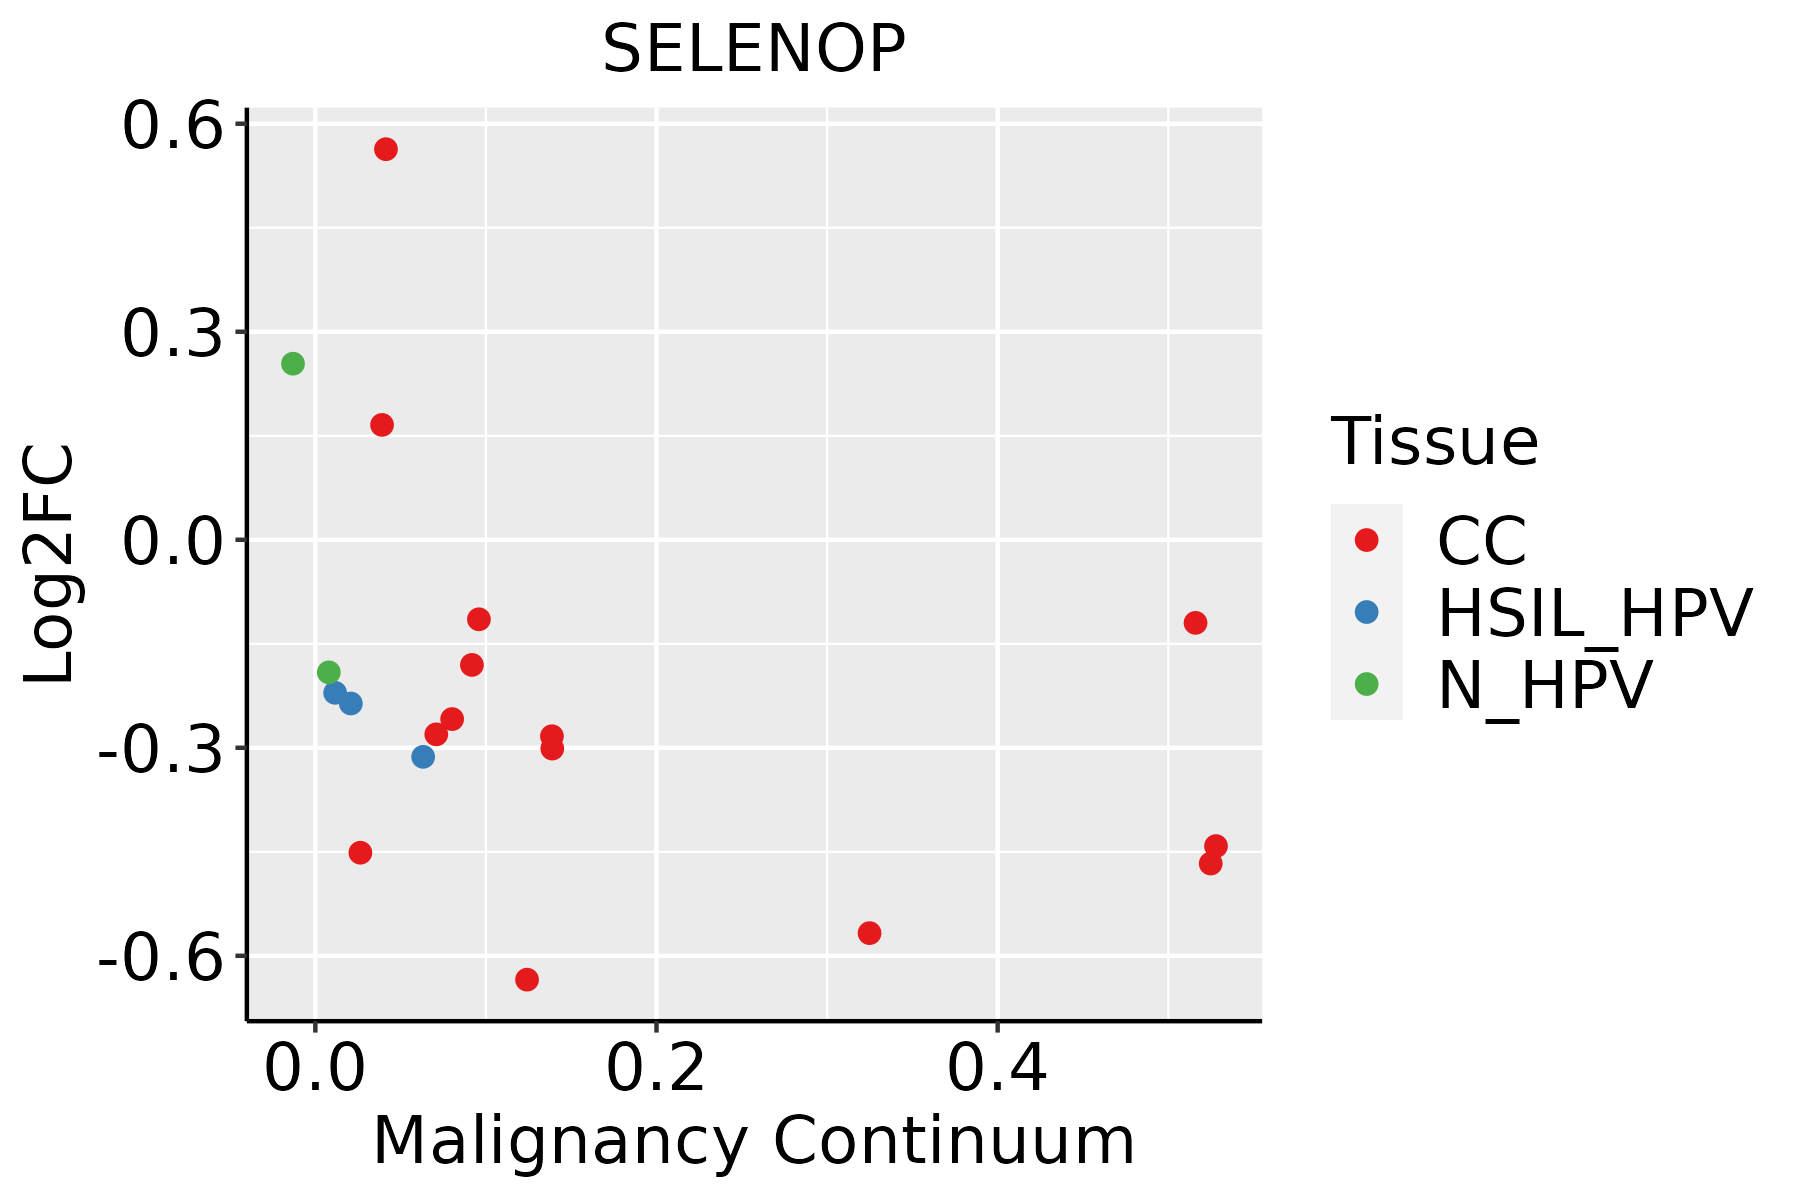 | CC: Cervix cancer |
| HSIL_HPV: HPV-infected high-grade squamous intraepithelial lesions |
| N_HPV: HPV-infected normal cervix |
| Endometrium |  | AEH: Atypical endometrial hyperplasia |
| EEC: Endometrioid Cancer |
| Esophagus | 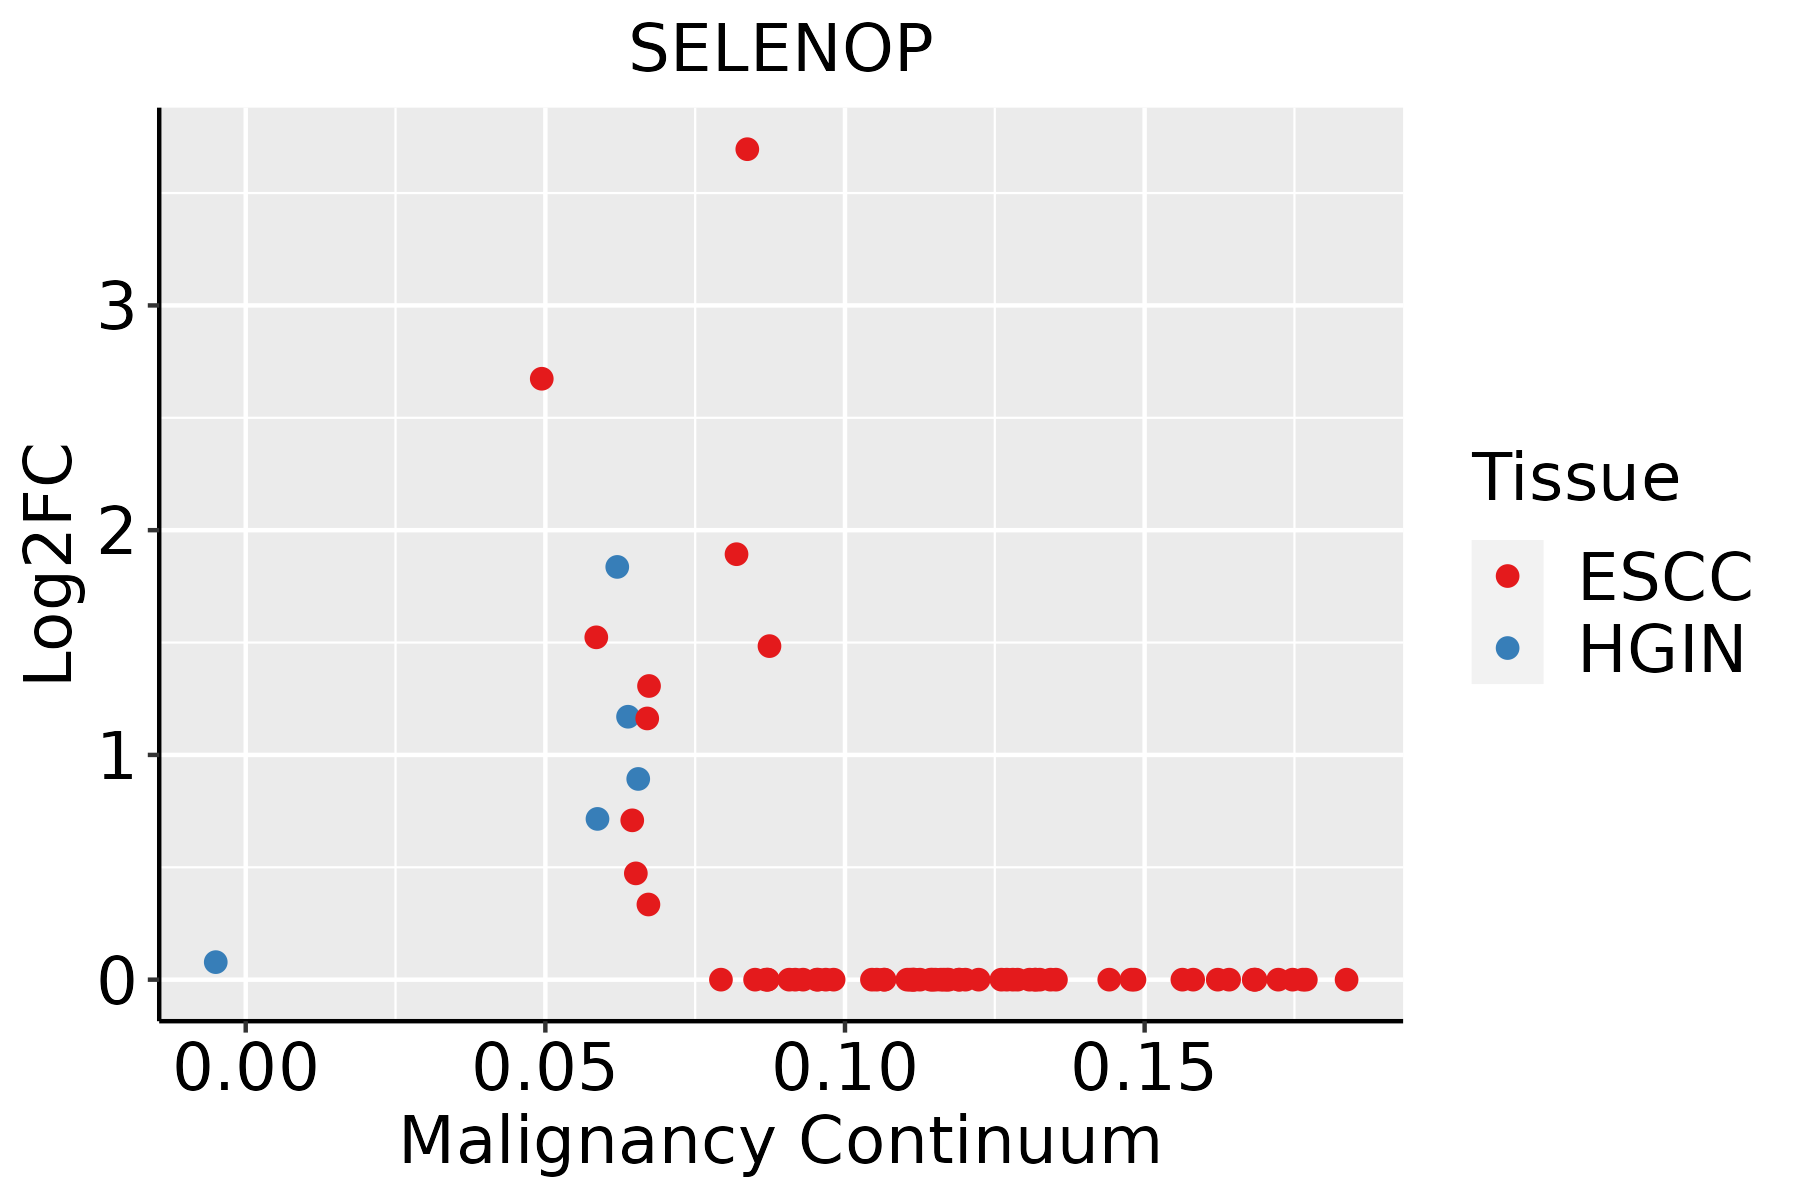 | ESCC: Esophageal squamous cell carcinoma |
| HGIN: High-grade intraepithelial neoplasias |
| LGIN: Low-grade intraepithelial neoplasias |
| GC |  | CAG: Chronic atrophic gastritis |
| CAG with IM: Chronic atrophic gastritis with intestinal metaplasia |
| CSG: Chronic superficial gastritis |
| GC: Gastric cancer |
| SIM: Severe intestinal metaplasia |
| WIM: Wild intestinal metaplasia |
| Liver | 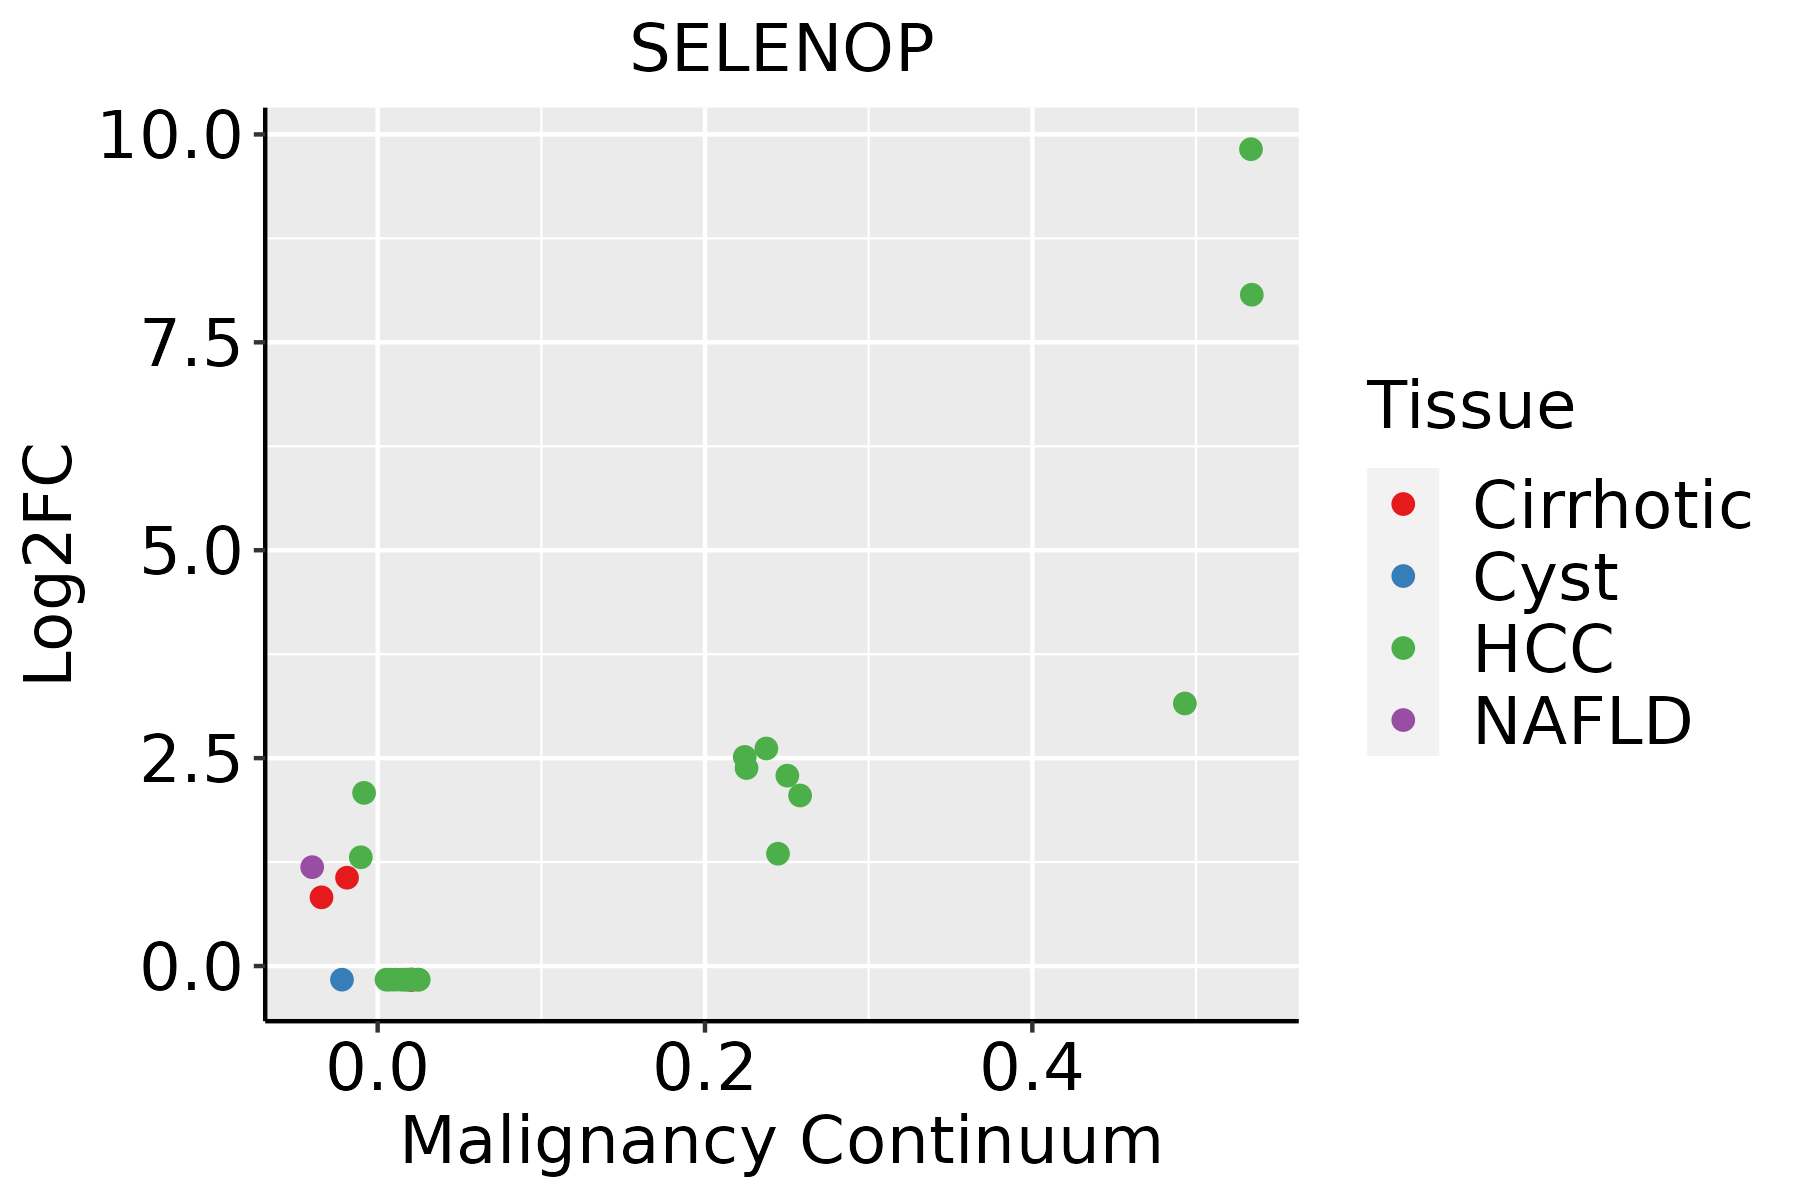 | HCC: Hepatocellular carcinoma |
| NAFLD: Non-alcoholic fatty liver disease |
| Lung | 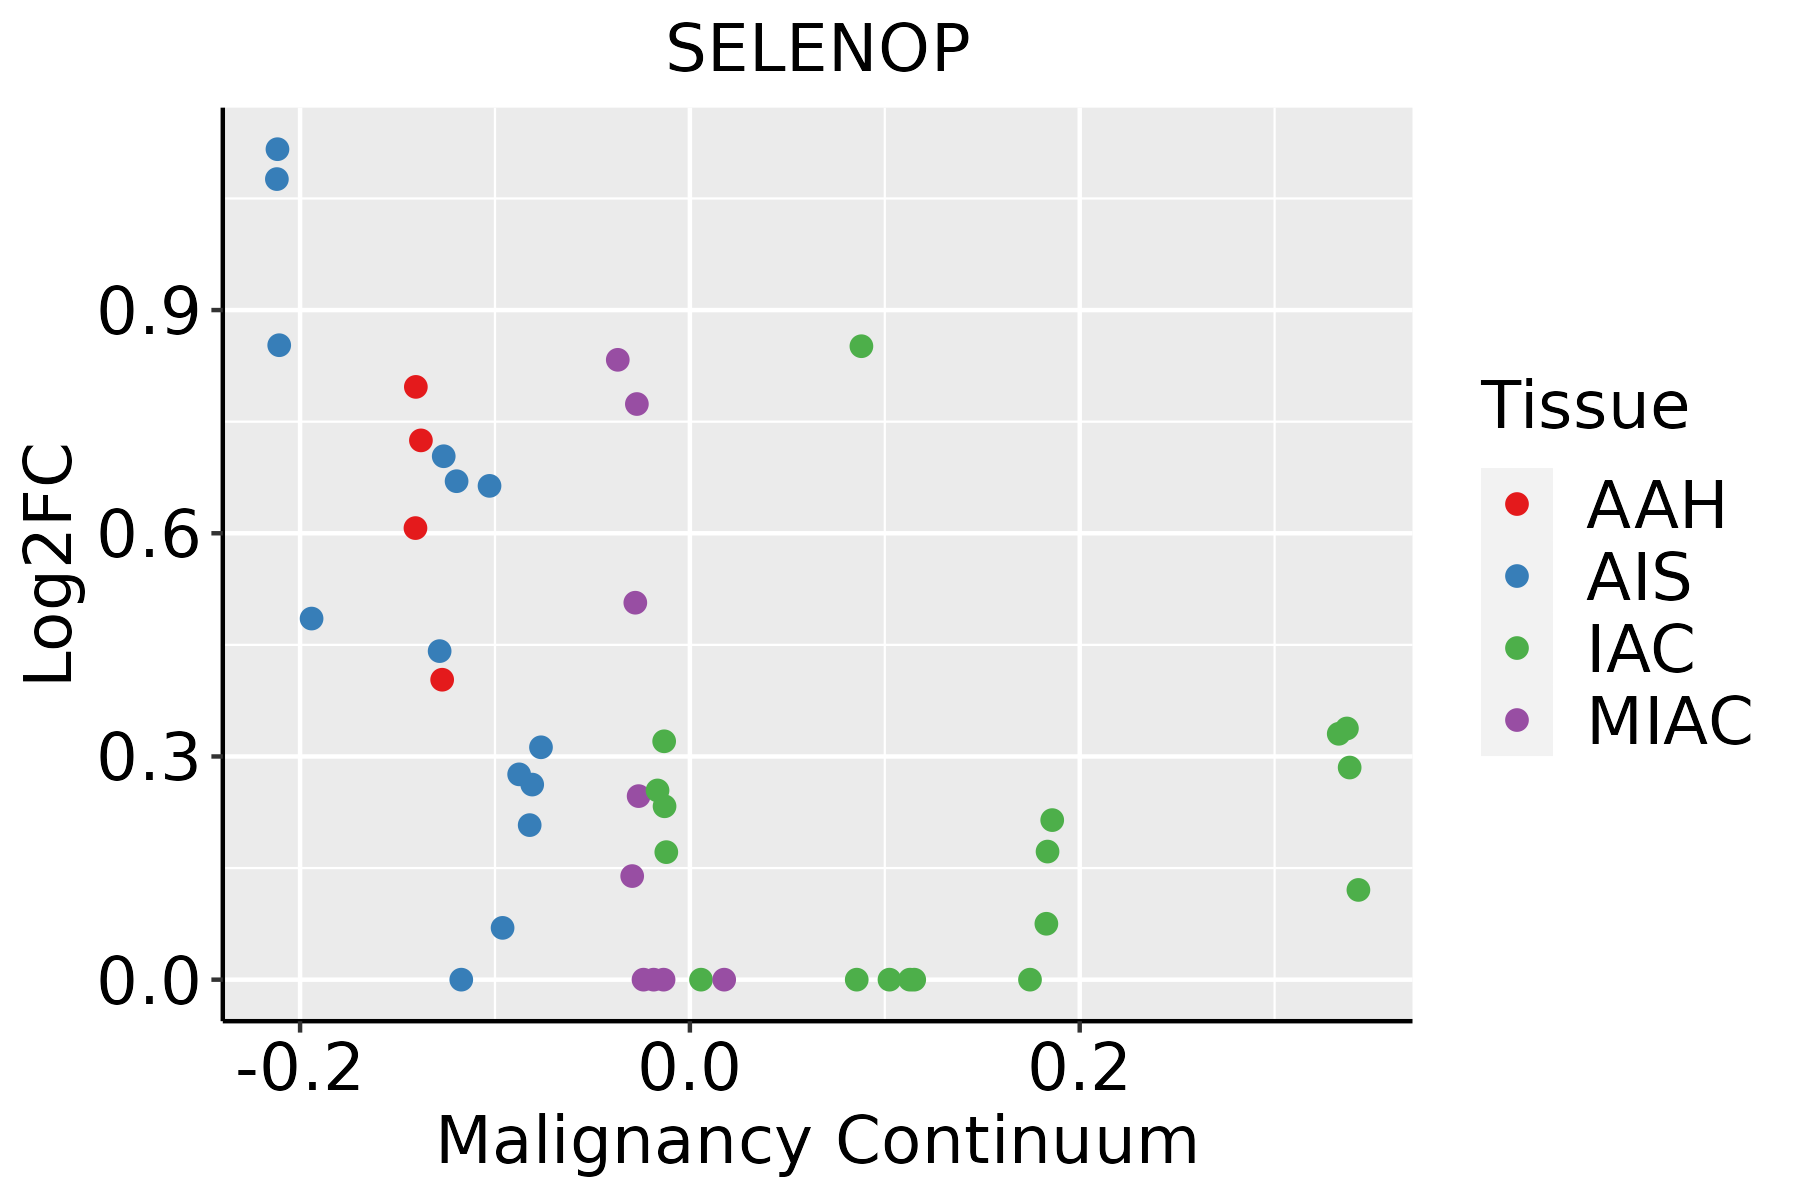 | AAH: Atypical adenomatous hyperplasia |
| AIS: Adenocarcinoma in situ |
| IAC: Invasive lung adenocarcinoma |
| MIA: Minimally invasive adenocarcinoma |
| Prostate | 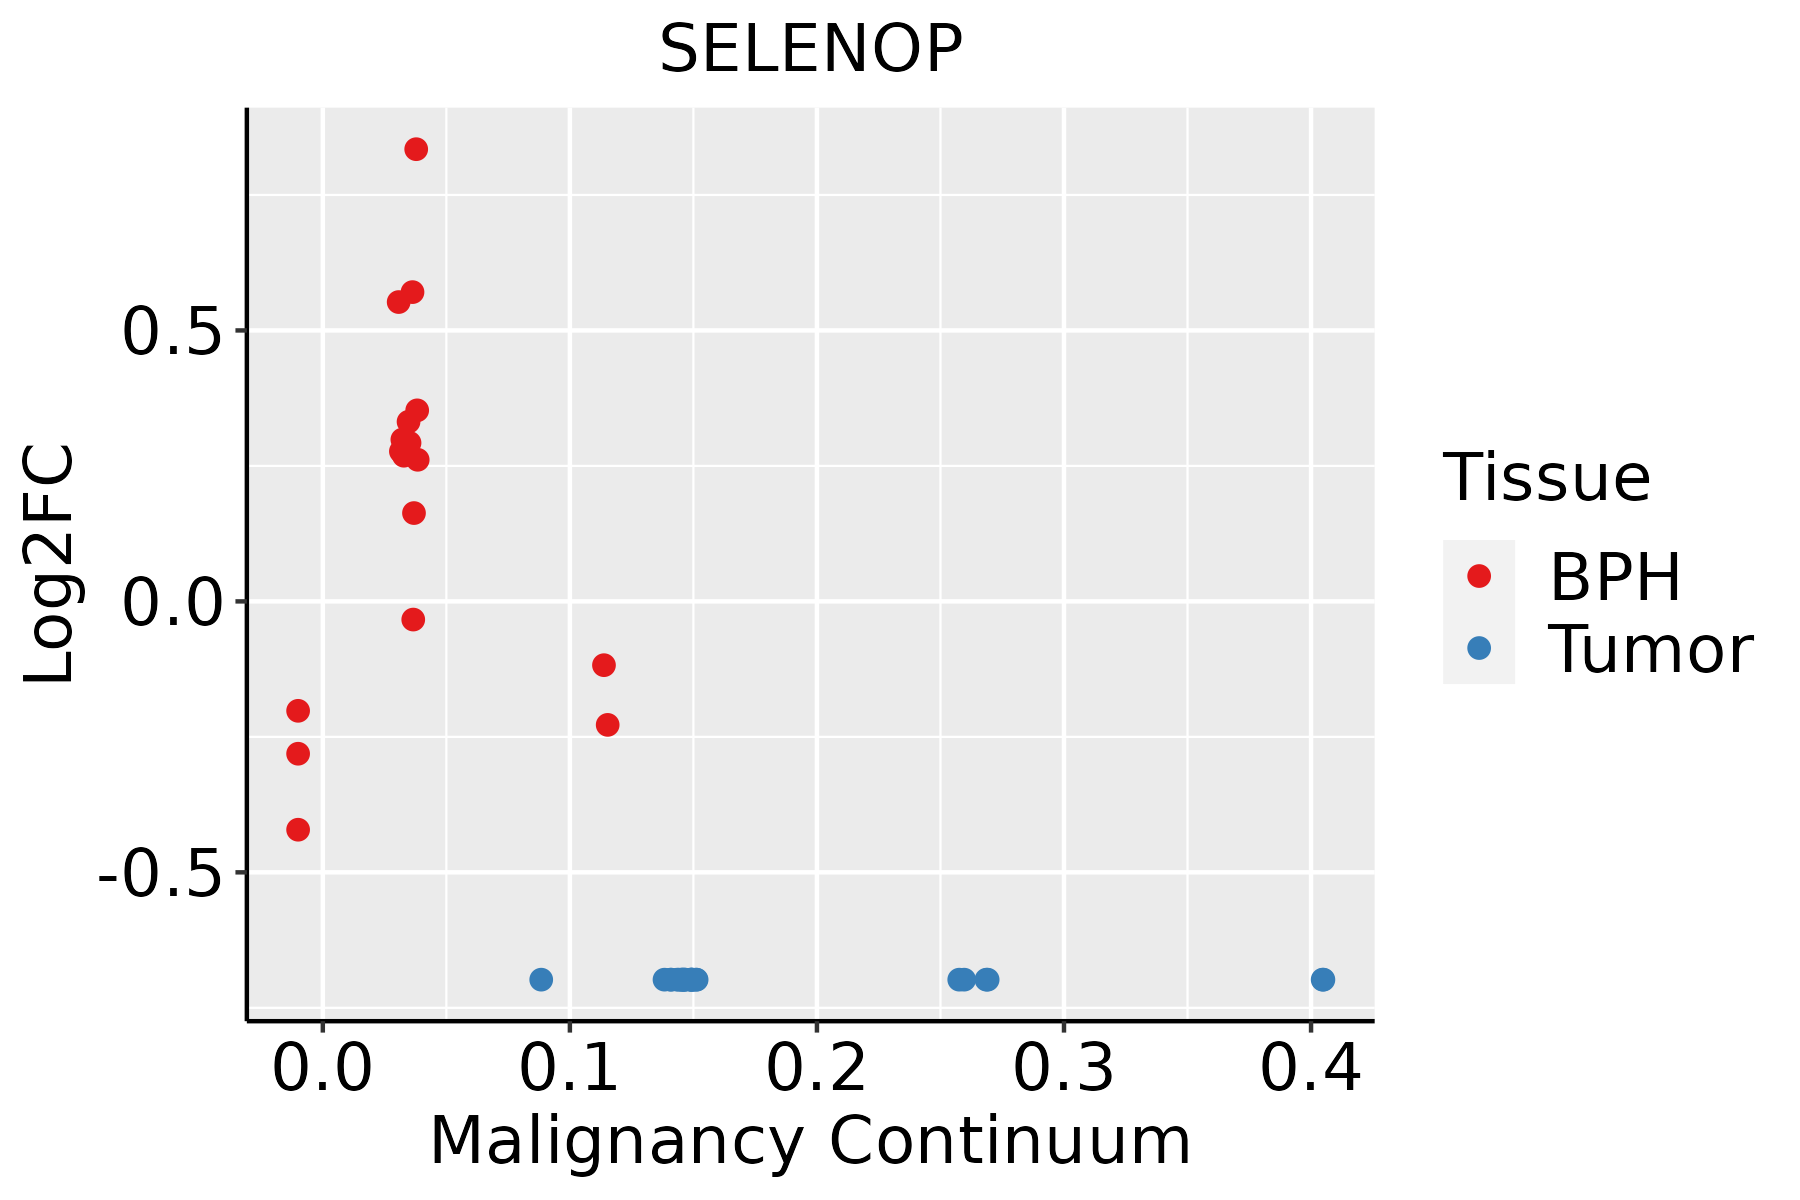 | BPH: Benign Prostatic Hyperplasia |
| Skin | 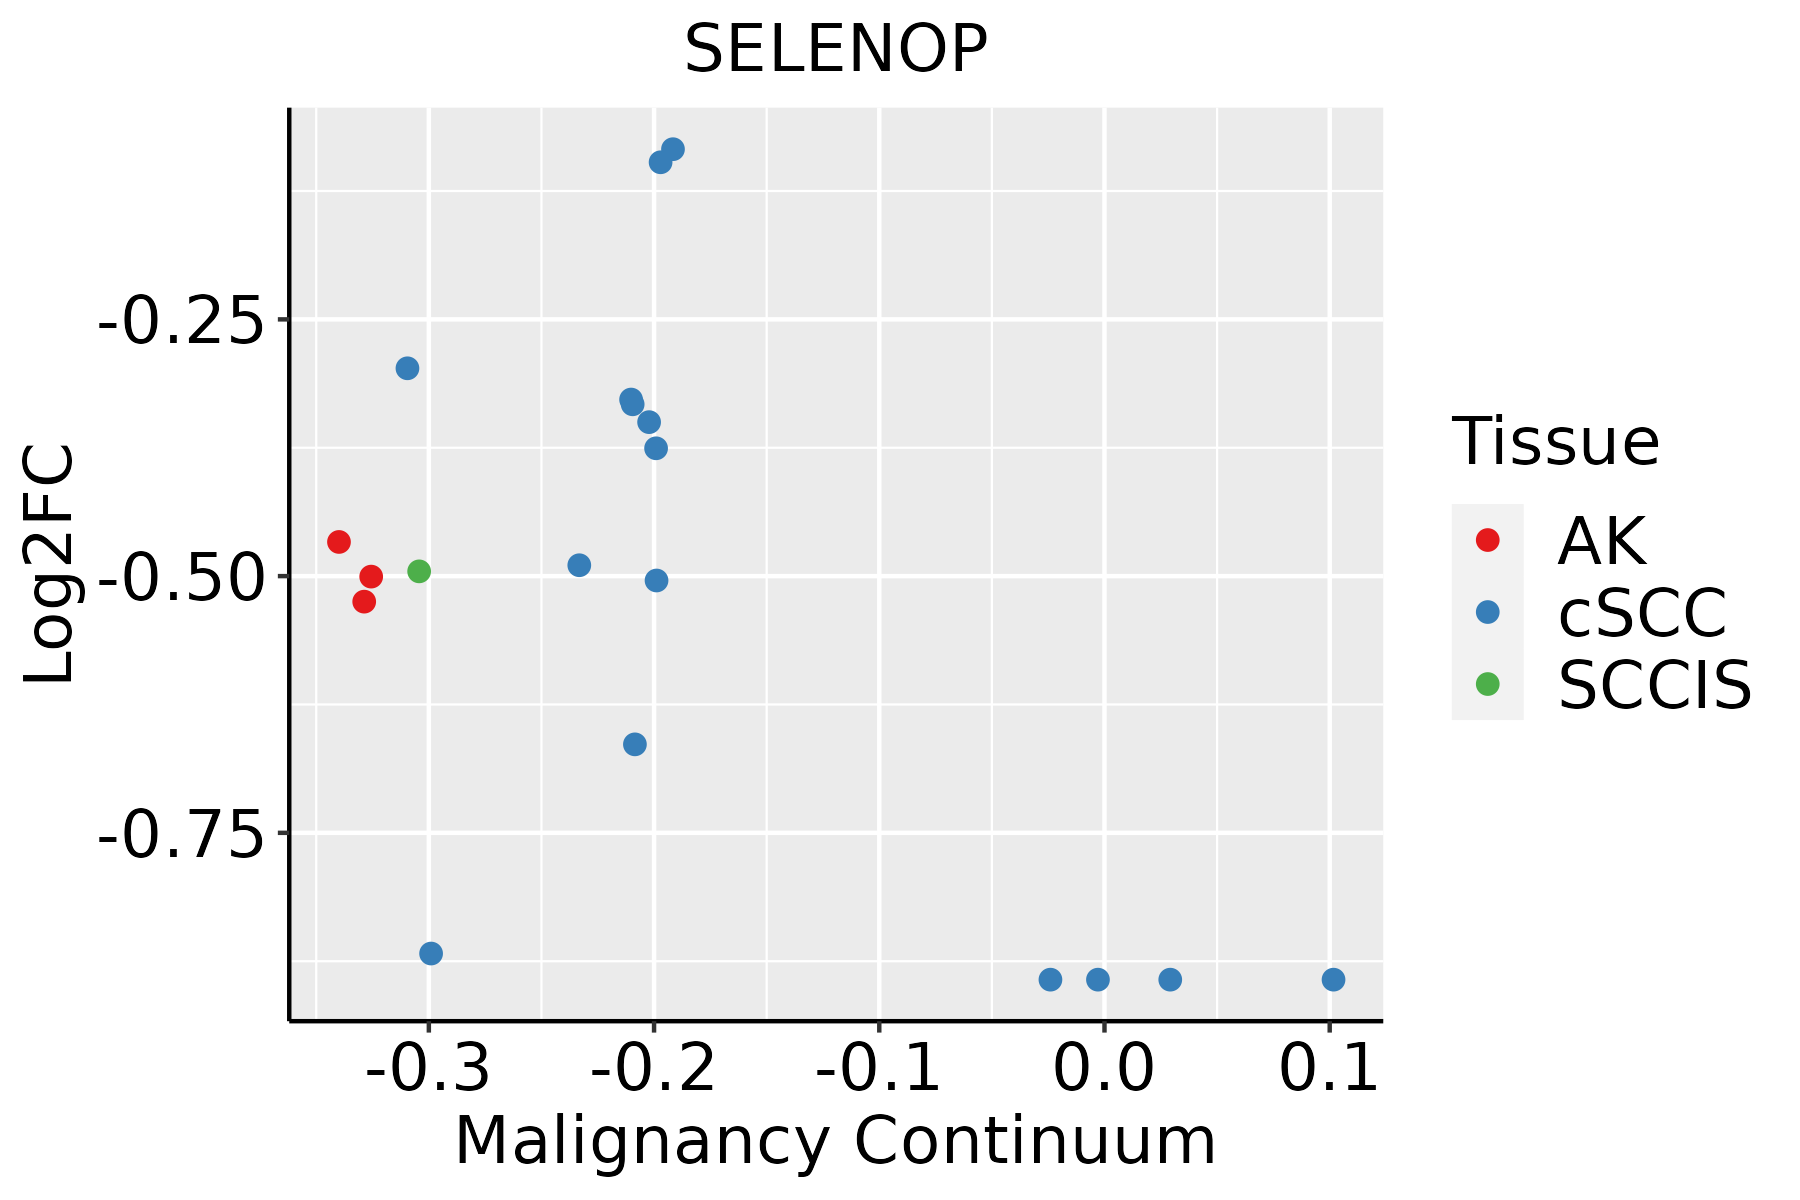 | AK: Actinic keratosis |
| cSCC: Cutaneous squamous cell carcinoma |
| SCCIS:squamous cell carcinoma in situ |
| Thyroid | 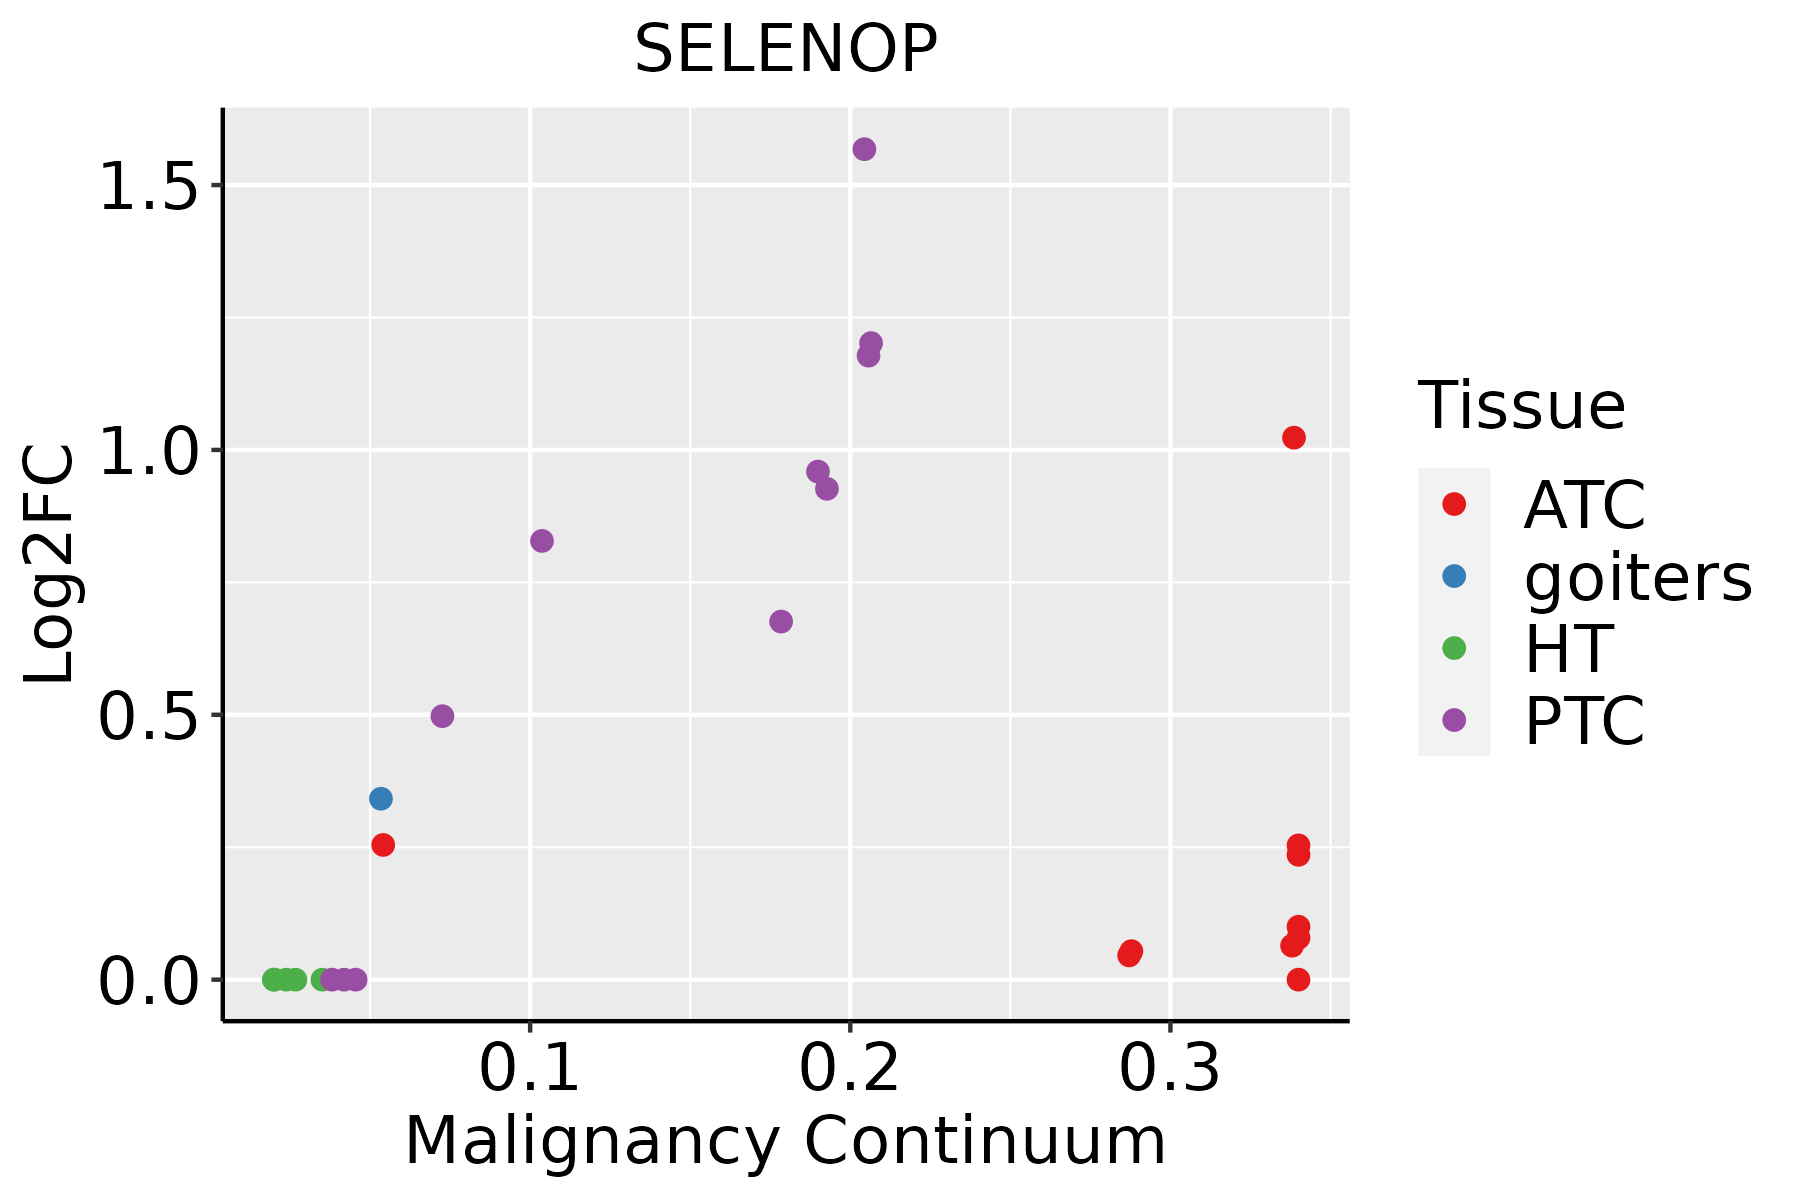 | ATC: Anaplastic thyroid cancer |
| HT: Hashimoto's thyroiditis |
| PTC: Papillary thyroid cancer |
| GO ID | Tissue | Disease Stage | Description | Gene Ratio | Bg Ratio | pvalue | p.adjust | Count |
| GO:00069799 | Breast | Precancer | response to oxidative stress | 70/1080 | 446/18723 | 1.59e-14 | 4.26e-12 | 70 |
| GO:000697914 | Breast | IDC | response to oxidative stress | 83/1434 | 446/18723 | 2.36e-14 | 7.06e-12 | 83 |
| GO:000697924 | Breast | DCIS | response to oxidative stress | 82/1390 | 446/18723 | 1.22e-14 | 3.85e-12 | 82 |
| GO:000697910 | Cervix | CC | response to oxidative stress | 102/2311 | 446/18723 | 2.99e-10 | 4.36e-08 | 102 |
| GO:00097915 | Cervix | CC | post-embryonic development | 20/2311 | 80/18723 | 1.40e-03 | 1.10e-02 | 20 |
| GO:000697915 | Cervix | HSIL_HPV | response to oxidative stress | 48/737 | 446/18723 | 2.76e-10 | 7.02e-08 | 48 |
| GO:000697916 | Endometrium | AEH | response to oxidative stress | 93/2100 | 446/18723 | 1.94e-09 | 1.64e-07 | 93 |
| GO:000697917 | Endometrium | EEC | response to oxidative stress | 99/2168 | 446/18723 | 9.02e-11 | 1.13e-08 | 99 |
| GO:00097916 | Endometrium | EEC | post-embryonic development | 17/2168 | 80/18723 | 9.23e-03 | 4.95e-02 | 17 |
| GO:000697927 | Esophagus | HGIN | response to oxidative stress | 107/2587 | 446/18723 | 3.91e-09 | 2.76e-07 | 107 |
| GO:0006979111 | Esophagus | ESCC | response to oxidative stress | 303/8552 | 446/18723 | 7.15e-22 | 1.30e-19 | 303 |
| GO:00097919 | Esophagus | ESCC | post-embryonic development | 56/8552 | 80/18723 | 9.08e-06 | 8.71e-05 | 56 |
| GO:00069797 | Liver | NAFLD | response to oxidative stress | 78/1882 | 446/18723 | 7.85e-07 | 4.29e-05 | 78 |
| GO:000697912 | Liver | Cirrhotic | response to oxidative stress | 196/4634 | 446/18723 | 2.80e-19 | 5.86e-17 | 196 |
| GO:000697922 | Liver | HCC | response to oxidative stress | 281/7958 | 446/18723 | 9.75e-19 | 1.24e-16 | 281 |
| GO:00069798 | Lung | IAC | response to oxidative stress | 82/2061 | 446/18723 | 1.99e-06 | 9.18e-05 | 82 |
| GO:000697913 | Lung | AIS | response to oxidative stress | 75/1849 | 446/18723 | 2.97e-06 | 1.60e-04 | 75 |
| GO:0007626 | Lung | AIS | locomotory behavior | 31/1849 | 179/18723 | 1.39e-03 | 1.70e-02 | 31 |
| GO:000697923 | Lung | MIAC | response to oxidative stress | 43/967 | 446/18723 | 6.39e-05 | 3.12e-03 | 43 |
| GO:000697918 | Prostate | BPH | response to oxidative stress | 142/3107 | 446/18723 | 8.11e-16 | 1.36e-13 | 142 |
| Hugo Symbol | Variant Class | Variant Classification | dbSNP RS | HGVSc | HGVSp | HGVSp Short | SWISSPROT | BIOTYPE | SIFT | PolyPhen | Tumor Sample Barcode | Tissue | Histology | Sex | Age | Stage | Therapy Types | Drugs | Outcome |
| SELENOP | SNV | Missense_Mutation | novel | c.163C>G | p.Leu55Val | p.L55V | P49908 | protein_coding | deleterious(0) | probably_damaging(0.955) | TCGA-A7-A4SF-01 | Breast | breast invasive carcinoma | Female | <65 | I/II | Chemotherapy | carboplatin | CR |
| SELENOP | SNV | Missense_Mutation | | c.366N>G | p.Asp122Glu | p.D122E | P49908 | protein_coding | deleterious(0.01) | probably_damaging(0.976) | TCGA-AR-A1AO-01 | Breast | breast invasive carcinoma | Female | <65 | I/II | Chemotherapy | doxorubicin | SD |
| SELENOP | SNV | Missense_Mutation | | c.1036N>G | p.Arg346Gly | p.R346G | P49908 | protein_coding | deleterious_low_confidence(0) | probably_damaging(0.997) | TCGA-D8-A27F-01 | Breast | breast invasive carcinoma | Female | <65 | I/II | Chemotherapy | adriamycin+cyclophosphamide | SD |
| SELENOP | SNV | Missense_Mutation | rs769801038 | c.481N>A | p.Glu161Lys | p.E161K | P49908 | protein_coding | tolerated(0.1) | benign(0.344) | TCGA-D8-A27G-01 | Breast | breast invasive carcinoma | Female | >=65 | I/II | Unknown | Unknown | SD |
| SELENOP | SNV | Missense_Mutation | rs769801038 | c.481N>A | p.Glu161Lys | p.E161K | P49908 | protein_coding | tolerated(0.1) | benign(0.344) | TCGA-D8-A27M-01 | Breast | breast invasive carcinoma | Female | <65 | I/II | Chemotherapy | methotrexate+5 | SD |
| SELENOP | insertion | Nonsense_Mutation | novel | c.625_626insTTTTGTAAATCTTGTAA | p.His209LeufsTer? | p.H209Lfs*? | P49908 | protein_coding | | | TCGA-AC-A3QQ-01 | Breast | breast invasive carcinoma | Female | <65 | I/II | Unknown | Unknown | SD |
| SELENOP | SNV | Missense_Mutation | rs759863312 | c.580G>A | p.Val194Met | p.V194M | P49908 | protein_coding | tolerated(0.09) | possibly_damaging(0.778) | TCGA-5M-AAT6-01 | Colorectum | colon adenocarcinoma | Female | <65 | III/IV | Unknown | Unknown | PD |
| SELENOP | SNV | Missense_Mutation | novel | c.550N>T | p.Asp184Tyr | p.D184Y | P49908 | protein_coding | deleterious(0) | probably_damaging(0.909) | TCGA-AA-3510-01 | Colorectum | colon adenocarcinoma | Male | >=65 | I/II | Unknown | Unknown | SD |
| SELENOP | SNV | Missense_Mutation | rs761519480 | c.599C>T | p.Thr200Ile | p.T200I | P49908 | protein_coding | tolerated(0.2) | benign(0.003) | TCGA-AA-A02J-01 | Colorectum | colon adenocarcinoma | Female | >=65 | III/IV | Unknown | Unknown | PD |
| SELENOP | SNV | Missense_Mutation | rs570817380 | c.840A>T | p.Arg280Ser | p.R280S | P49908 | protein_coding | tolerated_low_confidence(0.16) | benign(0.007) | TCGA-CK-4951-01 | Colorectum | colon adenocarcinoma | Female | >=65 | I/II | Unknown | Unknown | PD |


