
|
|||||
|
 | |
| |
| |
| |
| |
| |
|
Gene: SELENOO |
Gene summary for SELENOO |
| Gene information | Species | Human | Gene symbol | SELENOO | Gene ID | 83642 |
| Gene name | selenoprotein O | |
| Gene Alias | SELO | |
| Cytomap | 22q13.33 | |
| Gene Type | protein-coding | GO ID | GO:0006464 | UniProtAcc | Q9BVL4 |
Top |
Malignant transformation analysis |
| Identification of the aberrant gene expression in precancerous and cancerous lesions by comparing the gene expression of stem-like cells in diseased tissues with normal stem cells |
| Entrez ID | Symbol | Replicates | Species | Organ | Tissue | Adj P-value | Log2FC | Malignancy |
| 83642 | SELENOO | NAFLD1 | Human | Liver | NAFLD | 8.77e-12 | 8.30e-01 | -0.04 |
| 83642 | SELENOO | S43 | Human | Liver | Cirrhotic | 1.90e-03 | -1.16e-01 | -0.0187 |
| 83642 | SELENOO | HCC1_Meng | Human | Liver | HCC | 1.07e-06 | -1.56e-01 | 0.0246 |
| 83642 | SELENOO | HCC2_Meng | Human | Liver | HCC | 2.30e-06 | -1.56e-01 | 0.0107 |
| 83642 | SELENOO | cirrhotic1 | Human | Liver | Cirrhotic | 1.07e-06 | -1.56e-01 | 0.0202 |
| 83642 | SELENOO | cirrhotic2 | Human | Liver | Cirrhotic | 2.30e-06 | -1.56e-01 | 0.0201 |
| 83642 | SELENOO | cirrhotic3 | Human | Liver | Cirrhotic | 5.80e-03 | -1.56e-01 | 0.0215 |
| 83642 | SELENOO | HCC1 | Human | Liver | HCC | 8.34e-12 | 3.42e+00 | 0.5336 |
| 83642 | SELENOO | HCC2 | Human | Liver | HCC | 2.98e-07 | 3.61e+00 | 0.5341 |
| 83642 | SELENOO | Pt13.a | Human | Liver | HCC | 2.30e-06 | -1.56e-01 | 0.021 |
| 83642 | SELENOO | Pt13.b | Human | Liver | HCC | 3.53e-02 | -1.56e-01 | 0.0251 |
| 83642 | SELENOO | Pt14.d | Human | Liver | HCC | 1.07e-06 | -1.56e-01 | 0.0143 |
| 83642 | SELENOO | S014 | Human | Liver | HCC | 1.84e-07 | 4.17e-01 | 0.2254 |
| 83642 | SELENOO | S015 | Human | Liver | HCC | 5.15e-06 | 4.54e-01 | 0.2375 |
| 83642 | SELENOO | S016 | Human | Liver | HCC | 4.83e-06 | 3.80e-01 | 0.2243 |
| Page: 1 |
| Tissue | Expression Dynamics | Abbreviation |
| Liver | 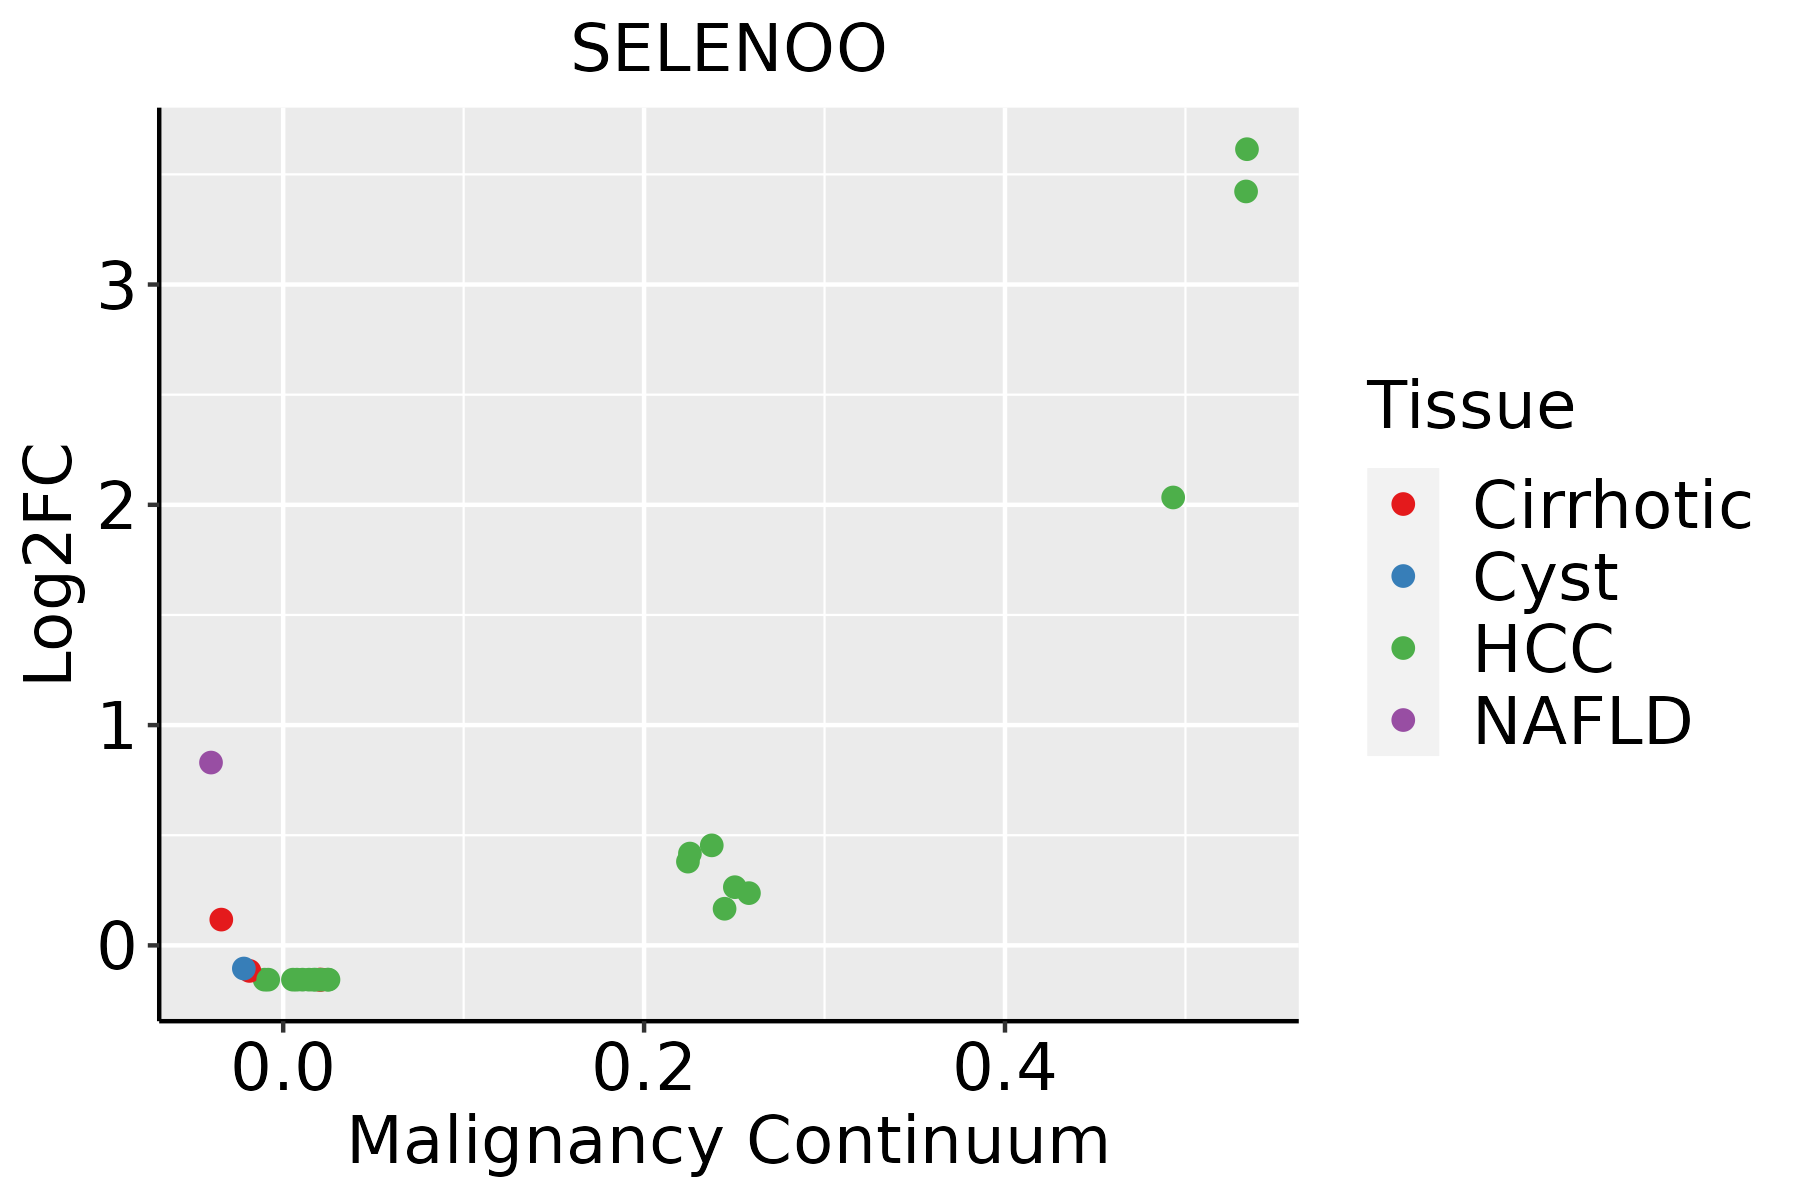 | HCC: Hepatocellular carcinoma |
| NAFLD: Non-alcoholic fatty liver disease |
| ∗log2FC in expression of this searched gene in stem-like cells from each diseased tissue sample relative to stem-like cells in normal samples in each tissue plotted against the malignancy continuum. Samples are colored based on if they are from different disease stage. |
Top |
Malignant transformation related pathway analysis |
| Find out the enriched GO biological processes and KEGG pathways involved in transition from healthy to precancer to cancer |
| Tissue | Disease Stage | Enriched GO biological Processes |
| Colorectum | AD |  |
| Colorectum | SER |  |
| Colorectum | MSS |  |
| Colorectum | MSI-H |  |
| Colorectum | FAP |  |
| ∗Top 15 enriched GO BP terms are showed in the bar plot of each disease state in each tissue. Each row represents a significant GO biological process which is colored according to the -log10(p.adjust). |
| Page: 1 2 3 4 5 6 7 8 9 |
| GO ID | Tissue | Disease Stage | Description | Gene Ratio | Bg Ratio | pvalue | p.adjust | Count |
| Page: 1 |
| Pathway ID | Tissue | Disease Stage | Description | Gene Ratio | Bg Ratio | pvalue | p.adjust | qvalue | Count |
| Page: 1 |
Top |
Cell-cell communication analysis |
| Identification of potential cell-cell interactions between two cell types and their ligand-receptor pairs for different disease states |
| Ligand | Receptor | LRpair | Pathway | Tissue | Disease Stage |
| Page: 1 |
Top |
Single-cell gene regulatory network inference analysis |
| Find out the significant the regulons (TFs) and the target genes of each regulon across cell types for different disease states |
| TF | Cell Type | Tissue | Disease Stage | Target Gene | RSS | Regulon Activity |
| ∗The dot plots of a searched regulon are shown for all cell subpopulations in each disease state of each tissue based on the regulon specific score inferred using pySCENIC and by calculating the average expression. |
| Page: 1 |
Top |
Somatic mutation of malignant transformation related genes |
| Annotation of somatic variants for genes involved in malignant transformation |
| Hugo Symbol | Variant Class | Variant Classification | dbSNP RS | HGVSc | HGVSp | HGVSp Short | SWISSPROT | BIOTYPE | SIFT | PolyPhen | Tumor Sample Barcode | Tissue | Histology | Sex | Age | Stage | Therapy Types | Drugs | Outcome |
| SELENOO | SNV | Missense_Mutation | rs750808619 | c.1138N>A | p.Glu380Lys | p.E380K | protein_coding | tolerated(0.11) | benign(0.067) | TCGA-A2-A0CR-01 | Breast | breast invasive carcinoma | Female | <65 | I/II | Chemotherapy | adriamycin | CR | |
| SELENOO | SNV | Missense_Mutation | novel | c.1140N>T | p.Glu380Asp | p.E380D | protein_coding | tolerated(0.23) | benign(0.006) | TCGA-A2-A0YT-01 | Breast | breast invasive carcinoma | Female | <65 | III/IV | Hormone Therapy | arimidex | SD | |
| SELENOO | SNV | Missense_Mutation | c.736C>T | p.Arg246Cys | p.R246C | protein_coding | deleterious(0) | probably_damaging(1) | TCGA-BH-A0HA-01 | Breast | breast invasive carcinoma | Female | <65 | I/II | Unknown | Unknown | SD | ||
| SELENOO | deletion | Frame_Shift_Del | novel | c.1207delG | p.Glu403ArgfsTer47 | p.E403Rfs*47 | protein_coding | TCGA-D8-A27V-01 | Breast | breast invasive carcinoma | Female | <65 | I/II | Hormone Therapy | tamoxiphen | SD | |||
| SELENOO | SNV | Missense_Mutation | rs201408834 | c.658N>A | p.Val220Ile | p.V220I | protein_coding | tolerated(0.2) | benign(0.416) | TCGA-MA-AA3X-01 | Cervix | cervical & endocervical cancer | Female | <65 | III/IV | Chemotherapy | cisplatin | CR | |
| SELENOO | SNV | Missense_Mutation | rs540758475 | c.1843N>A | p.Glu615Lys | p.E615K | protein_coding | tolerated(0.08) | benign(0.141) | TCGA-Q1-A73O-01 | Cervix | cervical & endocervical cancer | Female | <65 | I/II | Chemotherapy | cisplatin | CR | |
| SELENOO | SNV | Missense_Mutation | rs766822774 | c.805C>T | p.Arg269Cys | p.R269C | protein_coding | deleterious(0) | probably_damaging(0.991) | TCGA-AA-3833-01 | Colorectum | colon adenocarcinoma | Female | <65 | I/II | Unknown | Unknown | SD | |
| SELENOO | SNV | Missense_Mutation | c.1225G>A | p.Glu409Lys | p.E409K | protein_coding | tolerated(0.32) | benign(0.179) | TCGA-AA-3848-01 | Colorectum | colon adenocarcinoma | Female | >=65 | III/IV | Unknown | Unknown | PD | ||
| SELENOO | SNV | Missense_Mutation | c.1290N>T | p.Gln430His | p.Q430H | protein_coding | tolerated(0.18) | benign(0.043) | TCGA-AA-A022-01 | Colorectum | colon adenocarcinoma | Female | >=65 | I/II | Unknown | Unknown | SD | ||
| SELENOO | SNV | Missense_Mutation | rs755927400 | c.953C>T | p.Thr318Met | p.T318M | protein_coding | deleterious(0) | probably_damaging(0.999) | TCGA-AD-5900-01 | Colorectum | colon adenocarcinoma | Male | >=65 | I/II | Unknown | Unknown | SD |
| Page: 1 2 3 4 5 |
Top |
Related drugs of malignant transformation related genes |
| Identification of chemicals and drugs interact with genes involved in malignant transfromation |
| (DGIdb 4.0) |
| Entrez ID | Symbol | Category | Interaction Types | Drug Claim Name | Drug Name | PMIDs |
| Page: 1 |

Copyright 2023-Present -The University of Texas Health Science Center at Houston |