
|
|||||
|
 | |
| |
| |
| |
| |
| |
|
Gene: SELENOM |
Gene summary for SELENOM |
| Gene information | Species | Human | Gene symbol | SELENOM | Gene ID | 140606 |
| Gene name | selenoprotein M | |
| Gene Alias | SELM | |
| Cytomap | 22q12.2 | |
| Gene Type | protein-coding | GO ID | GO:0003008 | UniProtAcc | Q8WWX9 |
Top |
Malignant transformation analysis |
| Identification of the aberrant gene expression in precancerous and cancerous lesions by comparing the gene expression of stem-like cells in diseased tissues with normal stem cells |
| Entrez ID | Symbol | Replicates | Species | Organ | Tissue | Adj P-value | Log2FC | Malignancy |
| 140606 | SELENOM | GSM4909281 | Human | Breast | IDC | 1.02e-76 | 1.16e+00 | 0.21 |
| 140606 | SELENOM | GSM4909282 | Human | Breast | IDC | 1.40e-19 | 5.49e-01 | -0.0288 |
| 140606 | SELENOM | GSM4909285 | Human | Breast | IDC | 7.83e-30 | 6.33e-01 | 0.21 |
| 140606 | SELENOM | GSM4909286 | Human | Breast | IDC | 1.05e-23 | 1.76e-01 | 0.1081 |
| 140606 | SELENOM | GSM4909287 | Human | Breast | IDC | 1.03e-25 | 7.66e-01 | 0.2057 |
| 140606 | SELENOM | GSM4909289 | Human | Breast | IDC | 3.35e-03 | 6.08e-01 | 0.1064 |
| 140606 | SELENOM | GSM4909290 | Human | Breast | IDC | 1.61e-05 | 3.22e-01 | 0.2096 |
| 140606 | SELENOM | GSM4909291 | Human | Breast | IDC | 3.40e-22 | 8.18e-01 | 0.1753 |
| 140606 | SELENOM | GSM4909293 | Human | Breast | IDC | 9.64e-31 | 5.78e-01 | 0.1581 |
| 140606 | SELENOM | GSM4909294 | Human | Breast | IDC | 3.68e-03 | -3.49e-01 | 0.2022 |
| 140606 | SELENOM | GSM4909296 | Human | Breast | IDC | 8.50e-06 | 4.40e-01 | 0.1524 |
| 140606 | SELENOM | GSM4909297 | Human | Breast | IDC | 2.16e-04 | 2.08e-01 | 0.1517 |
| 140606 | SELENOM | GSM4909298 | Human | Breast | IDC | 1.26e-19 | 4.51e-01 | 0.1551 |
| 140606 | SELENOM | GSM4909299 | Human | Breast | IDC | 8.89e-28 | 6.07e-01 | 0.035 |
| 140606 | SELENOM | GSM4909300 | Human | Breast | IDC | 2.33e-06 | 5.25e-01 | 0.0334 |
| 140606 | SELENOM | GSM4909301 | Human | Breast | IDC | 7.38e-08 | -3.74e-01 | 0.1577 |
| 140606 | SELENOM | GSM4909302 | Human | Breast | IDC | 1.20e-13 | 5.83e-01 | 0.1545 |
| 140606 | SELENOM | GSM4909304 | Human | Breast | IDC | 7.39e-53 | 9.44e-01 | 0.1636 |
| 140606 | SELENOM | GSM4909305 | Human | Breast | IDC | 3.19e-21 | 6.26e-01 | 0.0436 |
| 140606 | SELENOM | GSM4909306 | Human | Breast | IDC | 5.54e-61 | 1.03e+00 | 0.1564 |
| Page: 1 2 3 4 5 6 7 8 9 |
| Tissue | Expression Dynamics | Abbreviation |
| Breast | 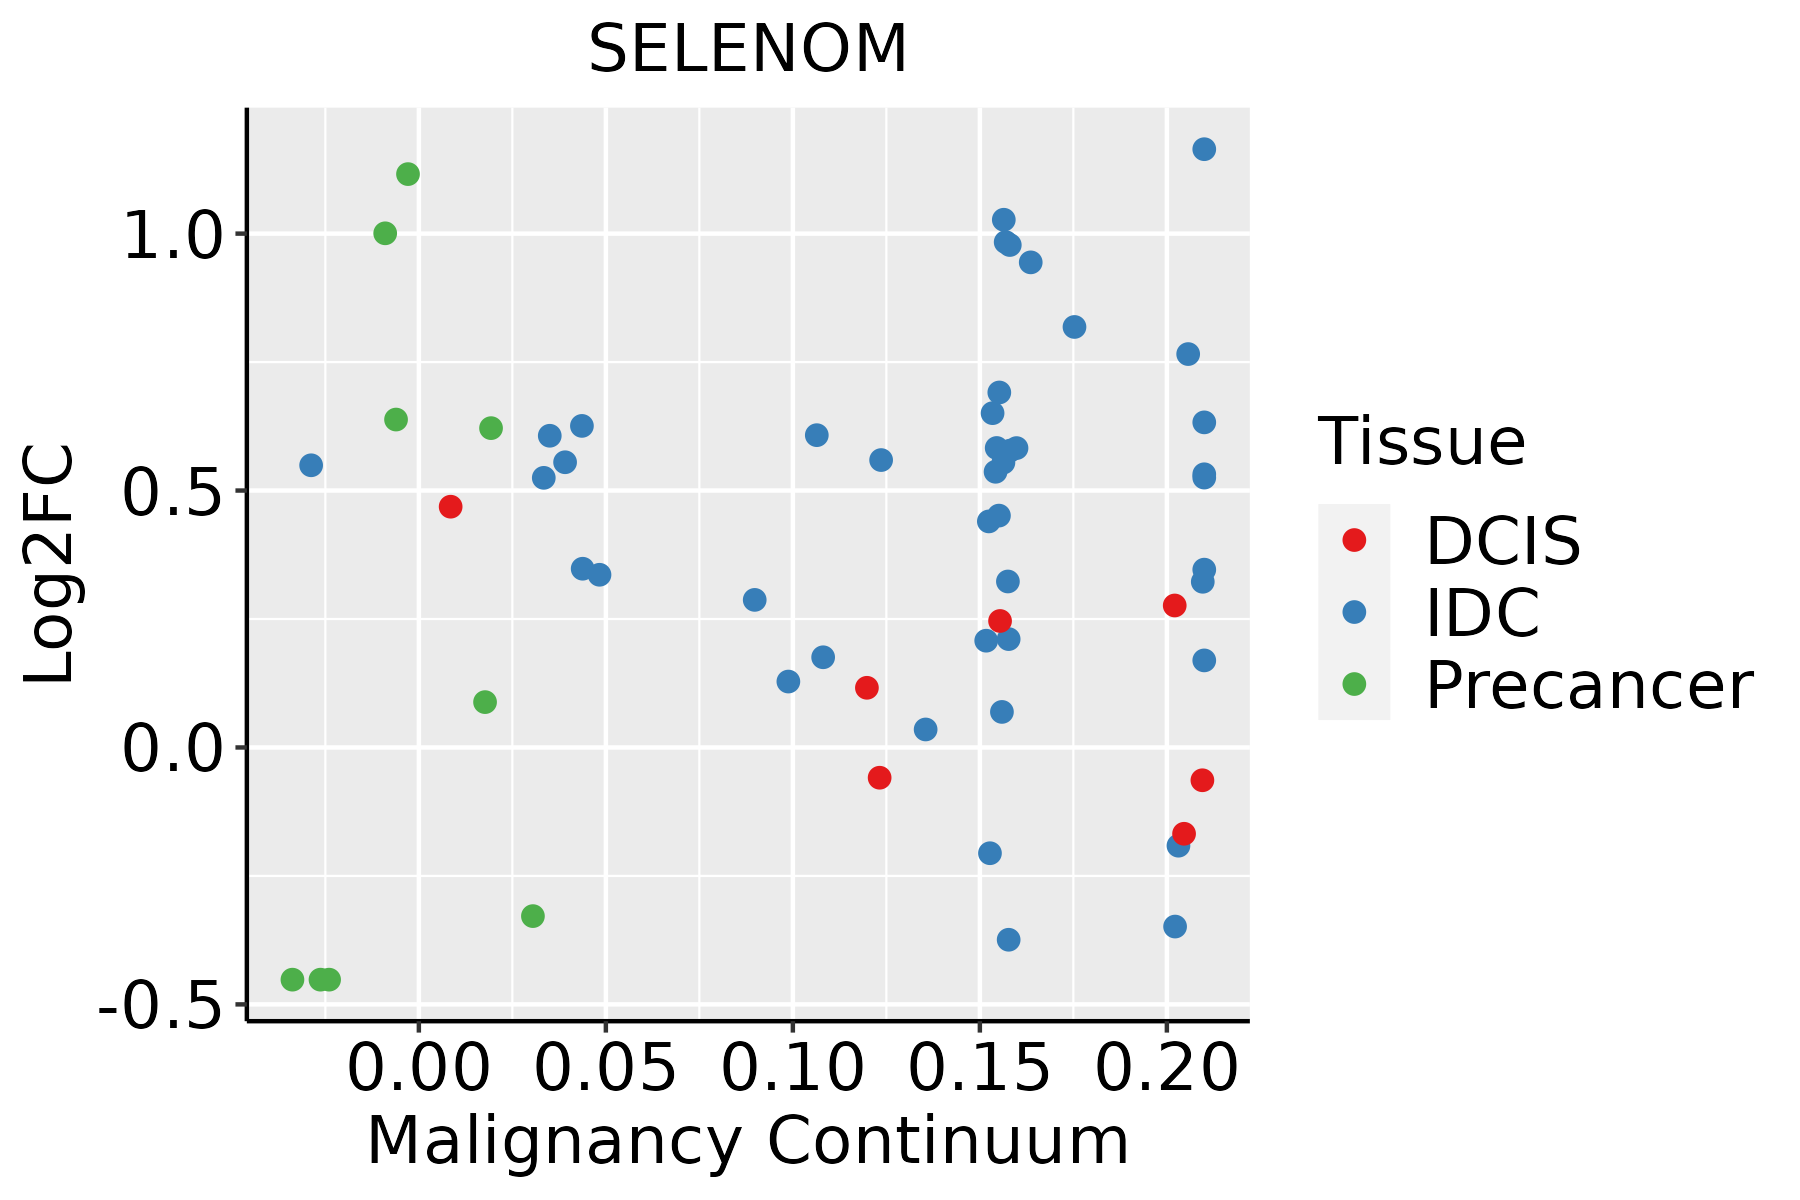 | IDC: Invasive ductal carcinoma |
| DCIS: Ductal carcinoma in situ | ||
| Precancer(BRCA1-mut): Precancerous lesion from BRCA1 mutation carriers | ||
| Endometrium |  | AEH: Atypical endometrial hyperplasia |
| EEC: Endometrioid Cancer | ||
| Esophagus | 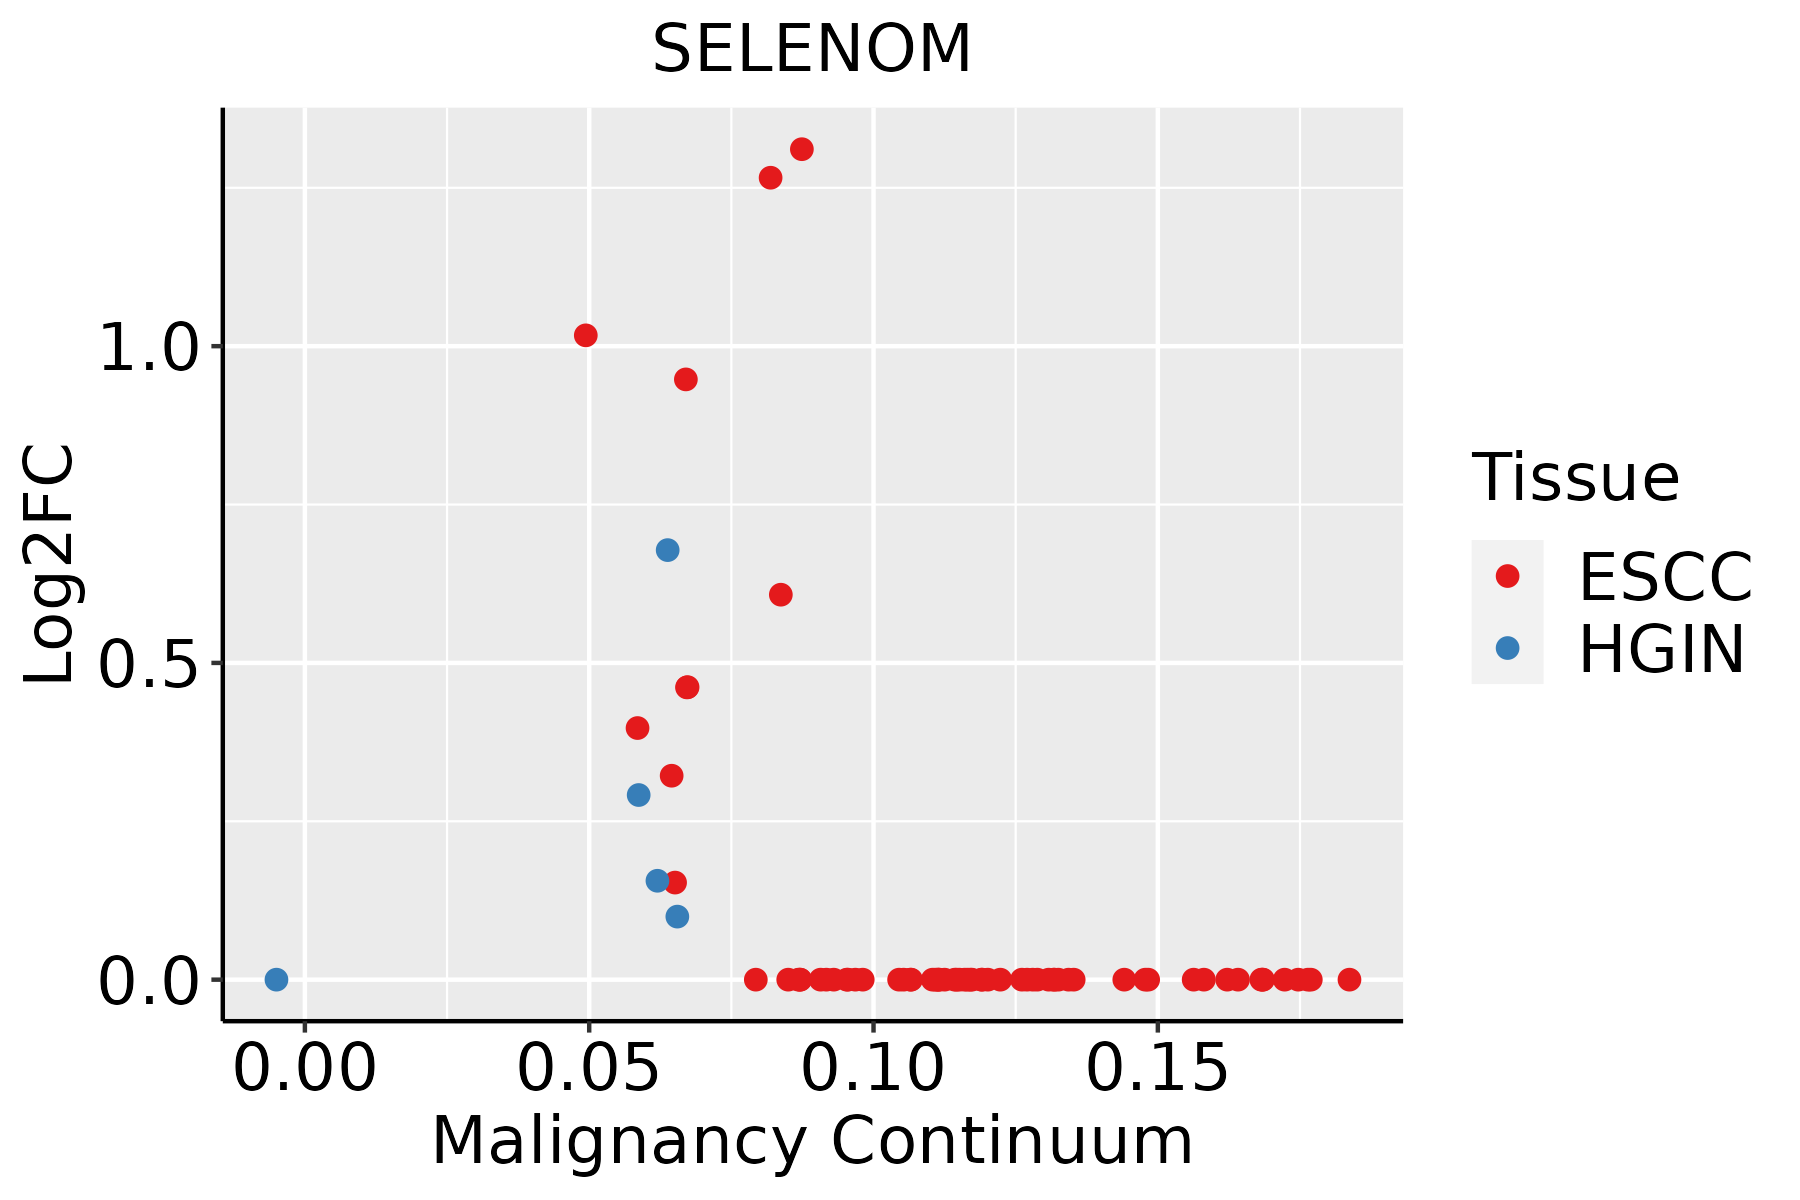 | ESCC: Esophageal squamous cell carcinoma |
| HGIN: High-grade intraepithelial neoplasias | ||
| LGIN: Low-grade intraepithelial neoplasias | ||
| Liver | 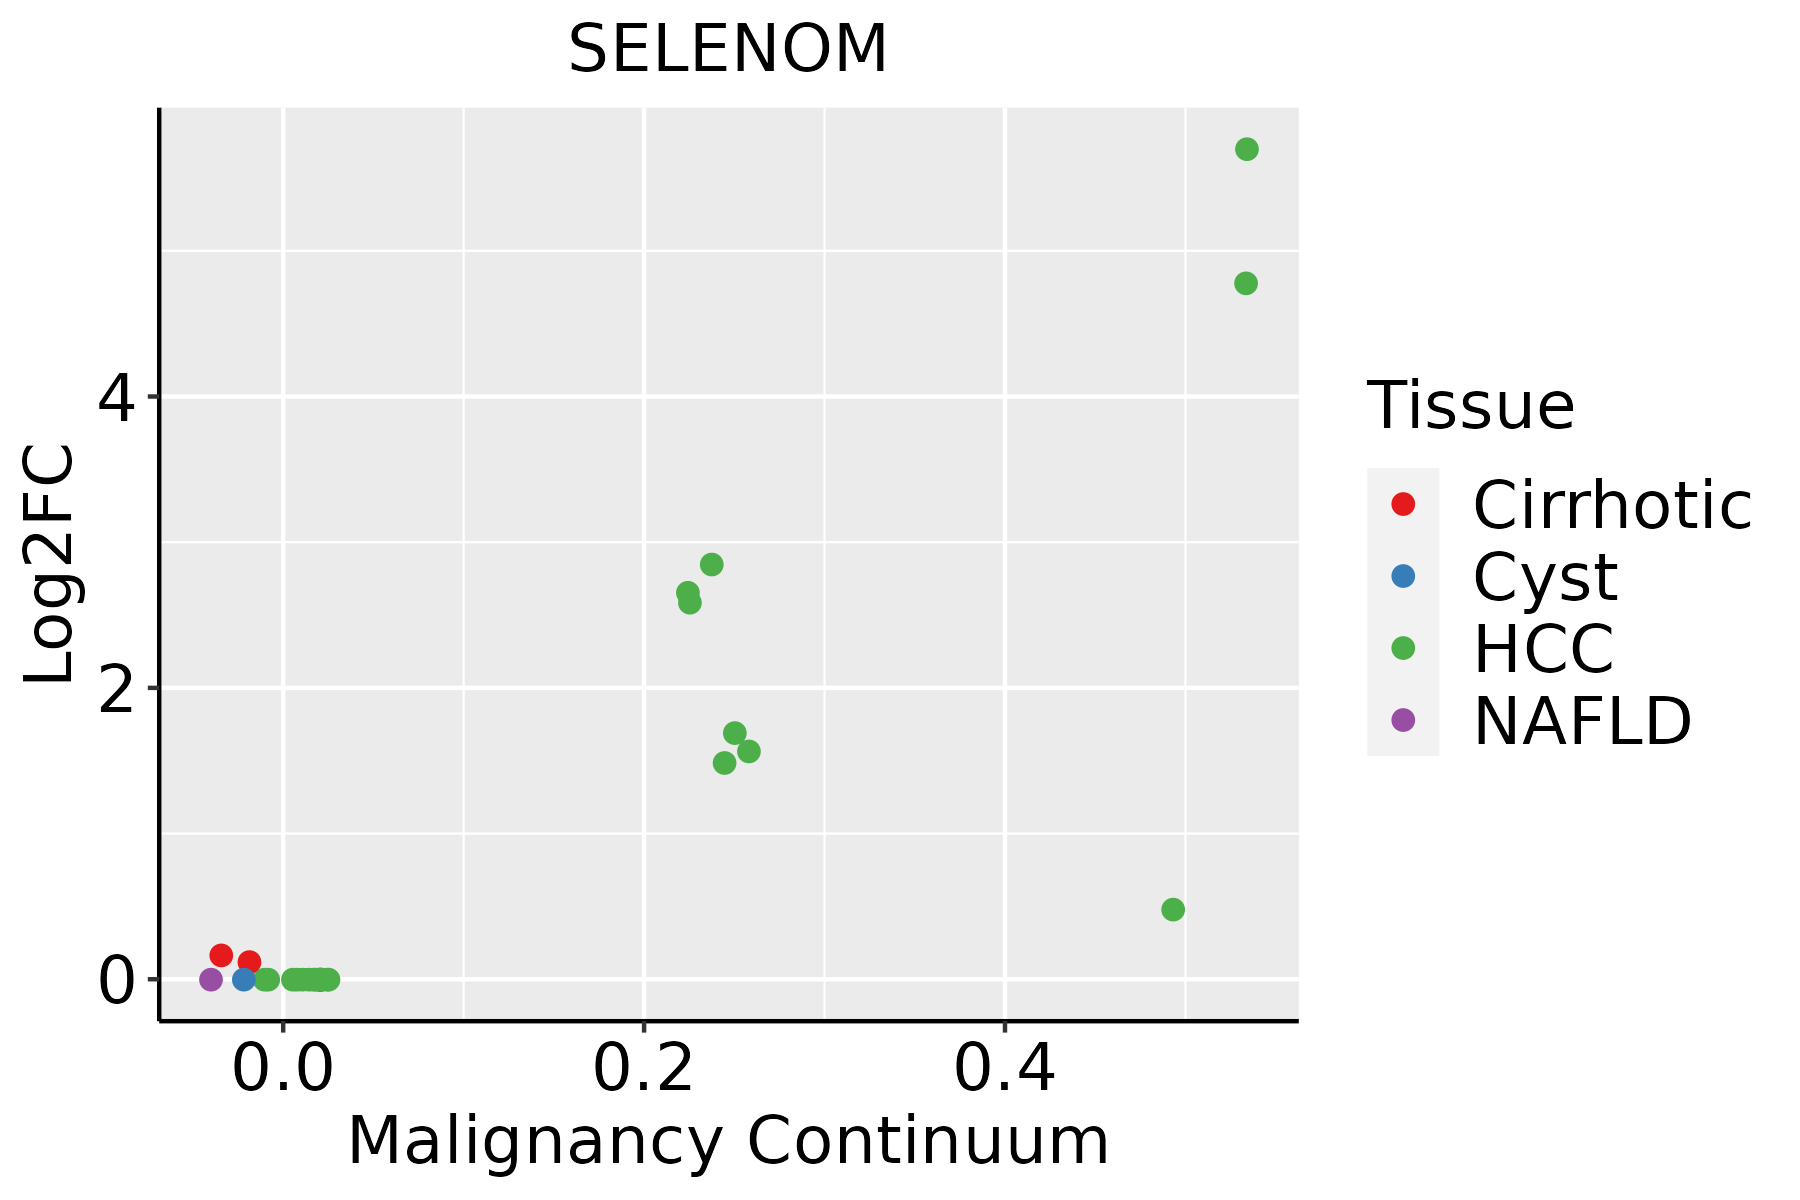 | HCC: Hepatocellular carcinoma |
| NAFLD: Non-alcoholic fatty liver disease | ||
| Lung | 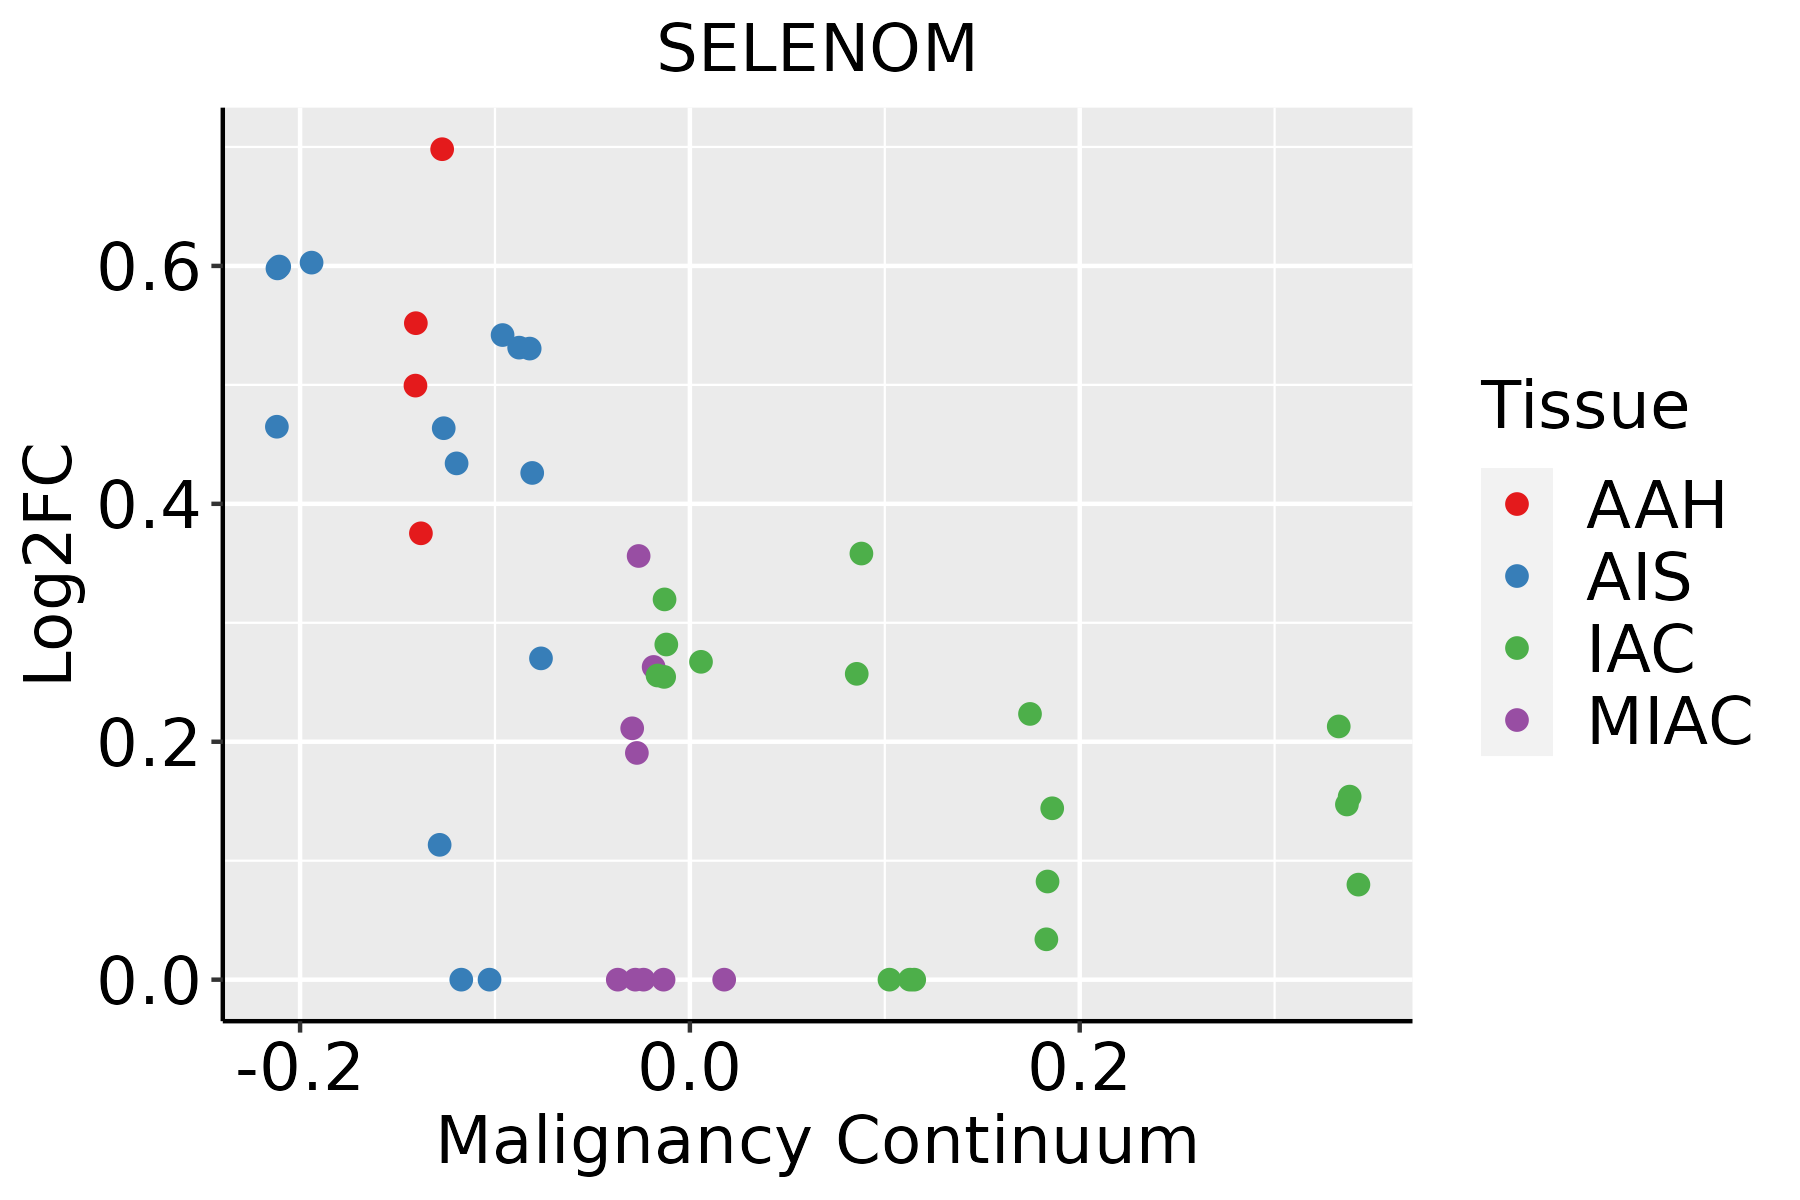 | AAH: Atypical adenomatous hyperplasia |
| AIS: Adenocarcinoma in situ | ||
| IAC: Invasive lung adenocarcinoma | ||
| MIA: Minimally invasive adenocarcinoma | ||
| Prostate |  | BPH: Benign Prostatic Hyperplasia |
| Skin | 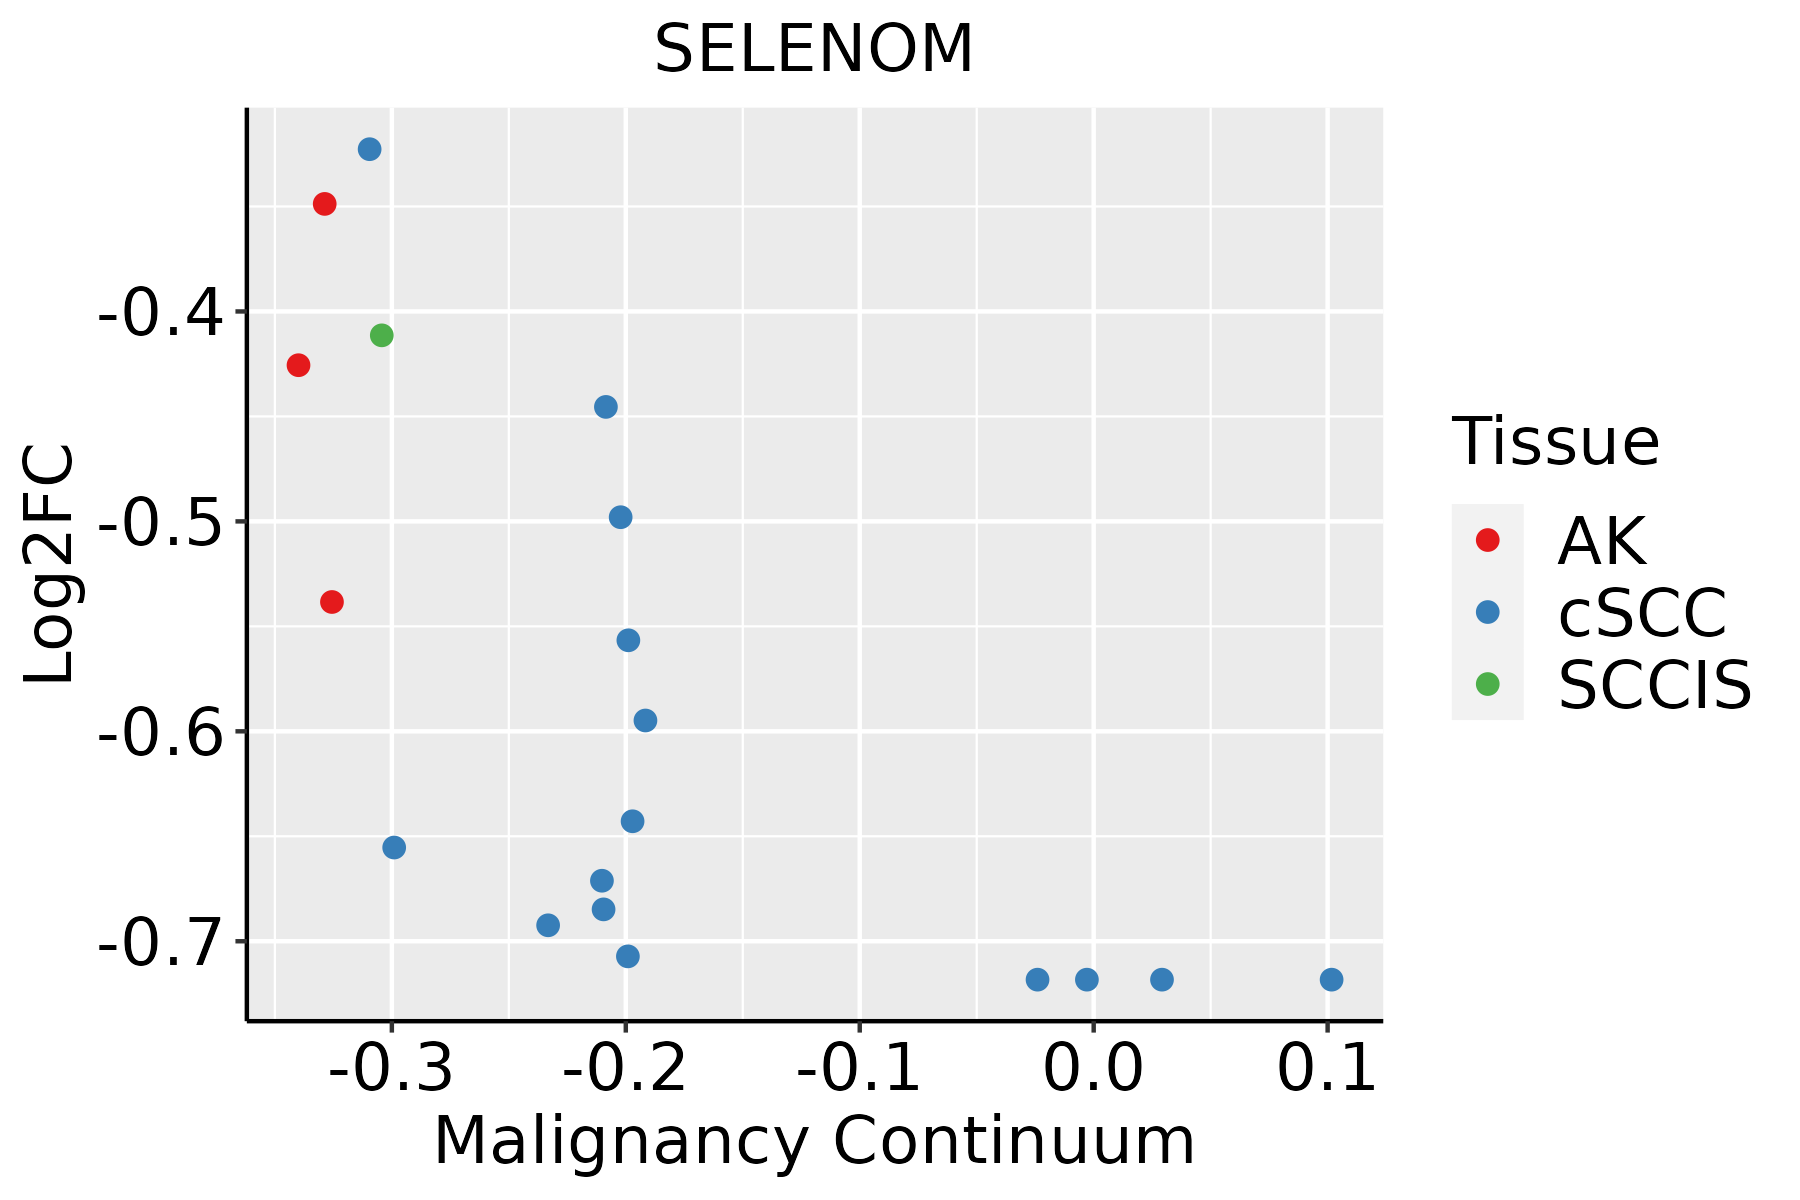 | AK: Actinic keratosis |
| cSCC: Cutaneous squamous cell carcinoma | ||
| SCCIS:squamous cell carcinoma in situ | ||
| Thyroid | 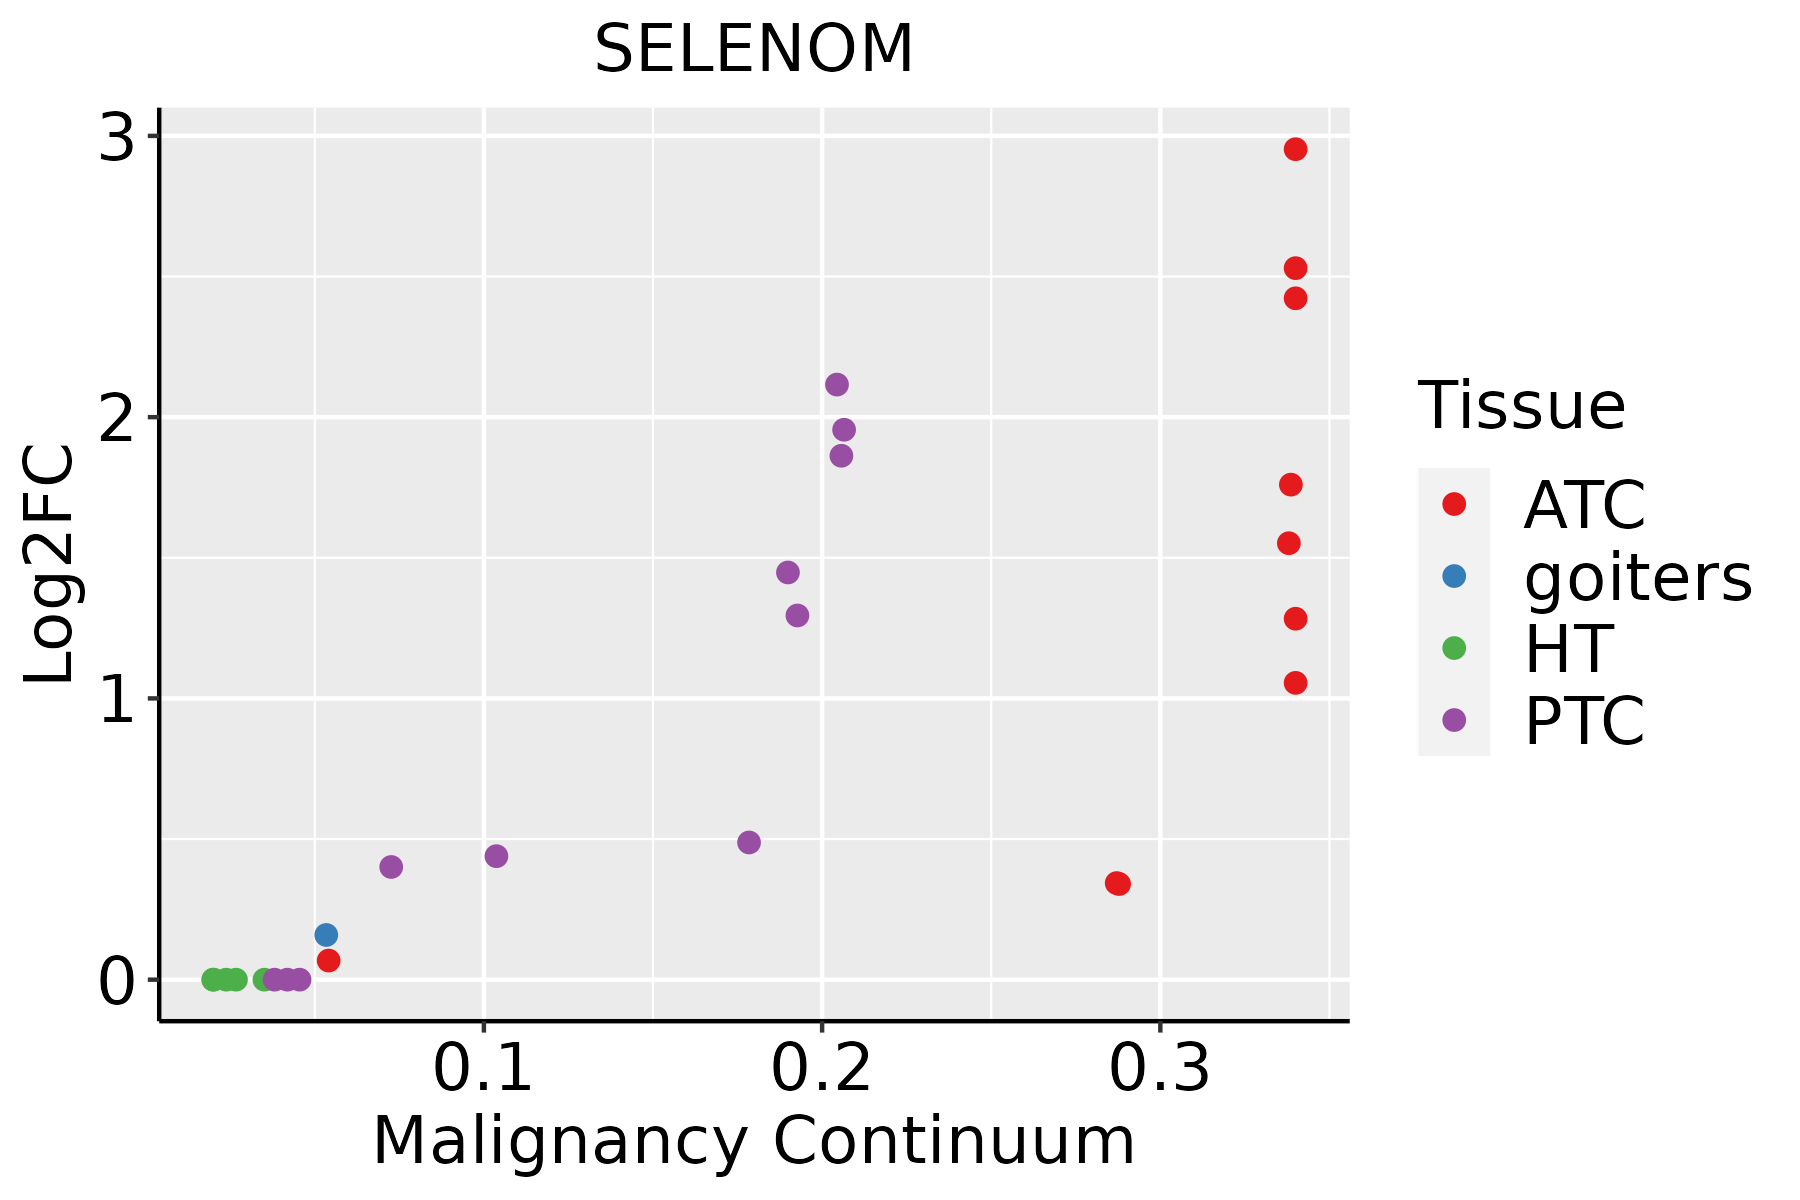 | ATC: Anaplastic thyroid cancer |
| HT: Hashimoto's thyroiditis | ||
| PTC: Papillary thyroid cancer |
| ∗log2FC in expression of this searched gene in stem-like cells from each diseased tissue sample relative to stem-like cells in normal samples in each tissue plotted against the malignancy continuum. Samples are colored based on if they are from different disease stage. |
Top |
Malignant transformation related pathway analysis |
| Find out the enriched GO biological processes and KEGG pathways involved in transition from healthy to precancer to cancer |
| Tissue | Disease Stage | Enriched GO biological Processes |
| Colorectum | AD |  |
| Colorectum | SER |  |
| Colorectum | MSS |  |
| Colorectum | MSI-H |  |
| Colorectum | FAP |  |
| ∗Top 15 enriched GO BP terms are showed in the bar plot of each disease state in each tissue. Each row represents a significant GO biological process which is colored according to the -log10(p.adjust). |
| Page: 1 2 3 4 5 6 7 8 9 |
| GO ID | Tissue | Disease Stage | Description | Gene Ratio | Bg Ratio | pvalue | p.adjust | Count |
| GO:00102693 | Breast | Precancer | response to selenium ion | 4/1080 | 11/18723 | 2.62e-03 | 2.34e-02 | 4 |
| GO:00102691 | Breast | IDC | response to selenium ion | 6/1434 | 11/18723 | 6.59e-05 | 1.35e-03 | 6 |
| GO:00102692 | Breast | DCIS | response to selenium ion | 6/1390 | 11/18723 | 5.53e-05 | 1.12e-03 | 6 |
| GO:0061448 | Endometrium | AEH | connective tissue development | 44/2100 | 252/18723 | 1.92e-03 | 1.51e-02 | 44 |
| GO:00614481 | Endometrium | EEC | connective tissue development | 44/2168 | 252/18723 | 3.51e-03 | 2.36e-02 | 44 |
| GO:00352647 | Esophagus | ESCC | multicellular organism growth | 80/8552 | 132/18723 | 3.84e-04 | 2.22e-03 | 80 |
| GO:001087621 | Liver | HCC | lipid localization | 228/7958 | 448/18723 | 1.80e-04 | 1.41e-03 | 228 |
| GO:000686921 | Liver | HCC | lipid transport | 198/7958 | 398/18723 | 1.92e-03 | 9.78e-03 | 198 |
| GO:003526421 | Liver | HCC | multicellular organism growth | 70/7958 | 132/18723 | 9.29e-03 | 3.57e-02 | 70 |
| GO:00352644 | Lung | IAC | multicellular organism growth | 25/2061 | 132/18723 | 4.69e-03 | 3.68e-02 | 25 |
| GO:00352645 | Prostate | BPH | multicellular organism growth | 36/3107 | 132/18723 | 1.31e-03 | 7.90e-03 | 36 |
| GO:003526412 | Prostate | Tumor | multicellular organism growth | 36/3246 | 132/18723 | 2.85e-03 | 1.55e-02 | 36 |
| GO:00102694 | Prostate | Tumor | response to selenium ion | 6/3246 | 11/18723 | 5.63e-03 | 2.63e-02 | 6 |
| GO:00614483 | Skin | AK | connective tissue development | 40/1910 | 252/18723 | 3.17e-03 | 1.95e-02 | 40 |
| GO:00102695 | Skin | SCCIS | response to selenium ion | 4/919 | 11/18723 | 1.44e-03 | 1.63e-02 | 4 |
| GO:006144811 | Skin | SCCIS | connective tissue development | 22/919 | 252/18723 | 6.57e-03 | 4.89e-02 | 22 |
| GO:00352648 | Thyroid | PTC | multicellular organism growth | 56/5968 | 132/18723 | 6.79e-03 | 2.92e-02 | 56 |
| GO:00614484 | Thyroid | ATC | connective tissue development | 112/6293 | 252/18723 | 2.08e-04 | 1.38e-03 | 112 |
| GO:003526414 | Thyroid | ATC | multicellular organism growth | 61/6293 | 132/18723 | 1.73e-03 | 8.66e-03 | 61 |
| Page: 1 |
| Pathway ID | Tissue | Disease Stage | Description | Gene Ratio | Bg Ratio | pvalue | p.adjust | qvalue | Count |
| Page: 1 |
Top |
Cell-cell communication analysis |
| Identification of potential cell-cell interactions between two cell types and their ligand-receptor pairs for different disease states |
| Ligand | Receptor | LRpair | Pathway | Tissue | Disease Stage |
| Page: 1 |
Top |
Single-cell gene regulatory network inference analysis |
| Find out the significant the regulons (TFs) and the target genes of each regulon across cell types for different disease states |
| TF | Cell Type | Tissue | Disease Stage | Target Gene | RSS | Regulon Activity |
| ∗The dot plots of a searched regulon are shown for all cell subpopulations in each disease state of each tissue based on the regulon specific score inferred using pySCENIC and by calculating the average expression. |
| Page: 1 |
Top |
Somatic mutation of malignant transformation related genes |
| Annotation of somatic variants for genes involved in malignant transformation |
| Hugo Symbol | Variant Class | Variant Classification | dbSNP RS | HGVSc | HGVSp | HGVSp Short | SWISSPROT | BIOTYPE | SIFT | PolyPhen | Tumor Sample Barcode | Tissue | Histology | Sex | Age | Stage | Therapy Types | Drugs | Outcome |
| SELENOM | SNV | Missense_Mutation | c.263G>A | p.Arg88His | p.R88H | protein_coding | tolerated(0.53) | benign(0.005) | TCGA-BH-A0HA-01 | Breast | breast invasive carcinoma | Female | <65 | I/II | Unknown | Unknown | SD | ||
| SELENOM | SNV | Missense_Mutation | c.263G>A | p.Arg88His | p.R88H | protein_coding | tolerated(0.53) | benign(0.005) | TCGA-A6-6653-01 | Colorectum | colon adenocarcinoma | Male | >=65 | I/II | Unknown | Unknown | SD | ||
| SELENOM | SNV | Missense_Mutation | c.260N>A | p.Arg87His | p.R87H | protein_coding | tolerated(0.85) | benign(0) | TCGA-AA-3986-01 | Colorectum | colon adenocarcinoma | Male | >=65 | I/II | Unknown | Unknown | SD | ||
| SELENOM | SNV | Missense_Mutation | c.398N>T | p.Ala133Val | p.A133V | protein_coding | deleterious(0.03) | possibly_damaging(0.608) | TCGA-D5-6930-01 | Colorectum | colon adenocarcinoma | Male | >=65 | I/II | Unknown | Unknown | SD | ||
| SELENOM | SNV | Missense_Mutation | c.325N>C | p.Val109Leu | p.V109L | protein_coding | tolerated(1) | benign(0.005) | TCGA-NH-A5IV-01 | Colorectum | colon adenocarcinoma | Female | >=65 | I/II | Unknown | Unknown | SD | ||
| SELENOM | SNV | Missense_Mutation | novel | c.136N>A | p.Gly46Arg | p.G46R | protein_coding | tolerated(0.34) | benign(0.229) | TCGA-EO-A22U-01 | Endometrium | uterine corpus endometrioid carcinoma | Female | >=65 | I/II | Unknown | Unknown | SD | |
| SELENOM | SNV | Missense_Mutation | novel | c.352N>A | p.Ala118Thr | p.A118T | protein_coding | tolerated(0.46) | benign(0) | TCGA-FI-A2D5-01 | Endometrium | uterine corpus endometrioid carcinoma | Female | <65 | III/IV | Chemotherapy | carboplatinum | PD | |
| SELENOM | SNV | Missense_Mutation | novel | c.307N>A | p.Glu103Lys | p.E103K | protein_coding | tolerated(0.14) | benign(0.009) | TCGA-QS-A5YQ-01 | Endometrium | uterine corpus endometrioid carcinoma | Female | <65 | III/IV | Chemotherapy | cisplatin | CR | |
| SELENOM | SNV | Missense_Mutation | novel | c.251N>C | p.Leu84Pro | p.L84P | protein_coding | deleterious(0) | probably_damaging(1) | TCGA-77-8140-01 | Lung | lung squamous cell carcinoma | Female | >=65 | I/II | Unknown | Unknown | SD | |
| SELENOM | SNV | Missense_Mutation | c.263N>A | p.Arg88His | p.R88H | protein_coding | tolerated(0.53) | benign(0.005) | TCGA-XK-AAIW-01 | Prostate | prostate adenocarcinoma | Male | >=65 | 9 | Unknown | Unknown | PD |
| Page: 1 |
Top |
Related drugs of malignant transformation related genes |
| Identification of chemicals and drugs interact with genes involved in malignant transfromation |
| (DGIdb 4.0) |
| Entrez ID | Symbol | Category | Interaction Types | Drug Claim Name | Drug Name | PMIDs |
| Page: 1 |

Copyright 2023-Present -The University of Texas Health Science Center at Houston |