
|
|||||
|
 | |
| |
| |
| |
| |
| |
|
Gene: SELENOF |
Gene summary for SELENOF |
| Gene information | Species | Human | Gene symbol | SELENOF | Gene ID | 9403 |
| Gene name | selenoprotein F | |
| Gene Alias | SEP15 | |
| Cytomap | 1p22.3 | |
| Gene Type | protein-coding | GO ID | GO:0006457 | UniProtAcc | O60613 |
Top |
Malignant transformation analysis |
| Identification of the aberrant gene expression in precancerous and cancerous lesions by comparing the gene expression of stem-like cells in diseased tissues with normal stem cells |
| Entrez ID | Symbol | Replicates | Species | Organ | Tissue | Adj P-value | Log2FC | Malignancy |
| 9403 | SELENOF | HTA11_347_2000001011 | Human | Colorectum | AD | 5.55e-09 | 5.27e-01 | -0.1954 |
| 9403 | SELENOF | HTA11_99999970781_79442 | Human | Colorectum | MSS | 3.84e-22 | -4.37e-01 | 0.294 |
| 9403 | SELENOF | HTA11_99999965104_69814 | Human | Colorectum | MSS | 2.06e-07 | -4.37e-01 | 0.281 |
| 9403 | SELENOF | HTA11_99999971662_82457 | Human | Colorectum | MSS | 6.91e-23 | -4.37e-01 | 0.3859 |
| 9403 | SELENOF | HTA11_99999973899_84307 | Human | Colorectum | MSS | 2.50e-05 | -4.37e-01 | 0.2585 |
| 9403 | SELENOF | HTA11_99999974143_84620 | Human | Colorectum | MSS | 2.11e-21 | -4.37e-01 | 0.3005 |
| 9403 | SELENOF | A015-C-203 | Human | Colorectum | FAP | 2.50e-16 | -3.22e-01 | -0.1294 |
| 9403 | SELENOF | A015-C-204 | Human | Colorectum | FAP | 4.42e-03 | -2.47e-01 | -0.0228 |
| 9403 | SELENOF | A014-C-040 | Human | Colorectum | FAP | 3.40e-02 | -3.88e-01 | -0.1184 |
| 9403 | SELENOF | A002-C-201 | Human | Colorectum | FAP | 5.99e-08 | -2.79e-01 | 0.0324 |
| 9403 | SELENOF | A002-C-203 | Human | Colorectum | FAP | 1.12e-02 | -1.28e-01 | 0.2786 |
| 9403 | SELENOF | A001-C-119 | Human | Colorectum | FAP | 2.91e-04 | -2.22e-01 | -0.1557 |
| 9403 | SELENOF | A001-C-108 | Human | Colorectum | FAP | 1.70e-07 | -2.69e-01 | -0.0272 |
| 9403 | SELENOF | A002-C-205 | Human | Colorectum | FAP | 1.85e-12 | -3.41e-01 | -0.1236 |
| 9403 | SELENOF | A015-C-005 | Human | Colorectum | FAP | 1.72e-03 | -2.57e-01 | -0.0336 |
| 9403 | SELENOF | A015-C-006 | Human | Colorectum | FAP | 1.12e-09 | -3.93e-01 | -0.0994 |
| 9403 | SELENOF | A015-C-106 | Human | Colorectum | FAP | 8.27e-09 | -2.26e-01 | -0.0511 |
| 9403 | SELENOF | A002-C-114 | Human | Colorectum | FAP | 3.43e-11 | -3.67e-01 | -0.1561 |
| 9403 | SELENOF | A015-C-104 | Human | Colorectum | FAP | 9.78e-17 | -3.52e-01 | -0.1899 |
| 9403 | SELENOF | A001-C-014 | Human | Colorectum | FAP | 6.95e-08 | -2.73e-01 | 0.0135 |
| Page: 1 2 3 4 5 6 7 8 |
| Tissue | Expression Dynamics | Abbreviation |
| Colorectum (GSE201348) |  | FAP: Familial adenomatous polyposis |
| CRC: Colorectal cancer | ||
| Colorectum (HTA11) |  | AD: Adenomas |
| SER: Sessile serrated lesions | ||
| MSI-H: Microsatellite-high colorectal cancer | ||
| MSS: Microsatellite stable colorectal cancer | ||
| Endometrium | 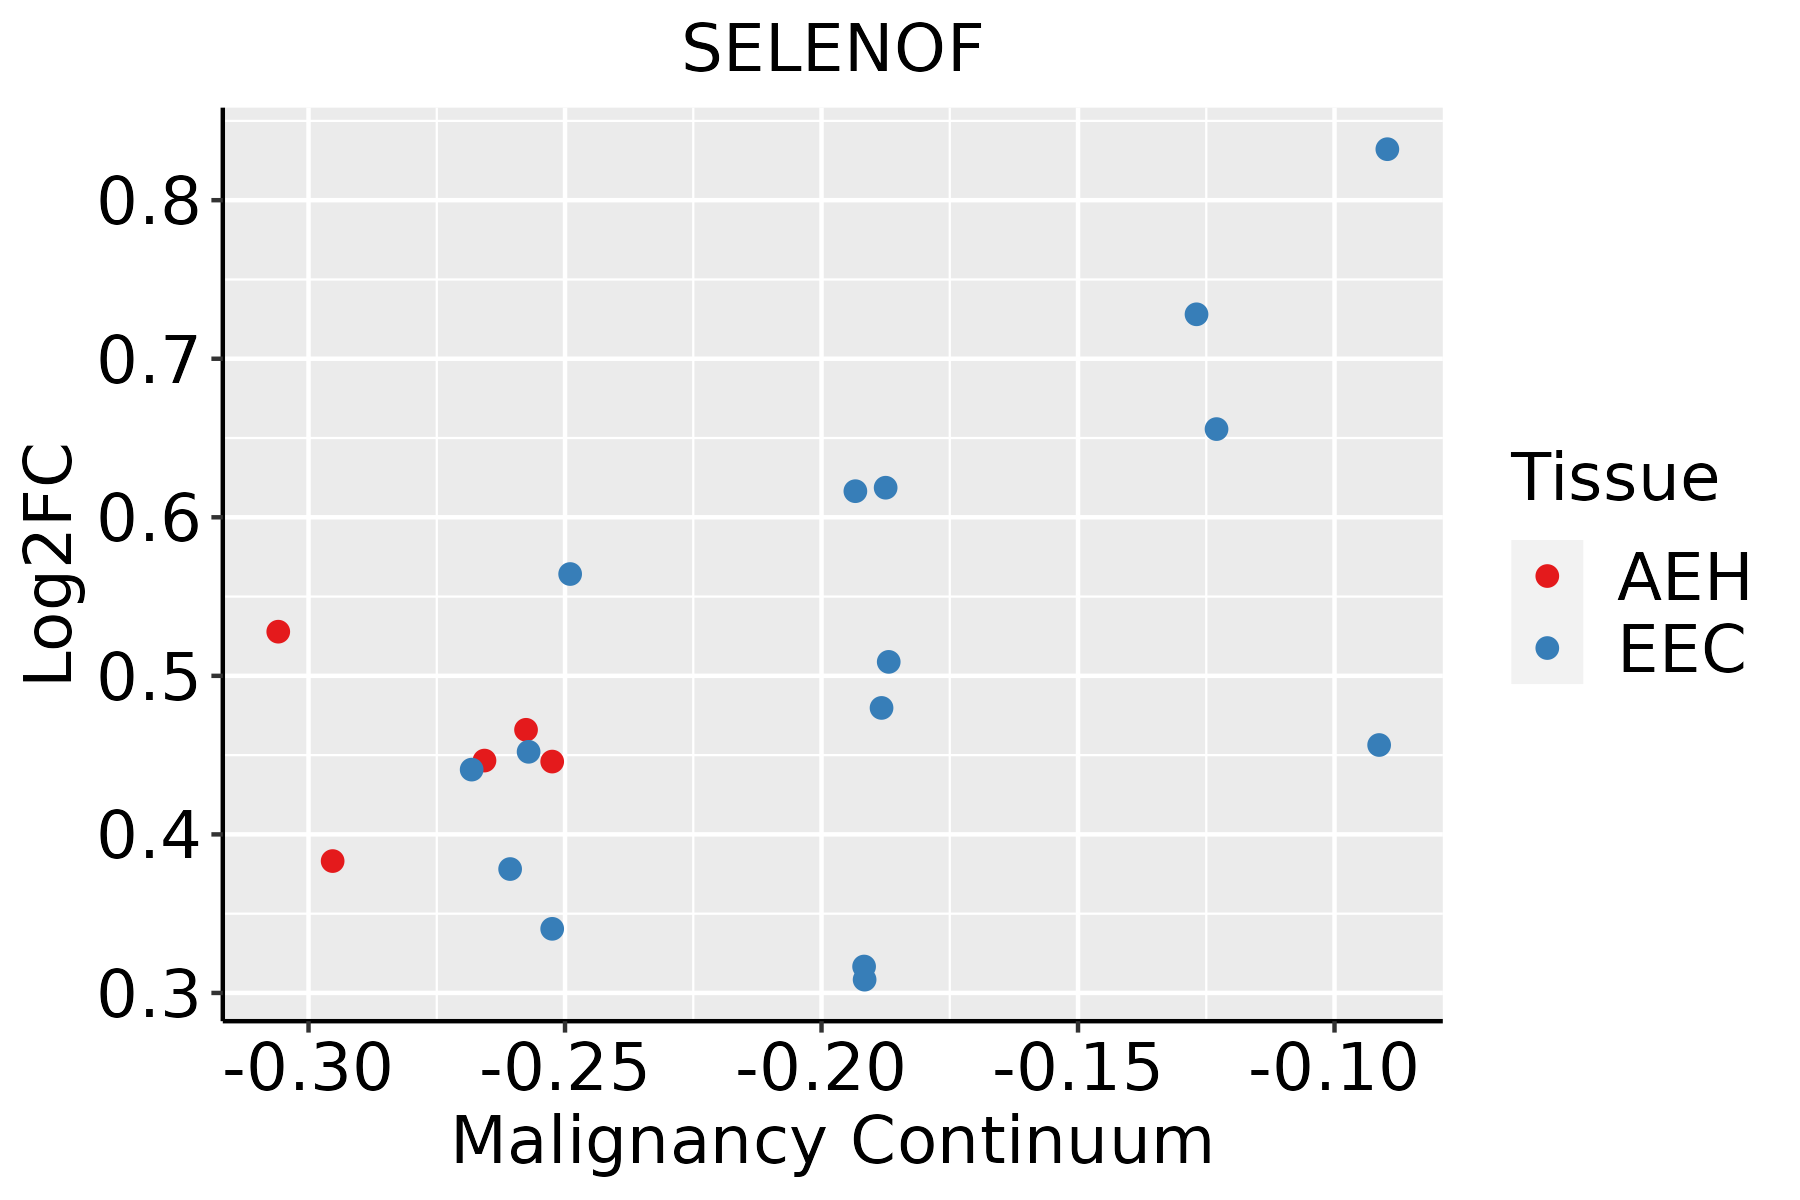 | AEH: Atypical endometrial hyperplasia |
| EEC: Endometrioid Cancer | ||
| Esophagus | 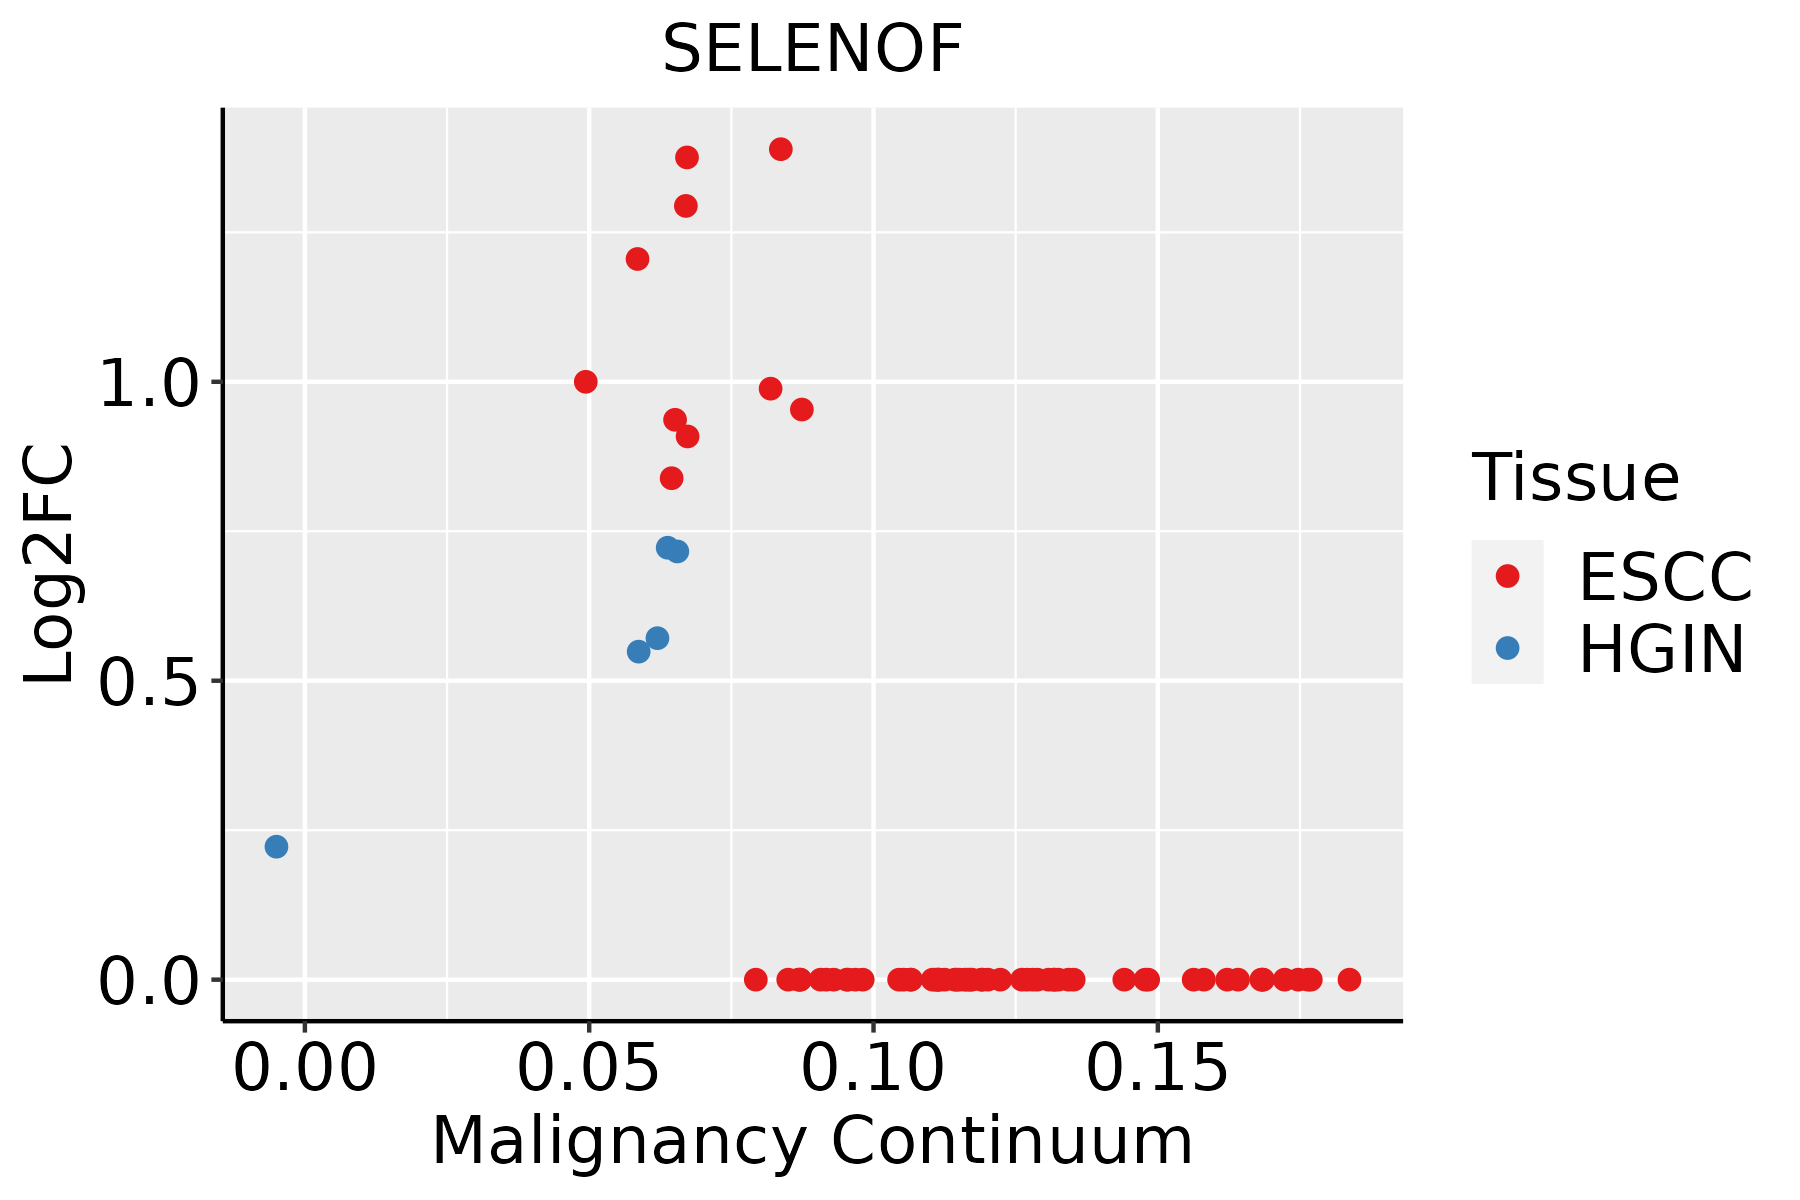 | ESCC: Esophageal squamous cell carcinoma |
| HGIN: High-grade intraepithelial neoplasias | ||
| LGIN: Low-grade intraepithelial neoplasias | ||
| GC | 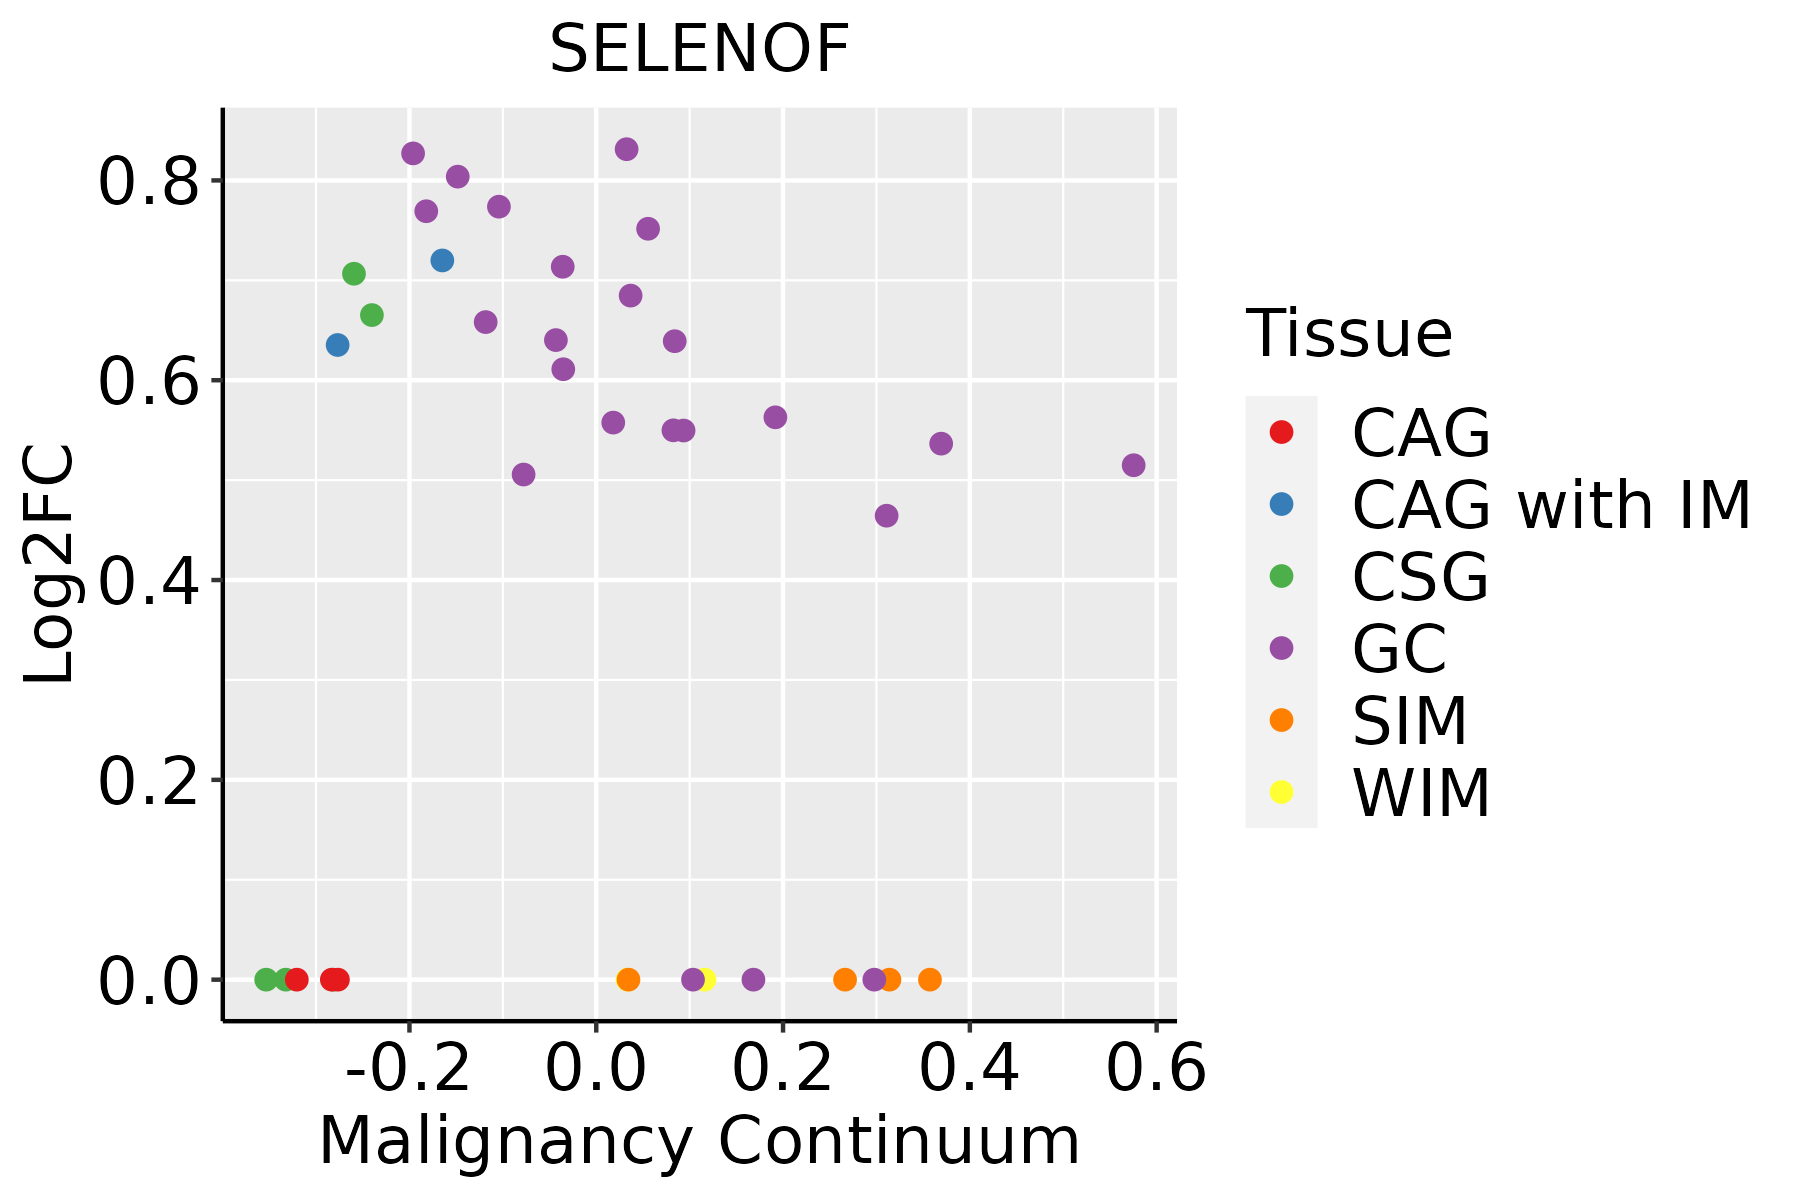 | CAG: Chronic atrophic gastritis |
| CAG with IM: Chronic atrophic gastritis with intestinal metaplasia | ||
| CSG: Chronic superficial gastritis | ||
| GC: Gastric cancer | ||
| SIM: Severe intestinal metaplasia | ||
| WIM: Wild intestinal metaplasia | ||
| Liver |  | HCC: Hepatocellular carcinoma |
| NAFLD: Non-alcoholic fatty liver disease | ||
| Lung | 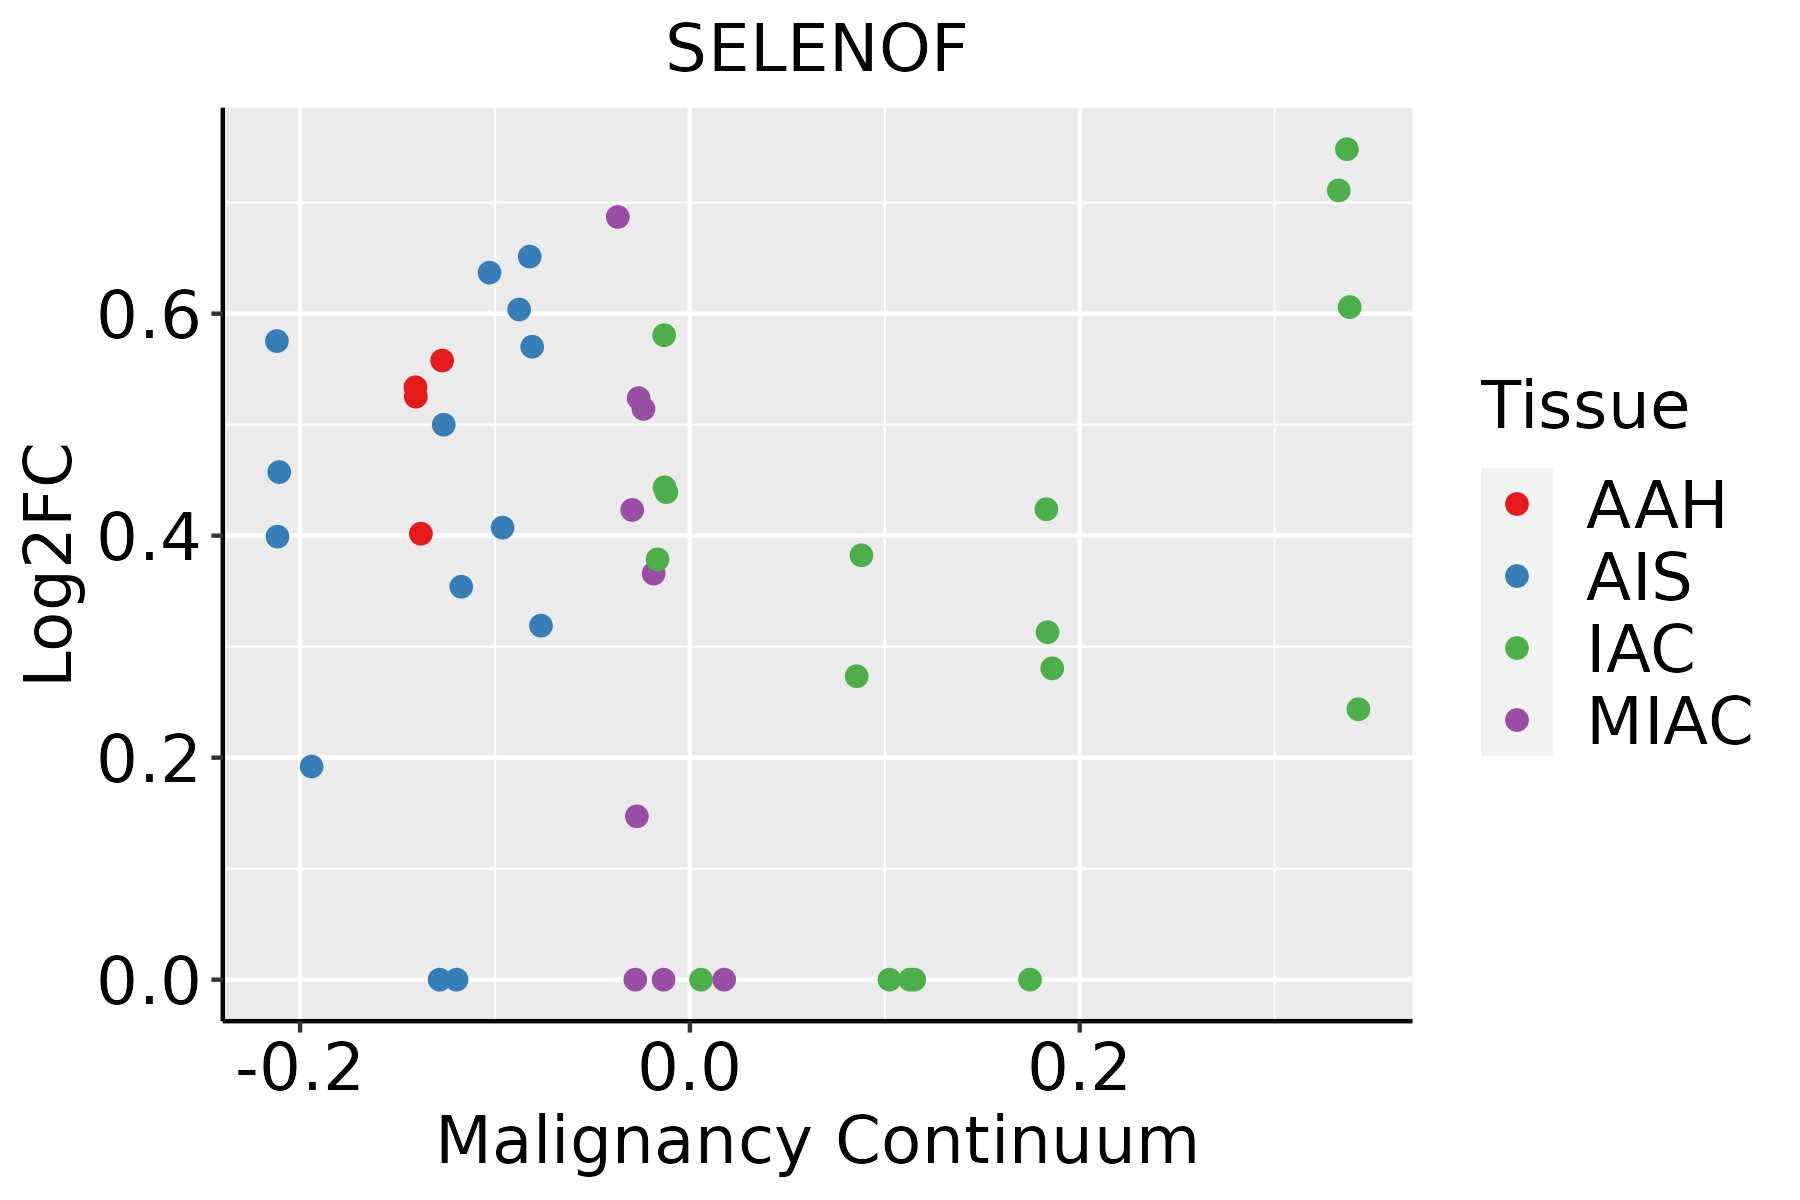 | AAH: Atypical adenomatous hyperplasia |
| AIS: Adenocarcinoma in situ | ||
| IAC: Invasive lung adenocarcinoma | ||
| MIA: Minimally invasive adenocarcinoma | ||
| Prostate | 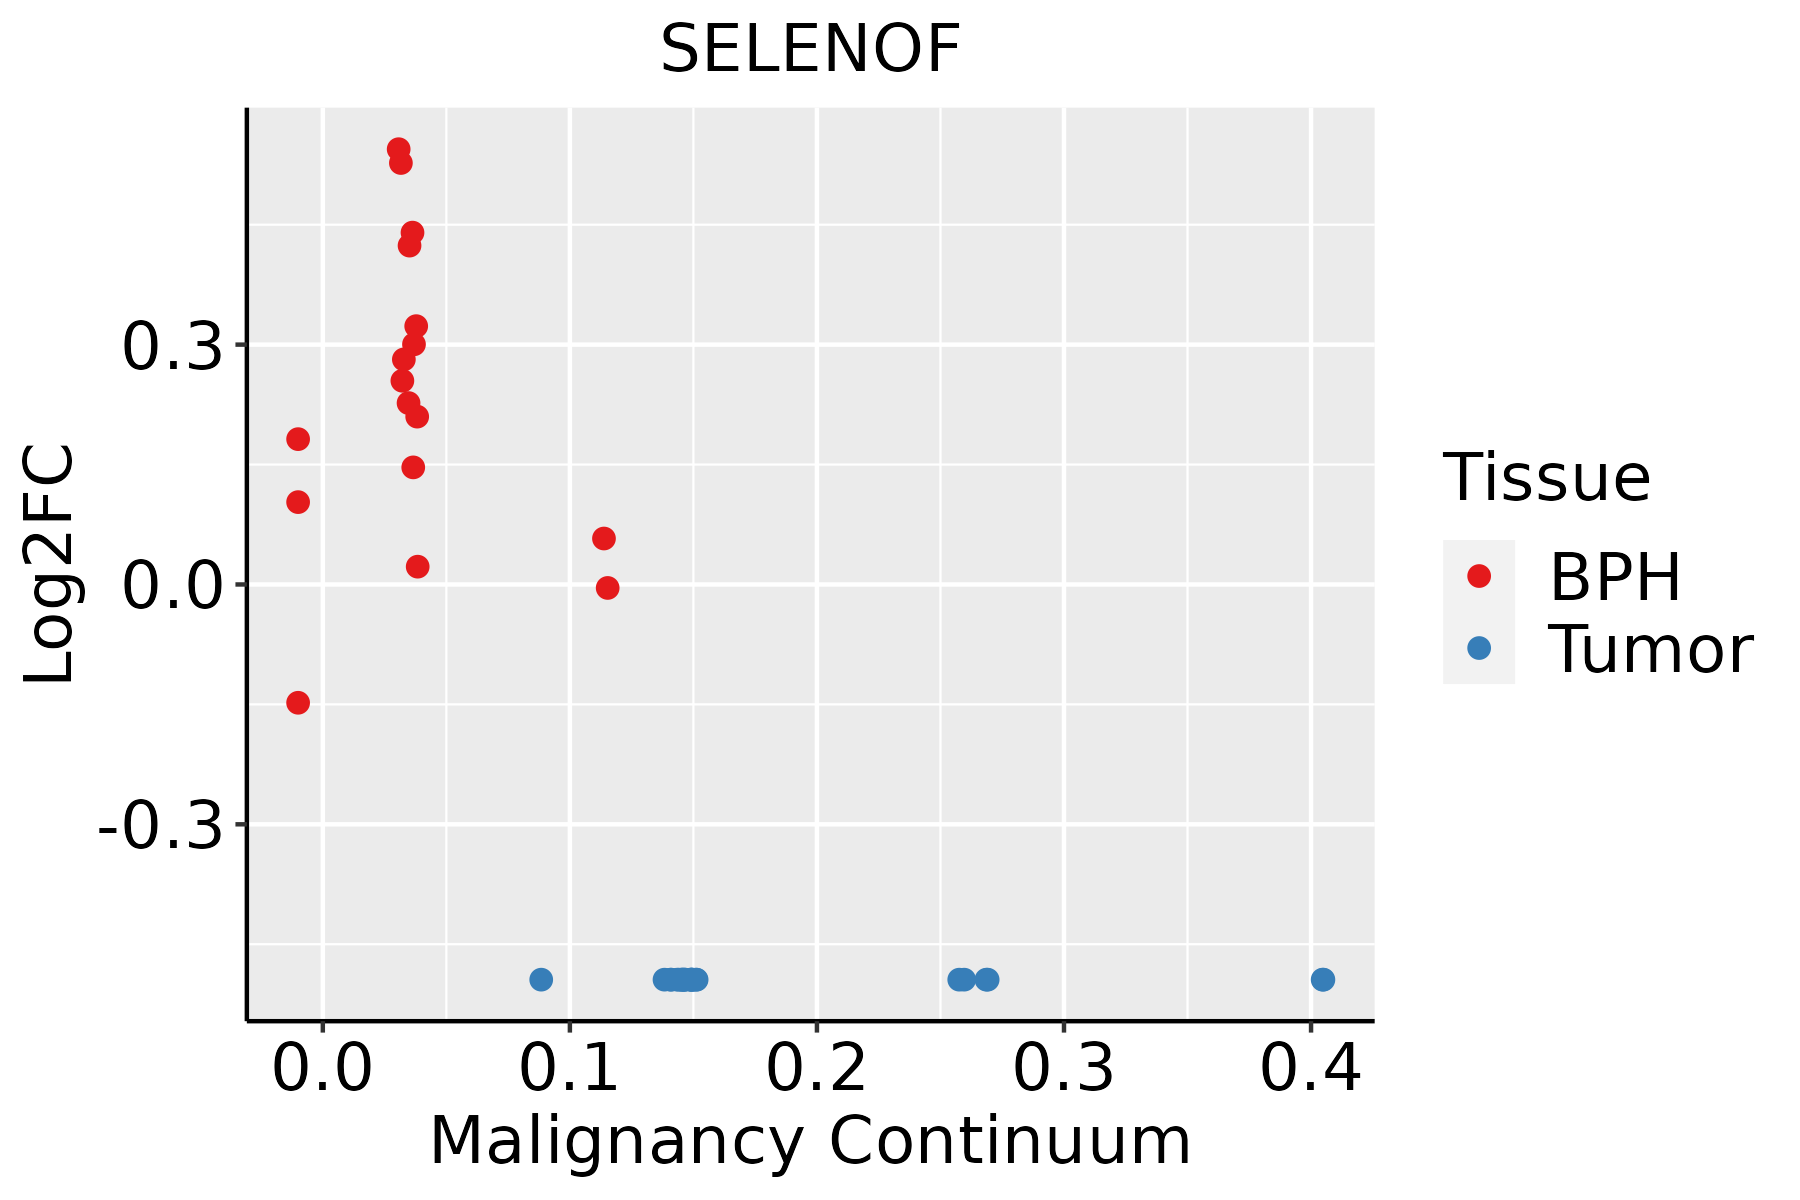 | BPH: Benign Prostatic Hyperplasia |
| Thyroid |  | ATC: Anaplastic thyroid cancer |
| HT: Hashimoto's thyroiditis | ||
| PTC: Papillary thyroid cancer |
| ∗log2FC in expression of this searched gene in stem-like cells from each diseased tissue sample relative to stem-like cells in normal samples in each tissue plotted against the malignancy continuum. Samples are colored based on if they are from different disease stage. |
Top |
Malignant transformation related pathway analysis |
| Find out the enriched GO biological processes and KEGG pathways involved in transition from healthy to precancer to cancer |
| Tissue | Disease Stage | Enriched GO biological Processes |
| Colorectum | AD |  |
| Colorectum | SER |  |
| Colorectum | MSS |  |
| Colorectum | MSI-H |  |
| Colorectum | FAP |  |
| ∗Top 15 enriched GO BP terms are showed in the bar plot of each disease state in each tissue. Each row represents a significant GO biological process which is colored according to the -log10(p.adjust). |
| Page: 1 2 3 4 5 6 7 8 9 |
| GO ID | Tissue | Disease Stage | Description | Gene Ratio | Bg Ratio | pvalue | p.adjust | Count |
| GO:0006457 | Colorectum | AD | protein folding | 73/3918 | 212/18723 | 3.24e-06 | 9.10e-05 | 73 |
| GO:0006458 | Colorectum | AD | 'de novo' protein folding | 20/3918 | 43/18723 | 1.53e-04 | 2.16e-03 | 20 |
| GO:0051084 | Colorectum | AD | 'de novo' posttranslational protein folding | 18/3918 | 39/18723 | 3.66e-04 | 4.24e-03 | 18 |
| GO:00064572 | Colorectum | MSS | protein folding | 71/3467 | 212/18723 | 1.25e-07 | 5.91e-06 | 71 |
| GO:00064582 | Colorectum | MSS | 'de novo' protein folding | 20/3467 | 43/18723 | 2.50e-05 | 5.21e-04 | 20 |
| GO:00510842 | Colorectum | MSS | 'de novo' posttranslational protein folding | 18/3467 | 39/18723 | 7.19e-05 | 1.21e-03 | 18 |
| GO:00064574 | Colorectum | FAP | protein folding | 44/2622 | 212/18723 | 4.36e-03 | 2.98e-02 | 44 |
| GO:000645710 | Endometrium | AEH | protein folding | 61/2100 | 212/18723 | 1.86e-12 | 3.48e-10 | 61 |
| GO:000645810 | Endometrium | AEH | 'de novo' protein folding | 15/2100 | 43/18723 | 3.76e-05 | 6.53e-04 | 15 |
| GO:005108410 | Endometrium | AEH | 'de novo' posttranslational protein folding | 13/2100 | 39/18723 | 2.08e-04 | 2.58e-03 | 13 |
| GO:000645715 | Endometrium | EEC | protein folding | 63/2168 | 212/18723 | 6.82e-13 | 1.40e-10 | 63 |
| GO:000645815 | Endometrium | EEC | 'de novo' protein folding | 15/2168 | 43/18723 | 5.48e-05 | 8.64e-04 | 15 |
| GO:005108415 | Endometrium | EEC | 'de novo' posttranslational protein folding | 13/2168 | 39/18723 | 2.87e-04 | 3.23e-03 | 13 |
| GO:000645720 | Esophagus | HGIN | protein folding | 75/2587 | 212/18723 | 1.61e-15 | 3.86e-13 | 75 |
| GO:000645820 | Esophagus | HGIN | 'de novo' protein folding | 19/2587 | 43/18723 | 1.25e-06 | 4.83e-05 | 19 |
| GO:005108420 | Esophagus | HGIN | 'de novo' posttranslational protein folding | 16/2587 | 39/18723 | 2.70e-05 | 7.03e-04 | 16 |
| GO:0006457110 | Esophagus | ESCC | protein folding | 163/8552 | 212/18723 | 1.13e-20 | 1.74e-18 | 163 |
| GO:0006458110 | Esophagus | ESCC | 'de novo' protein folding | 36/8552 | 43/18723 | 2.90e-07 | 4.20e-06 | 36 |
| GO:0051084110 | Esophagus | ESCC | 'de novo' posttranslational protein folding | 32/8552 | 39/18723 | 3.27e-06 | 3.65e-05 | 32 |
| GO:000645712 | Liver | HCC | protein folding | 160/7958 | 212/18723 | 1.07e-22 | 1.88e-20 | 160 |
| Page: 1 2 3 |
| Pathway ID | Tissue | Disease Stage | Description | Gene Ratio | Bg Ratio | pvalue | p.adjust | qvalue | Count |
| Page: 1 |
Top |
Cell-cell communication analysis |
| Identification of potential cell-cell interactions between two cell types and their ligand-receptor pairs for different disease states |
| Ligand | Receptor | LRpair | Pathway | Tissue | Disease Stage |
| Page: 1 |
Top |
Single-cell gene regulatory network inference analysis |
| Find out the significant the regulons (TFs) and the target genes of each regulon across cell types for different disease states |
| TF | Cell Type | Tissue | Disease Stage | Target Gene | RSS | Regulon Activity |
| ∗The dot plots of a searched regulon are shown for all cell subpopulations in each disease state of each tissue based on the regulon specific score inferred using pySCENIC and by calculating the average expression. |
| Page: 1 |
Top |
Somatic mutation of malignant transformation related genes |
| Annotation of somatic variants for genes involved in malignant transformation |
| Hugo Symbol | Variant Class | Variant Classification | dbSNP RS | HGVSc | HGVSp | HGVSp Short | SWISSPROT | BIOTYPE | SIFT | PolyPhen | Tumor Sample Barcode | Tissue | Histology | Sex | Age | Stage | Therapy Types | Drugs | Outcome |
| SELENOF | SNV | Missense_Mutation | rs375315291 | c.23N>T | p.Pro8Leu | p.P8L | protein_coding | tolerated_low_confidence(0.24) | benign(0) | TCGA-AO-A128-01 | Breast | breast invasive carcinoma | Female | <65 | I/II | Chemotherapy | doxorubicin | SD | |
| SELENOF | SNV | Missense_Mutation | novel | c.92N>T | p.Ala31Val | p.A31V | protein_coding | tolerated(0.42) | benign(0.001) | TCGA-AP-A1DV-01 | Endometrium | uterine corpus endometrioid carcinoma | Female | <65 | I/II | Unknown | Unknown | SD | |
| SELENOF | SNV | Missense_Mutation | novel | c.337N>T | p.Pro113Ser | p.P113S | protein_coding | deleterious(0.01) | possibly_damaging(0.617) | TCGA-AX-A0J1-01 | Endometrium | uterine corpus endometrioid carcinoma | Female | >=65 | I/II | Unknown | Unknown | SD | |
| SELENOF | SNV | Missense_Mutation | c.463G>C | p.Glu155Gln | p.E155Q | protein_coding | tolerated(0.11) | probably_damaging(0.987) | TCGA-95-7944-01 | Lung | lung adenocarcinoma | Male | >=65 | I/II | Unknown | Unknown | SD | ||
| SELENOF | SNV | Missense_Mutation | novel | c.40C>T | p.Pro14Ser | p.P14S | protein_coding | deleterious_low_confidence(0) | benign(0.006) | TCGA-XK-AAIW-01 | Prostate | prostate adenocarcinoma | Male | >=65 | 9 | Unknown | Unknown | PD | |
| SELENOF | SNV | Missense_Mutation | novel | c.449N>G | p.Asn150Ser | p.N150S | protein_coding | deleterious(0.01) | probably_damaging(0.995) | TCGA-VQ-A8P2-01 | Stomach | stomach adenocarcinoma | Male | >=65 | III/IV | Unspecific | Complete Response | ||
| SELENOF | SNV | Missense_Mutation | novel | c.443N>G | p.Lys148Arg | p.K148R | protein_coding | tolerated(0.07) | probably_damaging(0.996) | TCGA-VQ-A8PO-01 | Stomach | stomach adenocarcinoma | Male | >=65 | I/II | Unknown | Unknown | PD |
| Page: 1 |
Top |
Related drugs of malignant transformation related genes |
| Identification of chemicals and drugs interact with genes involved in malignant transfromation |
| (DGIdb 4.0) |
| Entrez ID | Symbol | Category | Interaction Types | Drug Claim Name | Drug Name | PMIDs |
| Page: 1 |

Copyright 2023-Present -The University of Texas Health Science Center at Houston |