
|
|||||
|
 | |
| |
| |
| |
| |
| |
|
Gene: SELENBP1 |
Gene summary for SELENBP1 |
| Gene information | Species | Human | Gene symbol | SELENBP1 | Gene ID | 8991 |
| Gene name | selenium binding protein 1 | |
| Gene Alias | EHMTO | |
| Cytomap | 1q21.3 | |
| Gene Type | protein-coding | GO ID | GO:0006810 | UniProtAcc | Q13228 |
Top |
Malignant transformation analysis |
| Identification of the aberrant gene expression in precancerous and cancerous lesions by comparing the gene expression of stem-like cells in diseased tissues with normal stem cells |
| Entrez ID | Symbol | Replicates | Species | Organ | Tissue | Adj P-value | Log2FC | Malignancy |
| 8991 | SELENBP1 | GSM4909282 | Human | Breast | IDC | 6.03e-03 | -1.90e-01 | -0.0288 |
| 8991 | SELENBP1 | GSM4909285 | Human | Breast | IDC | 4.26e-03 | 2.43e-01 | 0.21 |
| 8991 | SELENBP1 | GSM4909286 | Human | Breast | IDC | 1.67e-05 | -2.21e-01 | 0.1081 |
| 8991 | SELENBP1 | GSM4909293 | Human | Breast | IDC | 3.49e-11 | 4.17e-01 | 0.1581 |
| 8991 | SELENBP1 | GSM4909294 | Human | Breast | IDC | 3.96e-04 | 3.09e-01 | 0.2022 |
| 8991 | SELENBP1 | GSM4909296 | Human | Breast | IDC | 7.29e-05 | 1.43e-01 | 0.1524 |
| 8991 | SELENBP1 | GSM4909297 | Human | Breast | IDC | 3.95e-06 | -6.13e-02 | 0.1517 |
| 8991 | SELENBP1 | GSM4909301 | Human | Breast | IDC | 6.13e-04 | -1.87e-01 | 0.1577 |
| 8991 | SELENBP1 | GSM4909311 | Human | Breast | IDC | 6.98e-15 | 2.49e-02 | 0.1534 |
| 8991 | SELENBP1 | GSM4909312 | Human | Breast | IDC | 6.28e-05 | 9.15e-02 | 0.1552 |
| 8991 | SELENBP1 | GSM4909319 | Human | Breast | IDC | 3.19e-24 | 2.14e-02 | 0.1563 |
| 8991 | SELENBP1 | GSM4909321 | Human | Breast | IDC | 2.63e-10 | 2.92e-01 | 0.1559 |
| 8991 | SELENBP1 | ctrl6 | Human | Breast | Precancer | 2.26e-02 | -2.48e-01 | -0.0061 |
| 8991 | SELENBP1 | brca1 | Human | Breast | Precancer | 3.36e-05 | -2.28e-01 | -0.0338 |
| 8991 | SELENBP1 | brca10 | Human | Breast | Precancer | 1.23e-04 | -2.27e-01 | -0.0029 |
| 8991 | SELENBP1 | M5 | Human | Breast | IDC | 3.33e-03 | 6.21e-01 | 0.1598 |
| 8991 | SELENBP1 | NCCBC14 | Human | Breast | DCIS | 6.42e-04 | 1.09e-01 | 0.2021 |
| 8991 | SELENBP1 | NCCBC5 | Human | Breast | DCIS | 1.24e-04 | -1.03e-01 | 0.2046 |
| 8991 | SELENBP1 | P1 | Human | Breast | IDC | 4.63e-03 | -9.90e-02 | 0.1527 |
| 8991 | SELENBP1 | DCIS2 | Human | Breast | DCIS | 7.83e-22 | -7.09e-02 | 0.0085 |
| Page: 1 2 3 4 5 6 7 8 |
| Tissue | Expression Dynamics | Abbreviation |
| Breast | 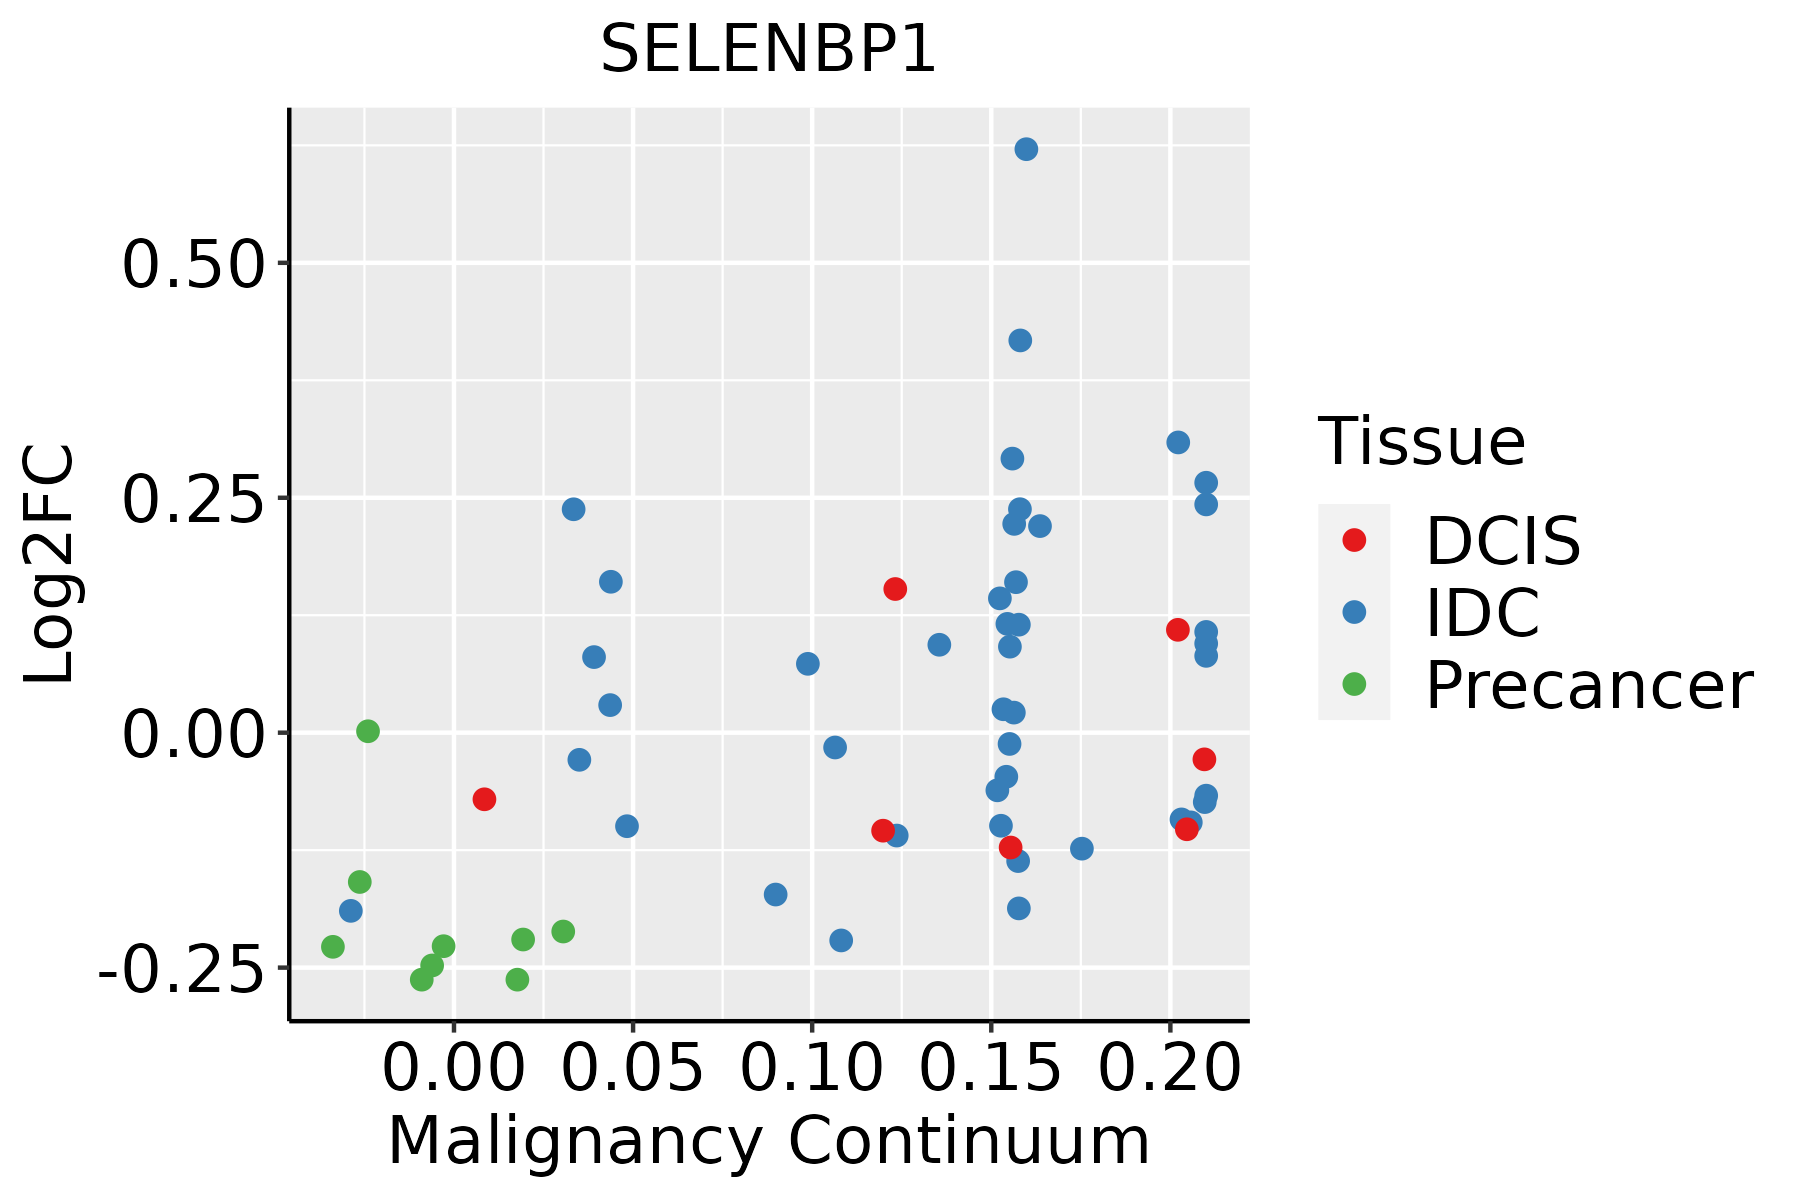 | IDC: Invasive ductal carcinoma |
| DCIS: Ductal carcinoma in situ | ||
| Precancer(BRCA1-mut): Precancerous lesion from BRCA1 mutation carriers | ||
| Colorectum (GSE201348) |  | FAP: Familial adenomatous polyposis |
| CRC: Colorectal cancer | ||
| Colorectum (HTA11) |  | AD: Adenomas |
| SER: Sessile serrated lesions | ||
| MSI-H: Microsatellite-high colorectal cancer | ||
| MSS: Microsatellite stable colorectal cancer | ||
| Esophagus | 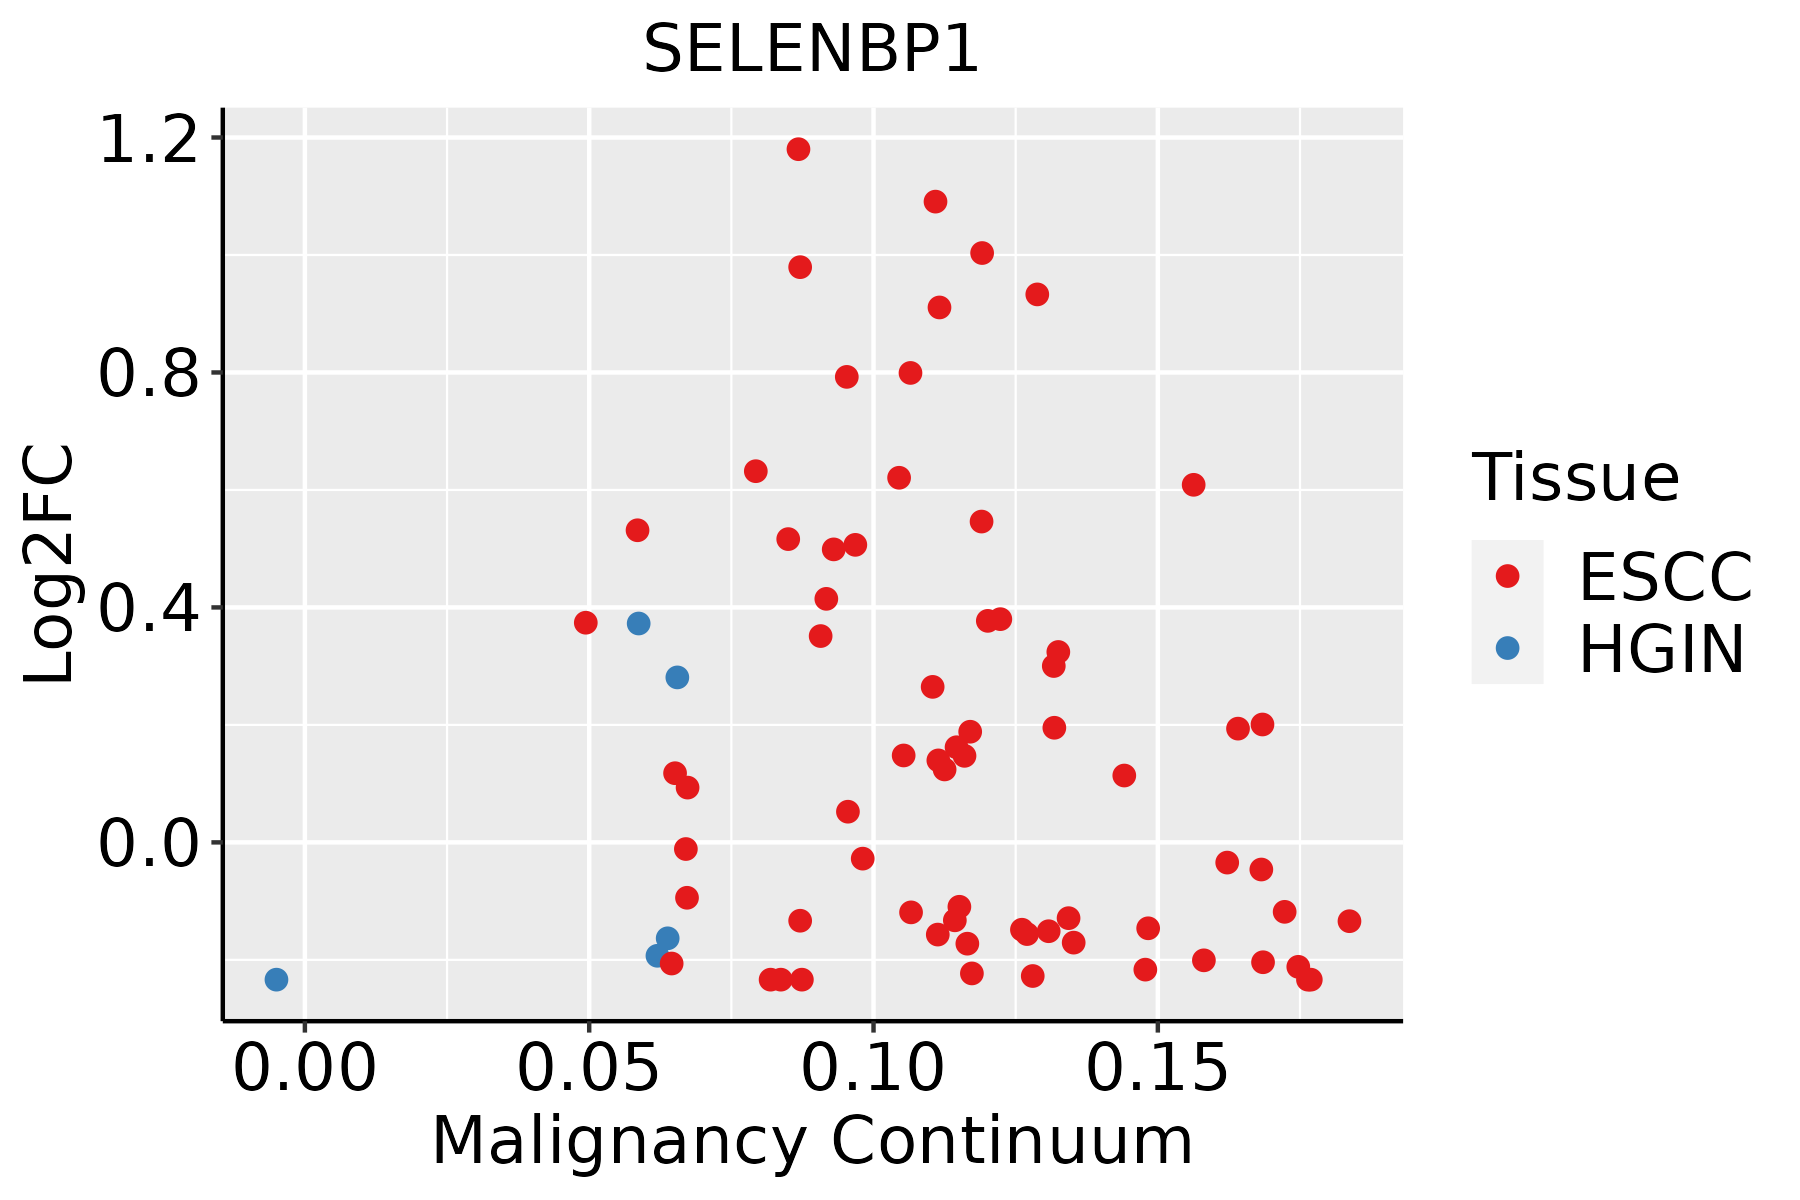 | ESCC: Esophageal squamous cell carcinoma |
| HGIN: High-grade intraepithelial neoplasias | ||
| LGIN: Low-grade intraepithelial neoplasias | ||
| Liver | 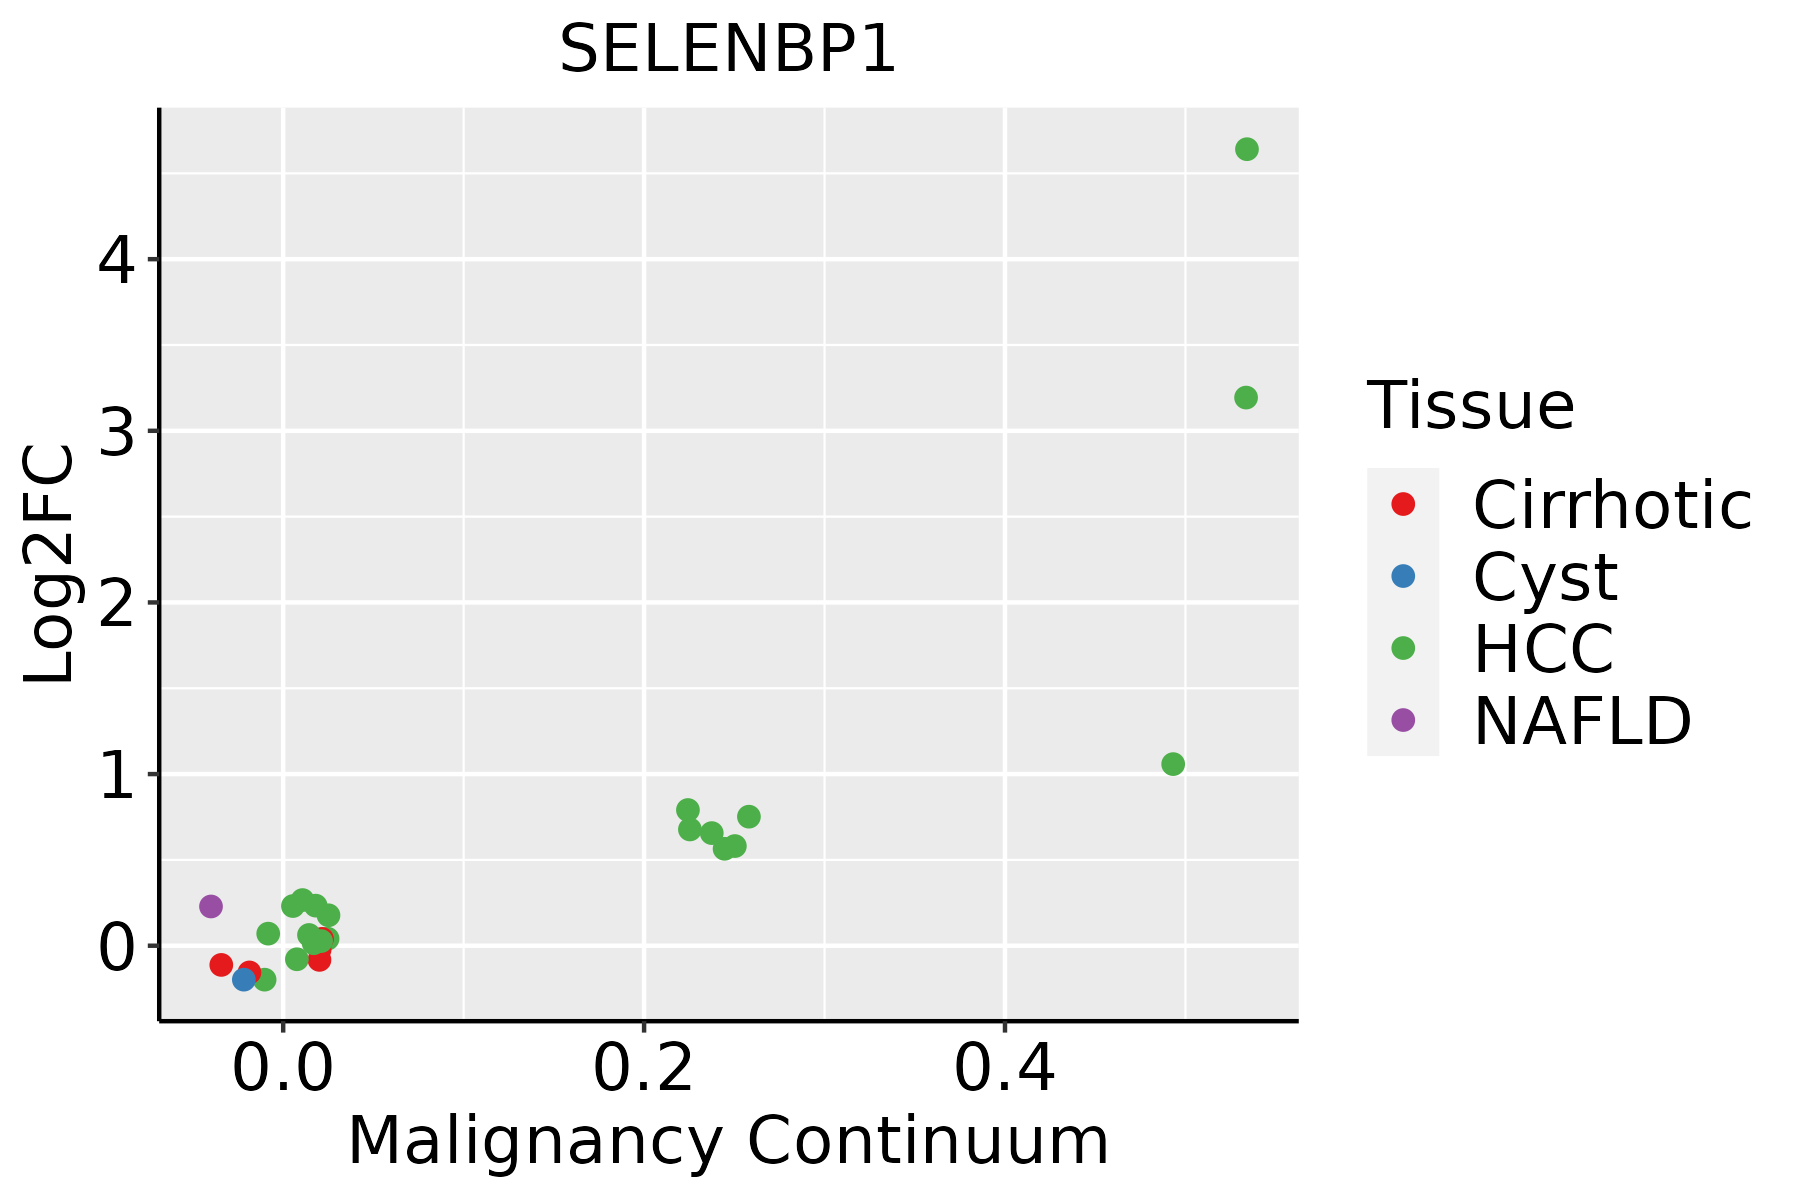 | HCC: Hepatocellular carcinoma |
| NAFLD: Non-alcoholic fatty liver disease | ||
| Lung |  | AAH: Atypical adenomatous hyperplasia |
| AIS: Adenocarcinoma in situ | ||
| IAC: Invasive lung adenocarcinoma | ||
| MIA: Minimally invasive adenocarcinoma | ||
| Oral Cavity | 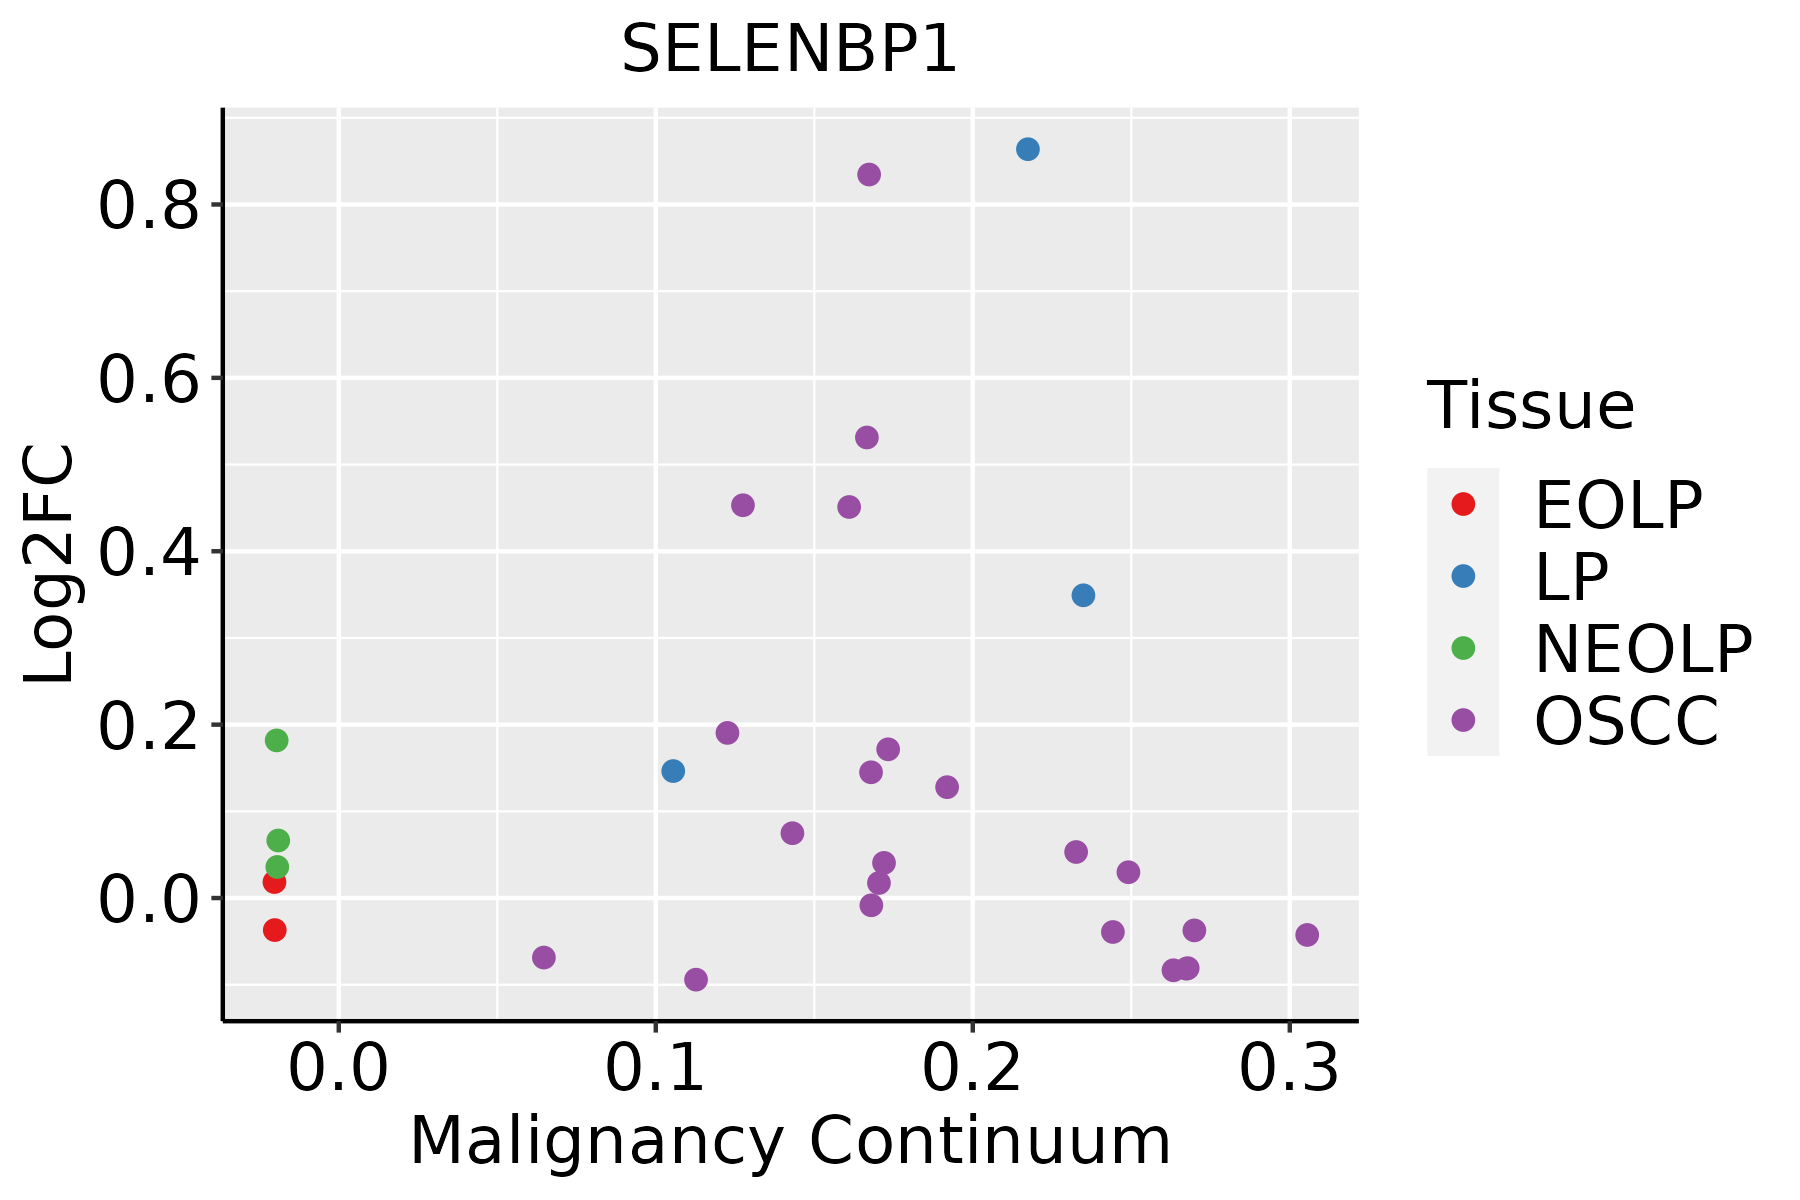 | EOLP: Erosive Oral lichen planus |
| LP: leukoplakia | ||
| NEOLP: Non-erosive oral lichen planus | ||
| OSCC: Oral squamous cell carcinoma | ||
| Prostate | 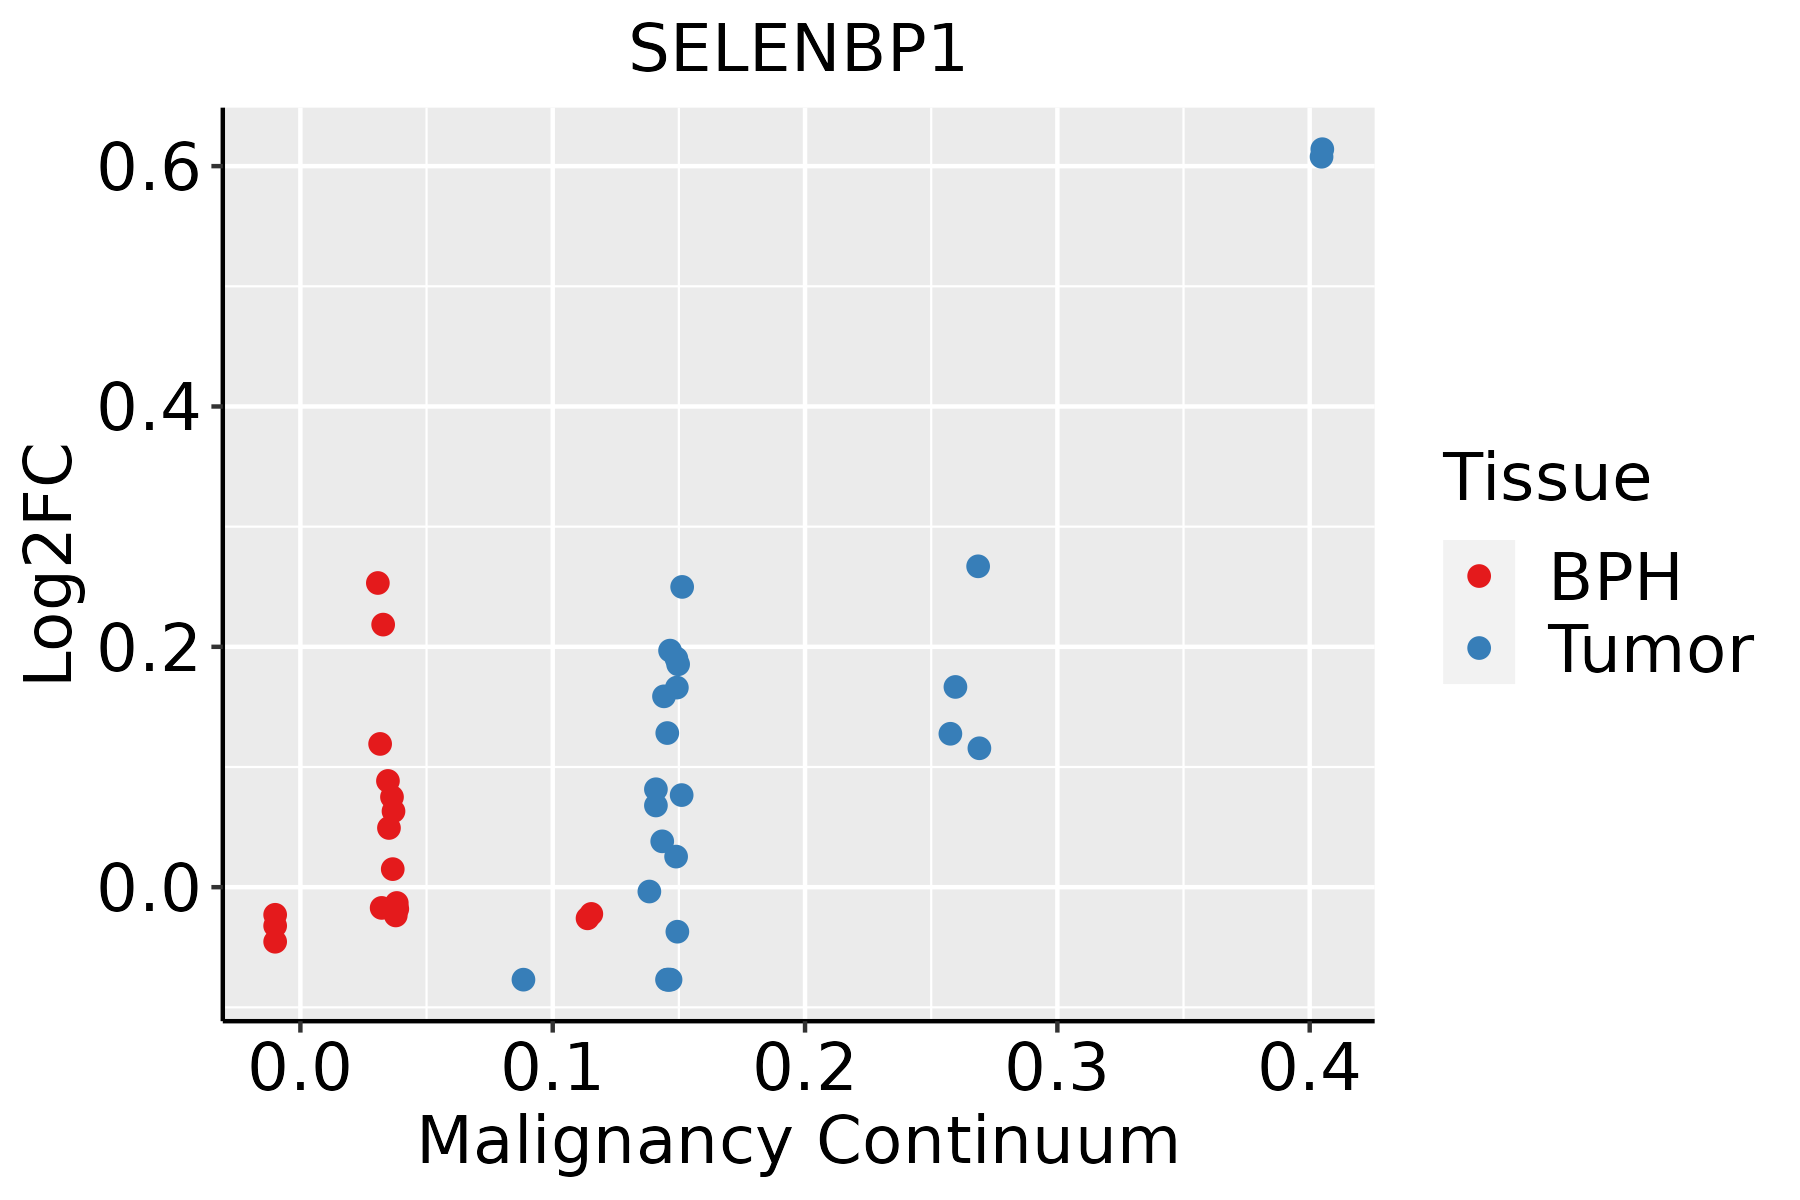 | BPH: Benign Prostatic Hyperplasia |
| Thyroid |  | ATC: Anaplastic thyroid cancer |
| HT: Hashimoto's thyroiditis | ||
| PTC: Papillary thyroid cancer |
| ∗log2FC in expression of this searched gene in stem-like cells from each diseased tissue sample relative to stem-like cells in normal samples in each tissue plotted against the malignancy continuum. Samples are colored based on if they are from different disease stage. |
Top |
Malignant transformation related pathway analysis |
| Find out the enriched GO biological processes and KEGG pathways involved in transition from healthy to precancer to cancer |
| Tissue | Disease Stage | Enriched GO biological Processes |
| Colorectum | AD |  |
| Colorectum | SER |  |
| Colorectum | MSS |  |
| Colorectum | MSI-H |  |
| Colorectum | FAP |  |
| ∗Top 15 enriched GO BP terms are showed in the bar plot of each disease state in each tissue. Each row represents a significant GO biological process which is colored according to the -log10(p.adjust). |
| Page: 1 2 3 4 5 6 7 8 9 |
| GO ID | Tissue | Disease Stage | Description | Gene Ratio | Bg Ratio | pvalue | p.adjust | Count |
| Page: 1 |
| Pathway ID | Tissue | Disease Stage | Description | Gene Ratio | Bg Ratio | pvalue | p.adjust | qvalue | Count |
| hsa00920 | Colorectum | AD | Sulfur metabolism | 8/2092 | 10/8465 | 3.78e-04 | 2.82e-03 | 1.80e-03 | 8 |
| hsa009201 | Colorectum | AD | Sulfur metabolism | 8/2092 | 10/8465 | 3.78e-04 | 2.82e-03 | 1.80e-03 | 8 |
| hsa009202 | Colorectum | SER | Sulfur metabolism | 8/1580 | 10/8465 | 4.56e-05 | 5.22e-04 | 3.79e-04 | 8 |
| hsa009203 | Colorectum | SER | Sulfur metabolism | 8/1580 | 10/8465 | 4.56e-05 | 5.22e-04 | 3.79e-04 | 8 |
| hsa009206 | Colorectum | FAP | Sulfur metabolism | 6/1404 | 10/8465 | 2.36e-03 | 1.13e-02 | 6.85e-03 | 6 |
| hsa009207 | Colorectum | FAP | Sulfur metabolism | 6/1404 | 10/8465 | 2.36e-03 | 1.13e-02 | 6.85e-03 | 6 |
| hsa009208 | Colorectum | CRC | Sulfur metabolism | 5/1091 | 10/8465 | 5.07e-03 | 2.72e-02 | 1.84e-02 | 5 |
| hsa009209 | Colorectum | CRC | Sulfur metabolism | 5/1091 | 10/8465 | 5.07e-03 | 2.72e-02 | 1.84e-02 | 5 |
| hsa0092010 | Esophagus | ESCC | Sulfur metabolism | 9/4205 | 10/8465 | 1.01e-02 | 2.38e-02 | 1.22e-02 | 9 |
| hsa0092011 | Esophagus | ESCC | Sulfur metabolism | 9/4205 | 10/8465 | 1.01e-02 | 2.38e-02 | 1.22e-02 | 9 |
| Page: 1 |
Top |
Cell-cell communication analysis |
| Identification of potential cell-cell interactions between two cell types and their ligand-receptor pairs for different disease states |
| Ligand | Receptor | LRpair | Pathway | Tissue | Disease Stage |
| Page: 1 |
Top |
Single-cell gene regulatory network inference analysis |
| Find out the significant the regulons (TFs) and the target genes of each regulon across cell types for different disease states |
| TF | Cell Type | Tissue | Disease Stage | Target Gene | RSS | Regulon Activity |
| ∗The dot plots of a searched regulon are shown for all cell subpopulations in each disease state of each tissue based on the regulon specific score inferred using pySCENIC and by calculating the average expression. |
| Page: 1 |
Top |
Somatic mutation of malignant transformation related genes |
| Annotation of somatic variants for genes involved in malignant transformation |
| Hugo Symbol | Variant Class | Variant Classification | dbSNP RS | HGVSc | HGVSp | HGVSp Short | SWISSPROT | BIOTYPE | SIFT | PolyPhen | Tumor Sample Barcode | Tissue | Histology | Sex | Age | Stage | Therapy Types | Drugs | Outcome |
| SELENBP1 | SNV | Missense_Mutation | rs756477901 | c.929N>A | p.Cys310Tyr | p.C310Y | Q13228 | protein_coding | deleterious(0) | probably_damaging(0.983) | TCGA-B6-A400-01 | Breast | breast invasive carcinoma | Female | <65 | III/IV | Unknown | Unknown | SD |
| SELENBP1 | SNV | Missense_Mutation | novel | c.15N>C | p.Trp5Cys | p.W5C | Q13228 | protein_coding | deleterious_low_confidence(0) | benign(0.028) | TCGA-BH-A0RX-01 | Breast | breast invasive carcinoma | Female | <65 | I/II | Chemotherapy | fluorouracil | SD |
| SELENBP1 | SNV | Missense_Mutation | novel | c.733G>A | p.Glu245Lys | p.E245K | Q13228 | protein_coding | deleterious(0) | possibly_damaging(0.615) | TCGA-PE-A5DE-01 | Breast | breast invasive carcinoma | Female | <65 | I/II | Chemotherapy | taxotere | CR |
| SELENBP1 | SNV | Missense_Mutation | rs765918794 | c.953G>A | p.Arg318His | p.R318H | Q13228 | protein_coding | tolerated(0.43) | benign(0.019) | TCGA-2W-A8YY-01 | Cervix | cervical & endocervical cancer | Female | <65 | I/II | Chemotherapy | cisplatin | CR |
| SELENBP1 | SNV | Missense_Mutation | c.1500N>T | p.Glu500Asp | p.E500D | Q13228 | protein_coding | tolerated(0.06) | probably_damaging(0.997) | TCGA-EK-A2RN-01 | Cervix | cervical & endocervical cancer | Female | <65 | I/II | Unknown | Unknown | SD | |
| SELENBP1 | SNV | Missense_Mutation | c.1097N>C | p.Phe366Ser | p.F366S | Q13228 | protein_coding | deleterious(0.02) | possibly_damaging(0.908) | TCGA-AA-3492-01 | Colorectum | colon adenocarcinoma | Female | >=65 | I/II | Unknown | Unknown | SD | |
| SELENBP1 | SNV | Missense_Mutation | novel | c.1151N>T | p.Arg384Ile | p.R384I | Q13228 | protein_coding | deleterious(0.03) | possibly_damaging(0.642) | TCGA-CA-6717-01 | Colorectum | colon adenocarcinoma | Male | <65 | I/II | Chemotherapy | oxaliplatin | CR |
| SELENBP1 | SNV | Missense_Mutation | rs201828270 | c.710G>A | p.Arg237Gln | p.R237Q | Q13228 | protein_coding | deleterious(0.04) | probably_damaging(0.999) | TCGA-F5-6814-01 | Colorectum | rectum adenocarcinoma | Male | <65 | I/II | Unknown | Unknown | SD |
| SELENBP1 | SNV | Missense_Mutation | novel | c.837G>T | p.Glu279Asp | p.E279D | Q13228 | protein_coding | tolerated(0.13) | benign(0.364) | TCGA-A5-A1OF-01 | Endometrium | uterine corpus endometrioid carcinoma | Female | <65 | I/II | Unknown | Unknown | SD |
| SELENBP1 | SNV | Missense_Mutation | novel | c.941N>T | p.Ser314Phe | p.S314F | Q13228 | protein_coding | deleterious(0) | possibly_damaging(0.851) | TCGA-A5-A2K5-01 | Endometrium | uterine corpus endometrioid carcinoma | Female | >=65 | I/II | Unknown | Unknown | SD |
| Page: 1 2 3 4 5 |
Top |
Related drugs of malignant transformation related genes |
| Identification of chemicals and drugs interact with genes involved in malignant transfromation |
| (DGIdb 4.0) |
| Entrez ID | Symbol | Category | Interaction Types | Drug Claim Name | Drug Name | PMIDs |
| Page: 1 |

Copyright 2023-Present -The University of Texas Health Science Center at Houston |