| Tissue | Expression Dynamics | Abbreviation |
| Esophagus | 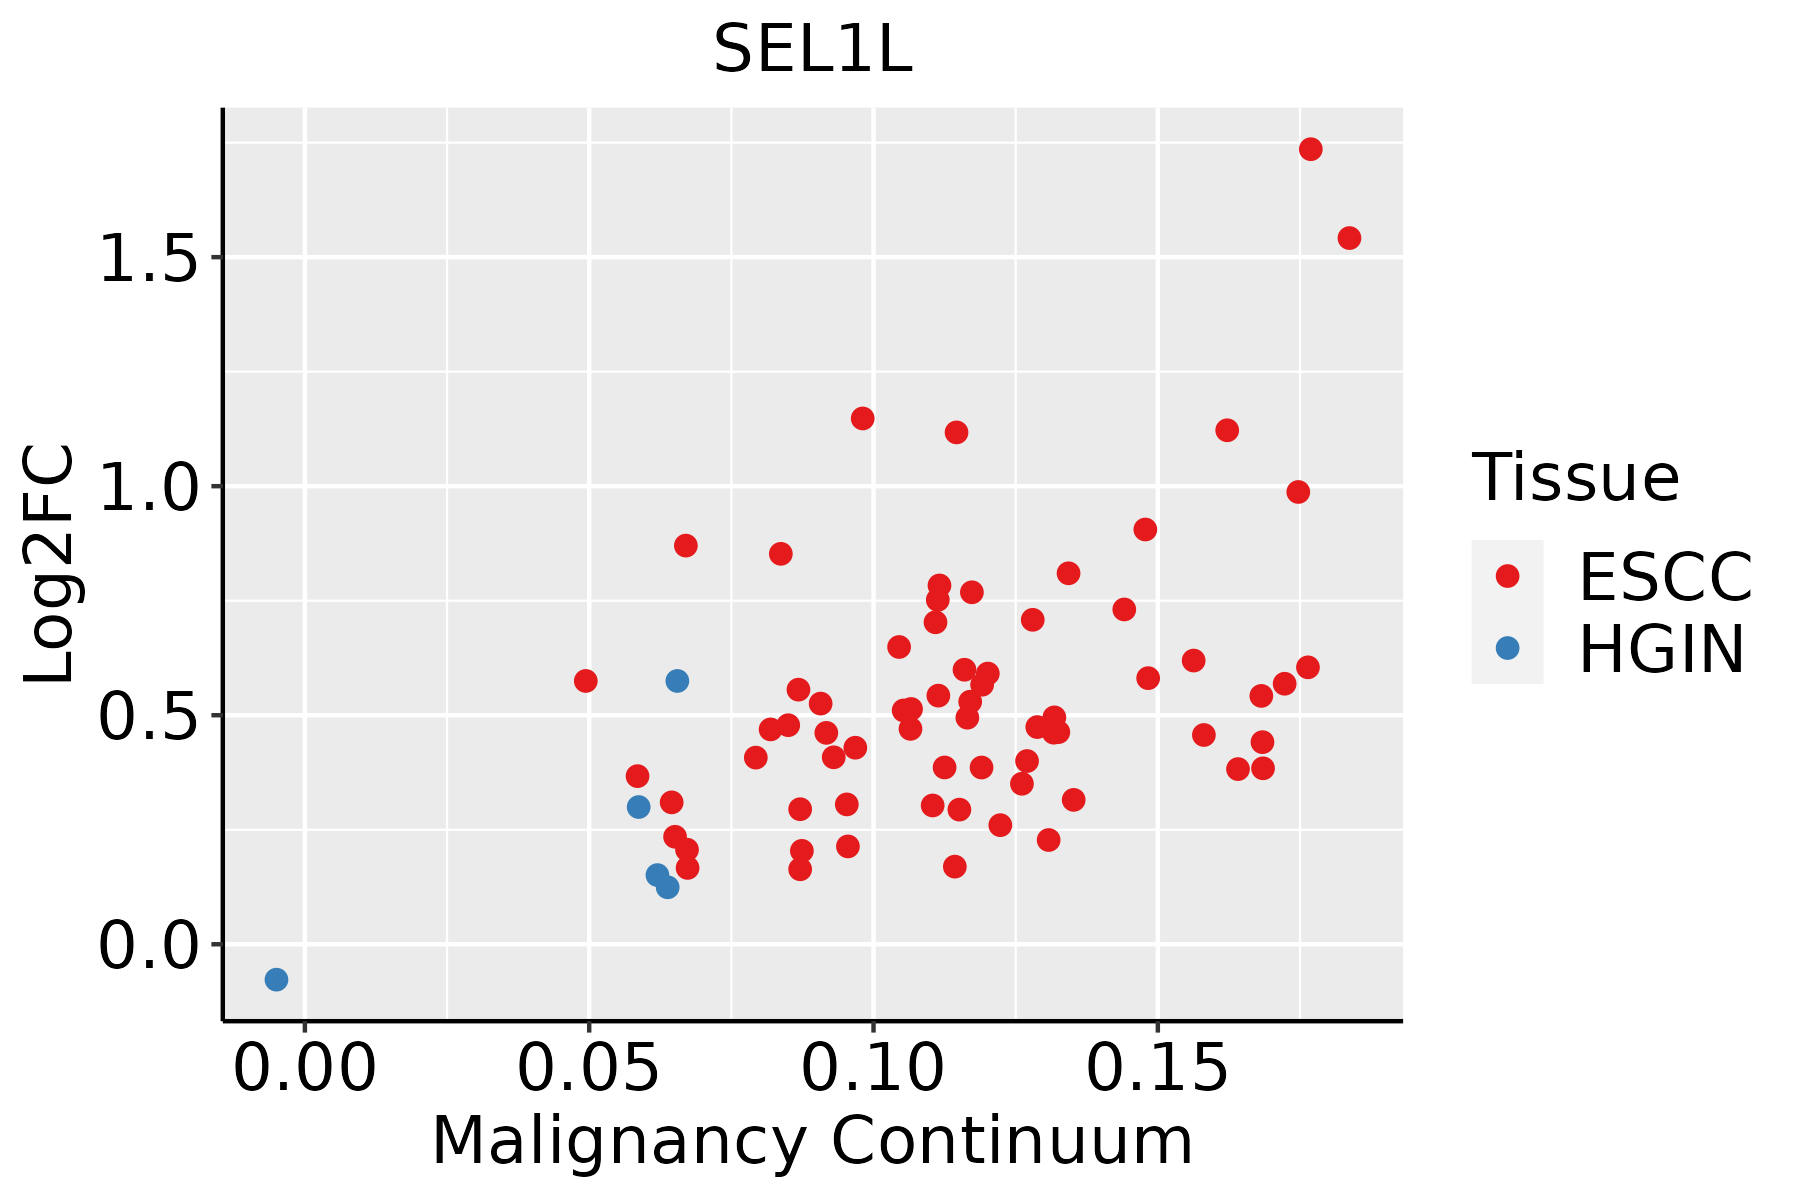 | ESCC: Esophageal squamous cell carcinoma |
| HGIN: High-grade intraepithelial neoplasias |
| LGIN: Low-grade intraepithelial neoplasias |
| Liver | 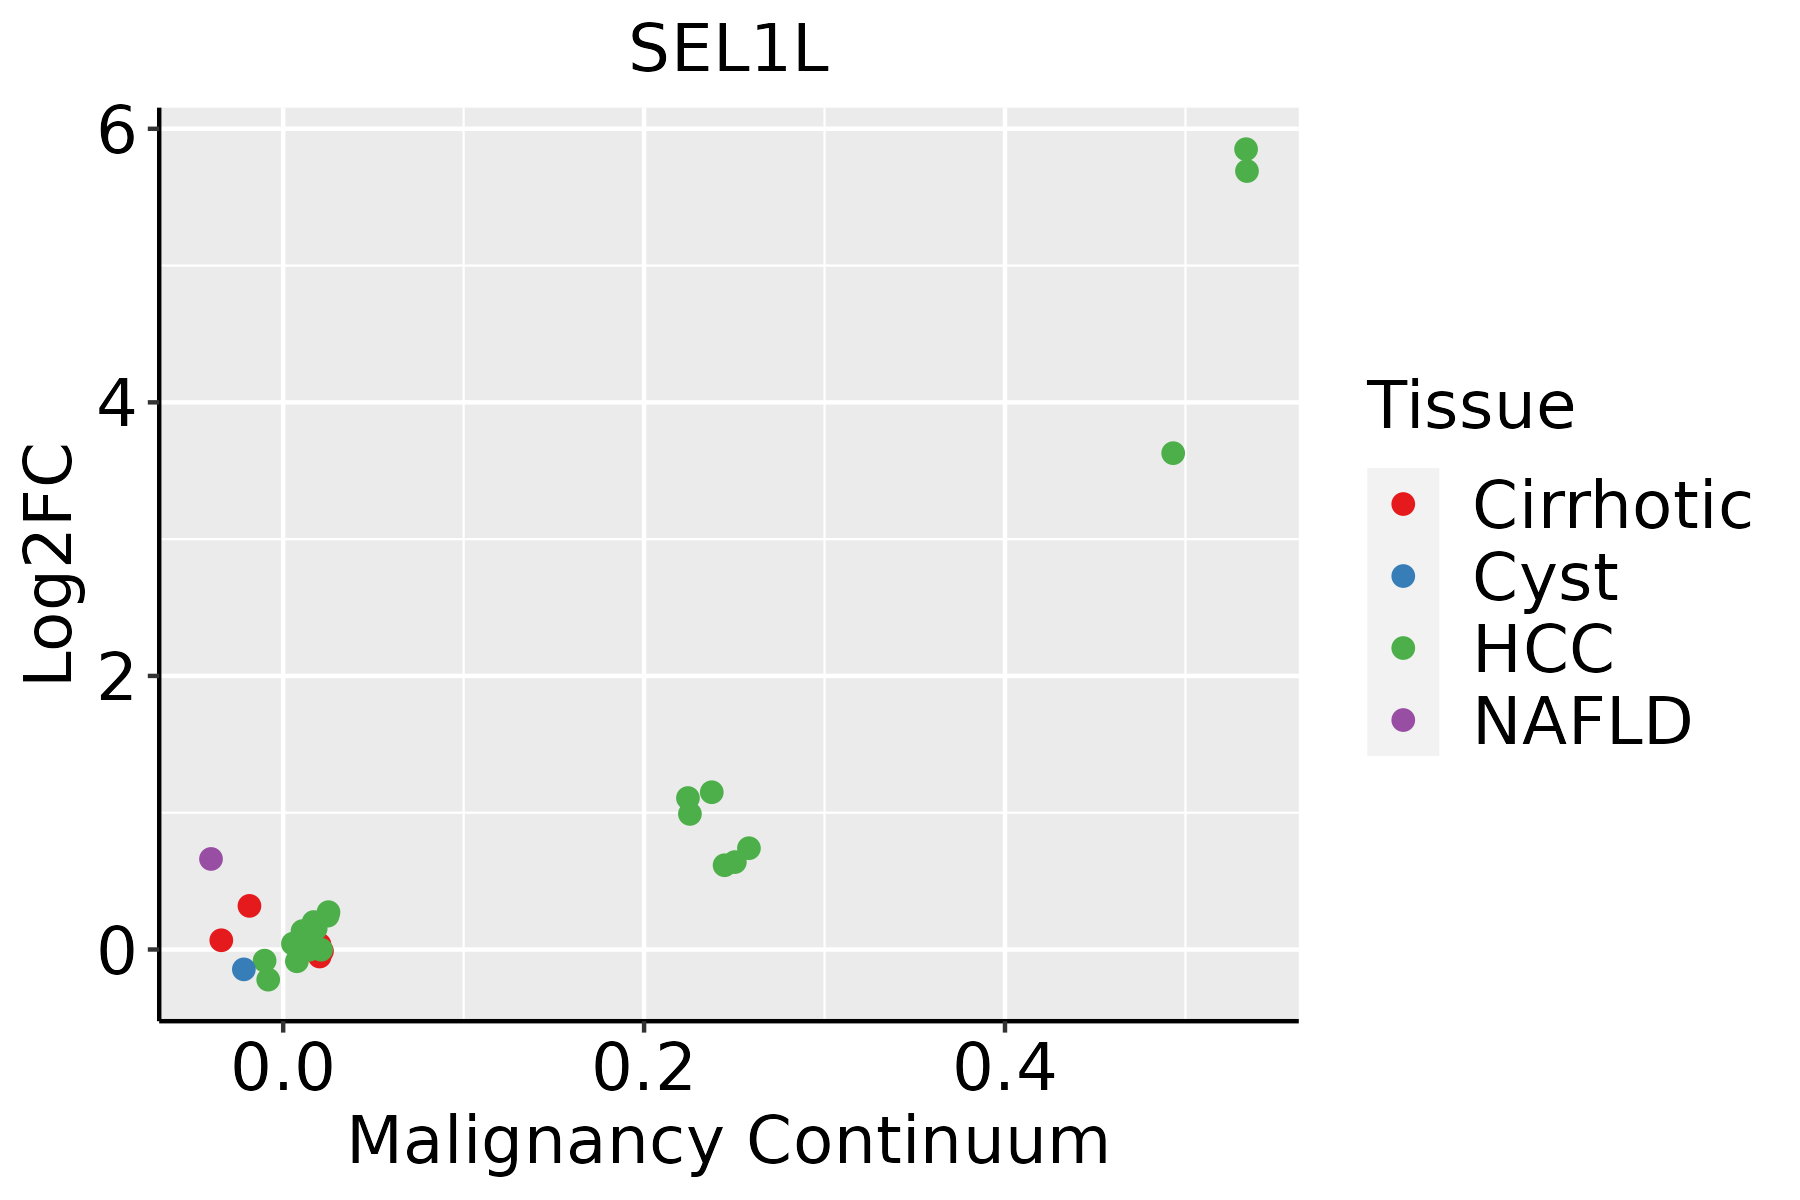 | HCC: Hepatocellular carcinoma |
| NAFLD: Non-alcoholic fatty liver disease |
| Oral Cavity | 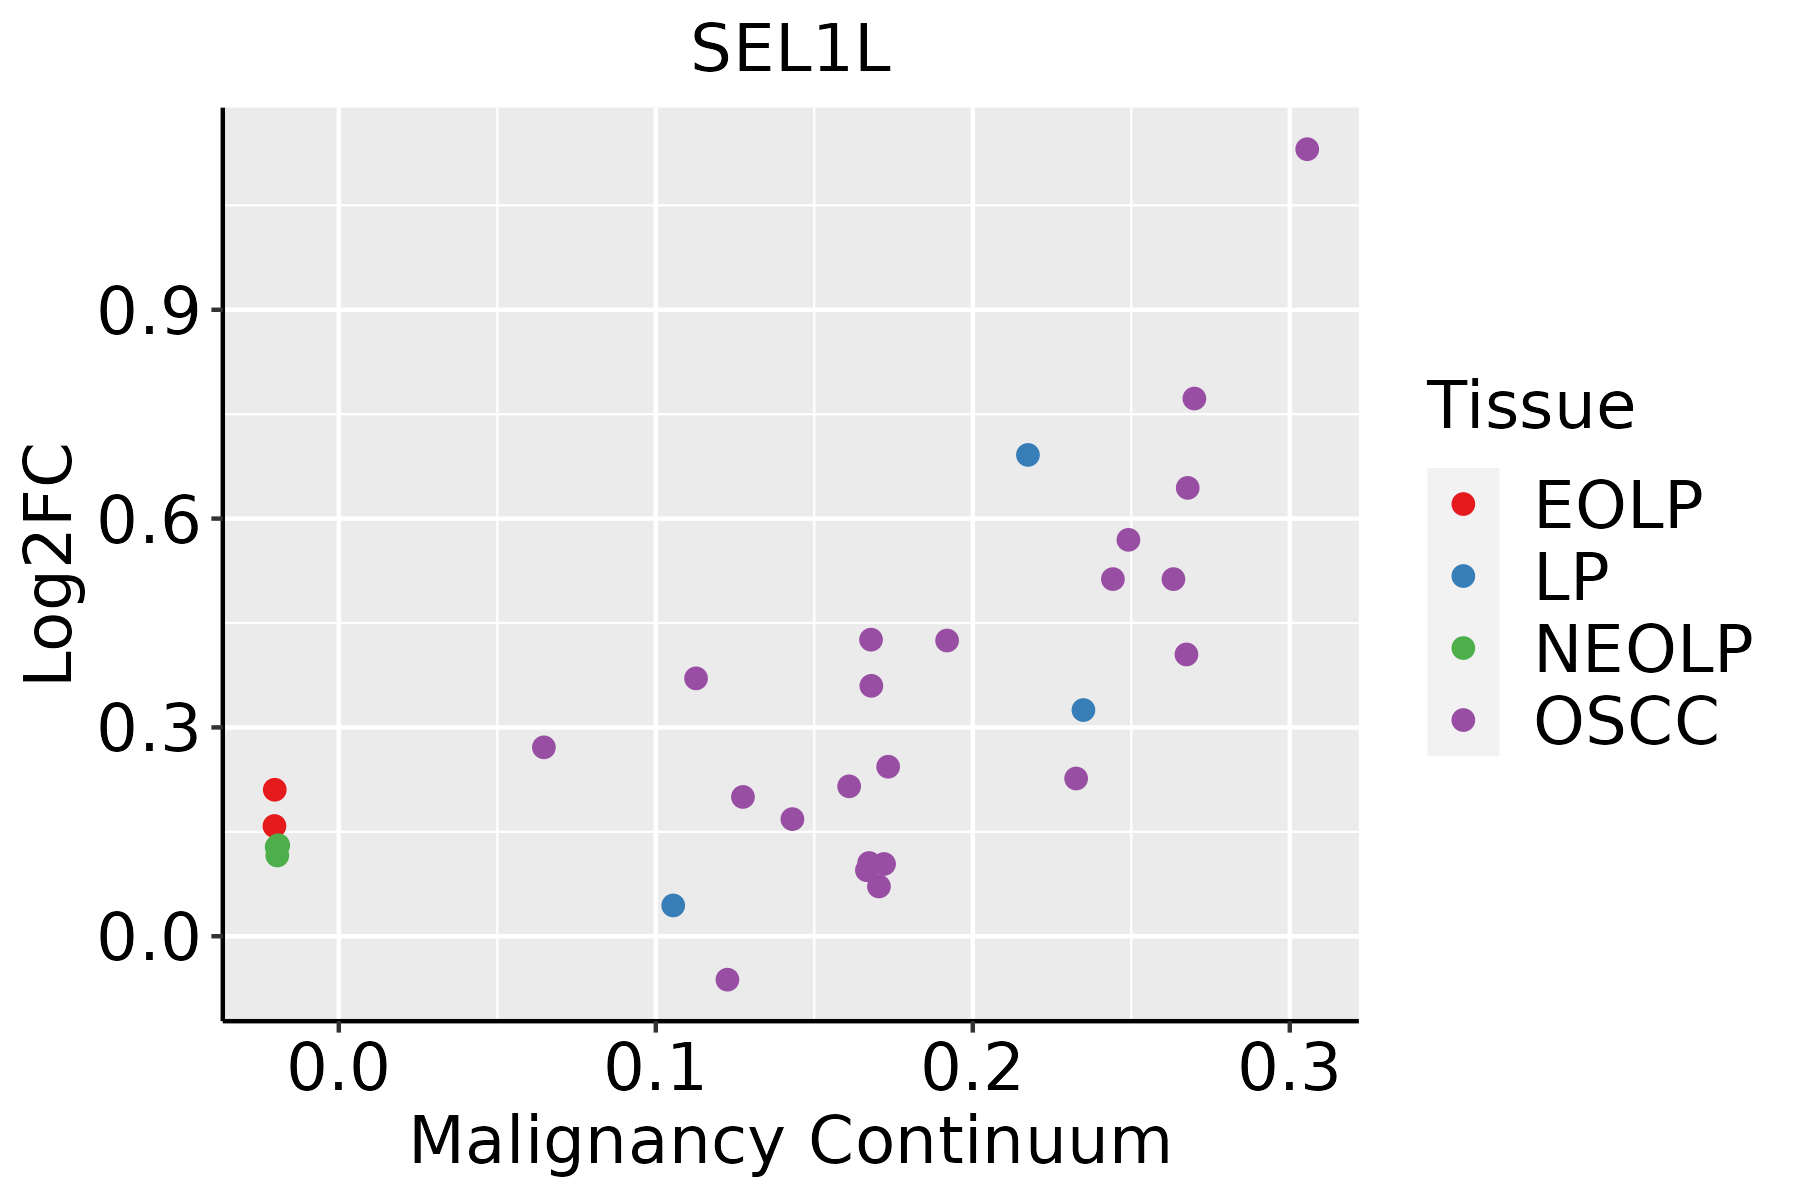 | EOLP: Erosive Oral lichen planus |
| LP: leukoplakia |
| NEOLP: Non-erosive oral lichen planus |
| OSCC: Oral squamous cell carcinoma |
| Prostate | 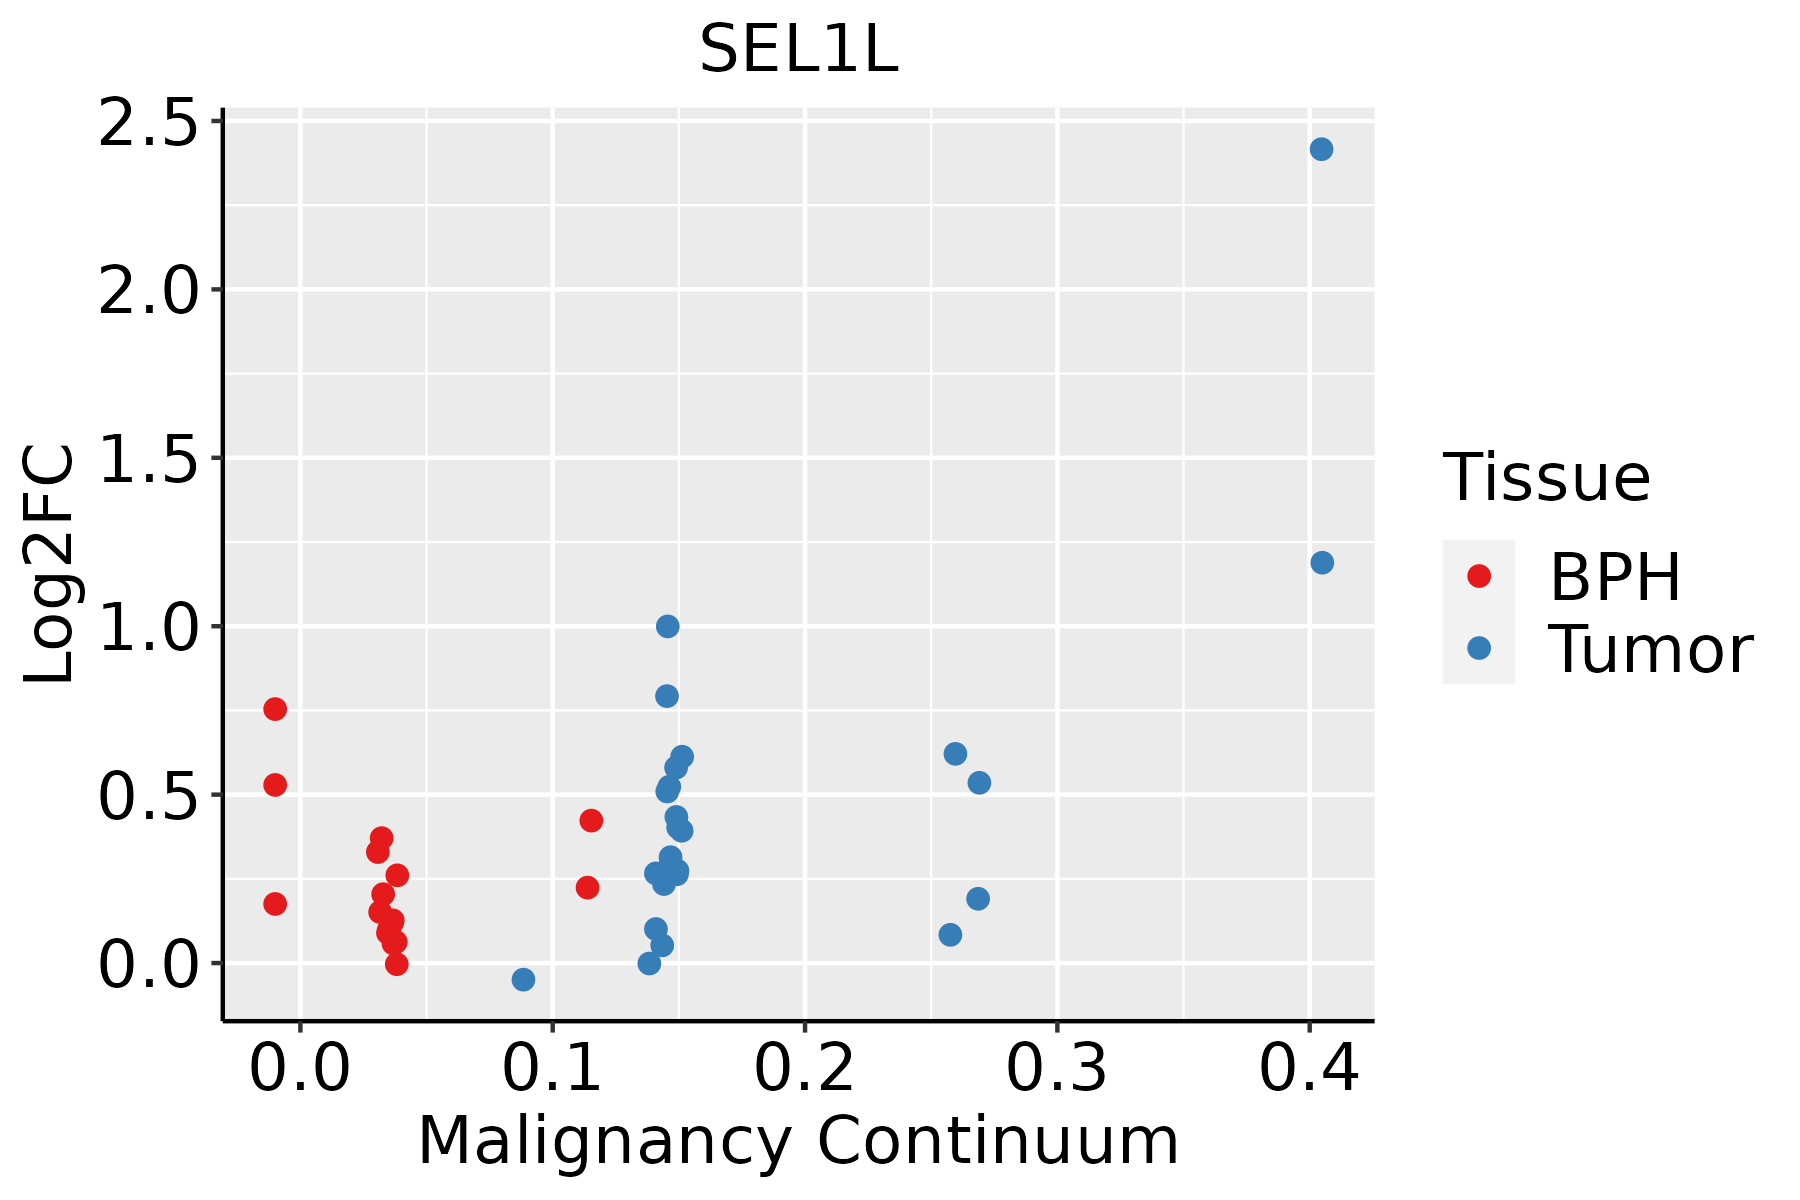 | BPH: Benign Prostatic Hyperplasia |
| Skin | 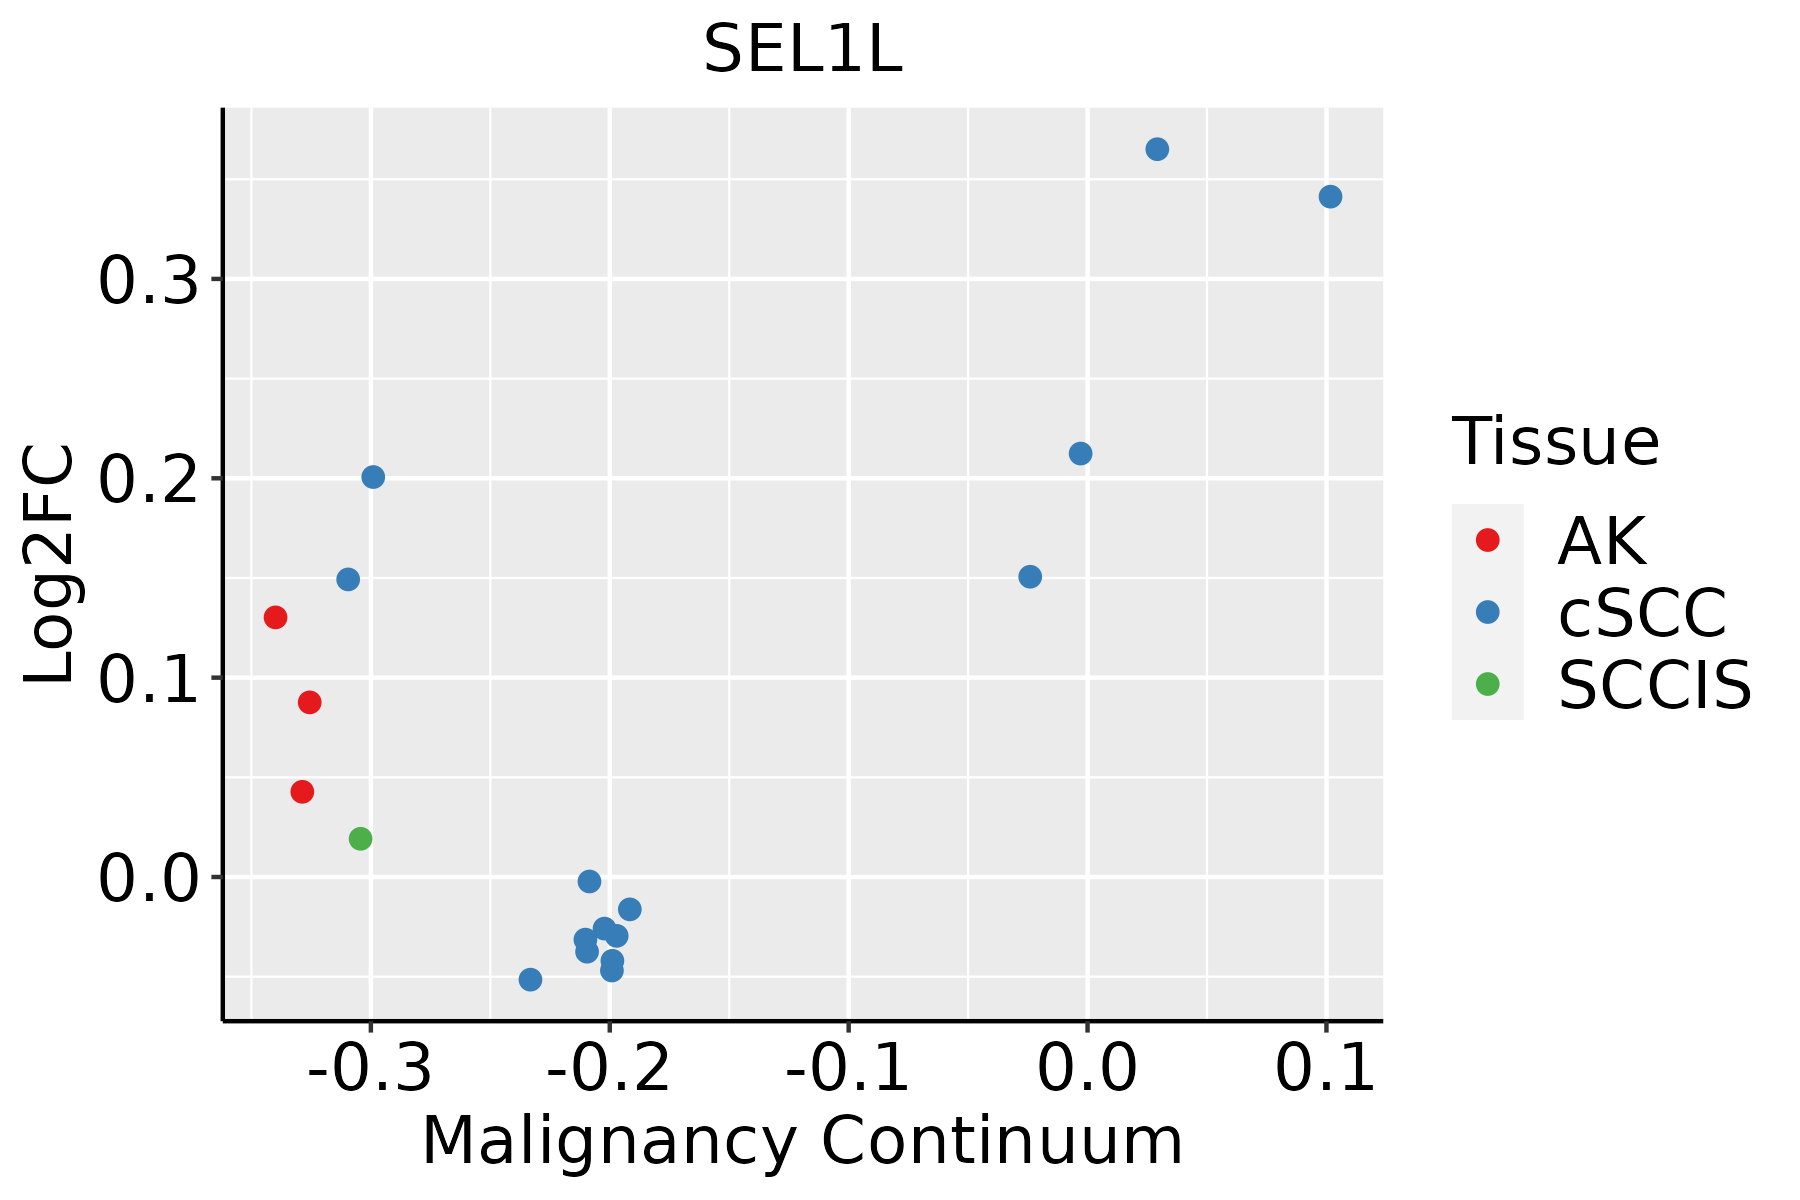 | AK: Actinic keratosis |
| cSCC: Cutaneous squamous cell carcinoma |
| SCCIS:squamous cell carcinoma in situ |
| Thyroid |  | ATC: Anaplastic thyroid cancer |
| HT: Hashimoto's thyroiditis |
| PTC: Papillary thyroid cancer |
| GO ID | Tissue | Disease Stage | Description | Gene Ratio | Bg Ratio | pvalue | p.adjust | Count |
| GO:0010498111 | Esophagus | ESCC | proteasomal protein catabolic process | 369/8552 | 490/18723 | 1.13e-41 | 1.80e-38 | 369 |
| GO:0043161111 | Esophagus | ESCC | proteasome-mediated ubiquitin-dependent protein catabolic process | 312/8552 | 412/18723 | 3.53e-36 | 4.48e-33 | 312 |
| GO:0031647111 | Esophagus | ESCC | regulation of protein stability | 223/8552 | 298/18723 | 5.76e-25 | 1.52e-22 | 223 |
| GO:0034976111 | Esophagus | ESCC | response to endoplasmic reticulum stress | 192/8552 | 256/18723 | 7.15e-22 | 1.30e-19 | 192 |
| GO:0050821111 | Esophagus | ESCC | protein stabilization | 140/8552 | 191/18723 | 6.50e-15 | 3.61e-13 | 140 |
| GO:003650315 | Esophagus | ESCC | ERAD pathway | 82/8552 | 107/18723 | 5.80e-11 | 1.84e-09 | 82 |
| GO:003043314 | Esophagus | ESCC | ubiquitin-dependent ERAD pathway | 66/8552 | 85/18723 | 1.64e-09 | 3.78e-08 | 66 |
| GO:003252714 | Esophagus | ESCC | protein exit from endoplasmic reticulum | 37/8552 | 48/18723 | 8.99e-06 | 8.65e-05 | 37 |
| GO:00072197 | Esophagus | ESCC | Notch signaling pathway | 106/8552 | 172/18723 | 1.74e-05 | 1.55e-04 | 106 |
| GO:003097014 | Esophagus | ESCC | retrograde protein transport, ER to cytosol | 23/8552 | 29/18723 | 2.25e-04 | 1.40e-03 | 23 |
| GO:190351314 | Esophagus | ESCC | endoplasmic reticulum to cytosol transport | 23/8552 | 29/18723 | 2.25e-04 | 1.40e-03 | 23 |
| GO:00464864 | Esophagus | ESCC | glycerolipid metabolic process | 211/8552 | 392/18723 | 6.51e-04 | 3.46e-03 | 211 |
| GO:000930617 | Esophagus | ESCC | protein secretion | 190/8552 | 359/18723 | 3.22e-03 | 1.34e-02 | 190 |
| GO:003559217 | Esophagus | ESCC | establishment of protein localization to extracellular region | 190/8552 | 360/18723 | 3.77e-03 | 1.53e-02 | 190 |
| GO:007169210 | Esophagus | ESCC | protein localization to extracellular region | 193/8552 | 368/18723 | 5.01e-03 | 1.92e-02 | 193 |
| GO:00431617 | Liver | NAFLD | proteasome-mediated ubiquitin-dependent protein catabolic process | 91/1882 | 412/18723 | 3.00e-13 | 1.75e-10 | 91 |
| GO:00104987 | Liver | NAFLD | proteasomal protein catabolic process | 101/1882 | 490/18723 | 1.35e-12 | 6.09e-10 | 101 |
| GO:00316477 | Liver | NAFLD | regulation of protein stability | 61/1882 | 298/18723 | 5.00e-08 | 4.71e-06 | 61 |
| GO:00066413 | Liver | NAFLD | triglyceride metabolic process | 29/1882 | 100/18723 | 9.51e-08 | 7.62e-06 | 29 |
| GO:00066392 | Liver | NAFLD | acylglycerol metabolic process | 32/1882 | 128/18723 | 8.82e-07 | 4.60e-05 | 32 |
| Pathway ID | Tissue | Disease Stage | Description | Gene Ratio | Bg Ratio | pvalue | p.adjust | qvalue | Count |
| hsa04141211 | Esophagus | ESCC | Protein processing in endoplasmic reticulum | 147/4205 | 174/8465 | 3.29e-22 | 1.10e-19 | 5.64e-20 | 147 |
| hsa04141310 | Esophagus | ESCC | Protein processing in endoplasmic reticulum | 147/4205 | 174/8465 | 3.29e-22 | 1.10e-19 | 5.64e-20 | 147 |
| hsa0414114 | Liver | Cirrhotic | Protein processing in endoplasmic reticulum | 114/2530 | 174/8465 | 1.16e-22 | 9.67e-21 | 5.96e-21 | 114 |
| hsa0414115 | Liver | Cirrhotic | Protein processing in endoplasmic reticulum | 114/2530 | 174/8465 | 1.16e-22 | 9.67e-21 | 5.96e-21 | 114 |
| hsa0414122 | Liver | HCC | Protein processing in endoplasmic reticulum | 146/4020 | 174/8465 | 7.34e-24 | 2.46e-21 | 1.37e-21 | 146 |
| hsa0414132 | Liver | HCC | Protein processing in endoplasmic reticulum | 146/4020 | 174/8465 | 7.34e-24 | 2.46e-21 | 1.37e-21 | 146 |
| hsa0414130 | Oral cavity | OSCC | Protein processing in endoplasmic reticulum | 143/3704 | 174/8465 | 6.82e-26 | 2.28e-23 | 1.16e-23 | 143 |
| hsa04141113 | Oral cavity | OSCC | Protein processing in endoplasmic reticulum | 143/3704 | 174/8465 | 6.82e-26 | 2.28e-23 | 1.16e-23 | 143 |
| hsa04141210 | Oral cavity | LP | Protein processing in endoplasmic reticulum | 113/2418 | 174/8465 | 8.74e-24 | 5.82e-22 | 3.76e-22 | 113 |
| hsa0414138 | Oral cavity | LP | Protein processing in endoplasmic reticulum | 113/2418 | 174/8465 | 8.74e-24 | 5.82e-22 | 3.76e-22 | 113 |
| hsa0414128 | Prostate | BPH | Protein processing in endoplasmic reticulum | 97/1718 | 174/8465 | 2.37e-25 | 1.30e-23 | 8.07e-24 | 97 |
| hsa04141112 | Prostate | BPH | Protein processing in endoplasmic reticulum | 97/1718 | 174/8465 | 2.37e-25 | 1.30e-23 | 8.07e-24 | 97 |
| hsa0414129 | Prostate | Tumor | Protein processing in endoplasmic reticulum | 99/1791 | 174/8465 | 2.58e-25 | 1.71e-23 | 1.06e-23 | 99 |
| hsa0414137 | Prostate | Tumor | Protein processing in endoplasmic reticulum | 99/1791 | 174/8465 | 2.58e-25 | 1.71e-23 | 1.06e-23 | 99 |
| Hugo Symbol | Variant Class | Variant Classification | dbSNP RS | HGVSc | HGVSp | HGVSp Short | SWISSPROT | BIOTYPE | SIFT | PolyPhen | Tumor Sample Barcode | Tissue | Histology | Sex | Age | Stage | Therapy Types | Drugs | Outcome |
| SEL1L | SNV | Missense_Mutation | | c.1324N>A | p.Ala442Thr | p.A442T | Q9UBV2 | protein_coding | deleterious(0.02) | possibly_damaging(0.765) | TCGA-AN-A0AK-01 | Breast | breast invasive carcinoma | Female | >=65 | I/II | Unknown | Unknown | SD |
| SEL1L | SNV | Missense_Mutation | | c.950N>G | p.His317Arg | p.H317R | Q9UBV2 | protein_coding | deleterious(0.01) | possibly_damaging(0.811) | TCGA-AO-A128-01 | Breast | breast invasive carcinoma | Female | <65 | I/II | Chemotherapy | doxorubicin | SD |
| SEL1L | SNV | Missense_Mutation | | c.247G>C | p.Glu83Gln | p.E83Q | Q9UBV2 | protein_coding | tolerated_low_confidence(0.09) | benign(0.039) | TCGA-D8-A27G-01 | Breast | breast invasive carcinoma | Female | >=65 | I/II | Unknown | Unknown | SD |
| SEL1L | insertion | In_Frame_Ins | novel | c.2199_2200insAAAACAGTGTGTGCC | p.Leu733_Asp734insLysThrValCysAla | p.L733_D734insKTVCA | Q9UBV2 | protein_coding | | | TCGA-A7-A0CJ-01 | Breast | breast invasive carcinoma | Female | <65 | I/II | Chemotherapy | cytoxan | SD |
| SEL1L | insertion | Nonsense_Mutation | novel | c.2197_2198insATTGAGTACGTGCTTTGAGAAAACATTTC | p.Leu733HisfsTer2 | p.L733Hfs*2 | Q9UBV2 | protein_coding | | | TCGA-A7-A0CJ-01 | Breast | breast invasive carcinoma | Female | <65 | I/II | Chemotherapy | cytoxan | SD |
| SEL1L | insertion | Nonsense_Mutation | novel | c.1261_1262insAAAGGGTTAATCATAACCAACTCATGCTATA | p.Ser421Ter | p.S421* | Q9UBV2 | protein_coding | | | TCGA-AO-A03O-01 | Breast | breast invasive carcinoma | Female | >=65 | I/II | Chemotherapy | doxorubicin | SD |
| SEL1L | SNV | Missense_Mutation | novel | c.361N>G | p.Thr121Ala | p.T121A | Q9UBV2 | protein_coding | deleterious_low_confidence(0) | probably_damaging(0.97) | TCGA-2W-A8YY-01 | Cervix | cervical & endocervical cancer | Female | <65 | I/II | Chemotherapy | cisplatin | CR |
| SEL1L | SNV | Missense_Mutation | | c.967A>G | p.Asn323Asp | p.N323D | Q9UBV2 | protein_coding | tolerated(0.27) | benign(0.079) | TCGA-AA-3492-01 | Colorectum | colon adenocarcinoma | Female | >=65 | I/II | Unknown | Unknown | SD |
| SEL1L | SNV | Missense_Mutation | | c.102T>G | p.Asp34Glu | p.D34E | Q9UBV2 | protein_coding | tolerated_low_confidence(0.74) | benign(0) | TCGA-AA-3663-01 | Colorectum | colon adenocarcinoma | Male | <65 | I/II | Unknown | Unknown | SD |
| SEL1L | SNV | Missense_Mutation | | c.1576G>A | p.Ala526Thr | p.A526T | Q9UBV2 | protein_coding | deleterious(0) | probably_damaging(0.968) | TCGA-AA-3710-01 | Colorectum | colon adenocarcinoma | Female | >=65 | I/II | Unknown | Unknown | SD |


