
|
|||||
|
 | |
| |
| |
| |
| |
| |
|
Gene: SEH1L |
Gene summary for SEH1L |
| Gene information | Species | Human | Gene symbol | SEH1L | Gene ID | 81929 |
| Gene name | SEH1 like nucleoporin | |
| Gene Alias | SEC13L | |
| Cytomap | 18p11.21 | |
| Gene Type | protein-coding | GO ID | GO:0000070 | UniProtAcc | Q96EE3 |
Top |
Malignant transformation analysis |
| Identification of the aberrant gene expression in precancerous and cancerous lesions by comparing the gene expression of stem-like cells in diseased tissues with normal stem cells |
| Entrez ID | Symbol | Replicates | Species | Organ | Tissue | Adj P-value | Log2FC | Malignancy |
| 81929 | SEH1L | LZE4T | Human | Esophagus | ESCC | 9.95e-11 | 6.51e-02 | 0.0811 |
| 81929 | SEH1L | LZE8T | Human | Esophagus | ESCC | 9.19e-08 | 2.08e-02 | 0.067 |
| 81929 | SEH1L | LZE20T | Human | Esophagus | ESCC | 5.17e-04 | -1.03e-01 | 0.0662 |
| 81929 | SEH1L | LZE22T | Human | Esophagus | ESCC | 2.59e-05 | 1.29e-01 | 0.068 |
| 81929 | SEH1L | LZE24T | Human | Esophagus | ESCC | 2.03e-13 | 3.17e-01 | 0.0596 |
| 81929 | SEH1L | P2T-E | Human | Esophagus | ESCC | 3.64e-27 | 4.77e-01 | 0.1177 |
| 81929 | SEH1L | P4T-E | Human | Esophagus | ESCC | 2.92e-16 | 6.20e-01 | 0.1323 |
| 81929 | SEH1L | P5T-E | Human | Esophagus | ESCC | 8.01e-19 | 5.23e-01 | 0.1327 |
| 81929 | SEH1L | P8T-E | Human | Esophagus | ESCC | 3.47e-08 | 9.50e-02 | 0.0889 |
| 81929 | SEH1L | P9T-E | Human | Esophagus | ESCC | 1.26e-18 | 3.03e-01 | 0.1131 |
| 81929 | SEH1L | P10T-E | Human | Esophagus | ESCC | 5.64e-24 | 8.92e-02 | 0.116 |
| 81929 | SEH1L | P11T-E | Human | Esophagus | ESCC | 9.88e-11 | 2.81e-01 | 0.1426 |
| 81929 | SEH1L | P12T-E | Human | Esophagus | ESCC | 4.50e-13 | 2.51e-01 | 0.1122 |
| 81929 | SEH1L | P15T-E | Human | Esophagus | ESCC | 1.07e-14 | 2.79e-01 | 0.1149 |
| 81929 | SEH1L | P16T-E | Human | Esophagus | ESCC | 2.70e-23 | 3.42e-01 | 0.1153 |
| 81929 | SEH1L | P17T-E | Human | Esophagus | ESCC | 9.79e-05 | 3.51e-01 | 0.1278 |
| 81929 | SEH1L | P20T-E | Human | Esophagus | ESCC | 1.72e-15 | 1.93e-01 | 0.1124 |
| 81929 | SEH1L | P21T-E | Human | Esophagus | ESCC | 9.43e-39 | 6.32e-01 | 0.1617 |
| 81929 | SEH1L | P22T-E | Human | Esophagus | ESCC | 4.27e-24 | 1.09e-01 | 0.1236 |
| 81929 | SEH1L | P23T-E | Human | Esophagus | ESCC | 8.16e-37 | 1.02e+00 | 0.108 |
| Page: 1 2 3 4 5 |
| Tissue | Expression Dynamics | Abbreviation |
| Esophagus | 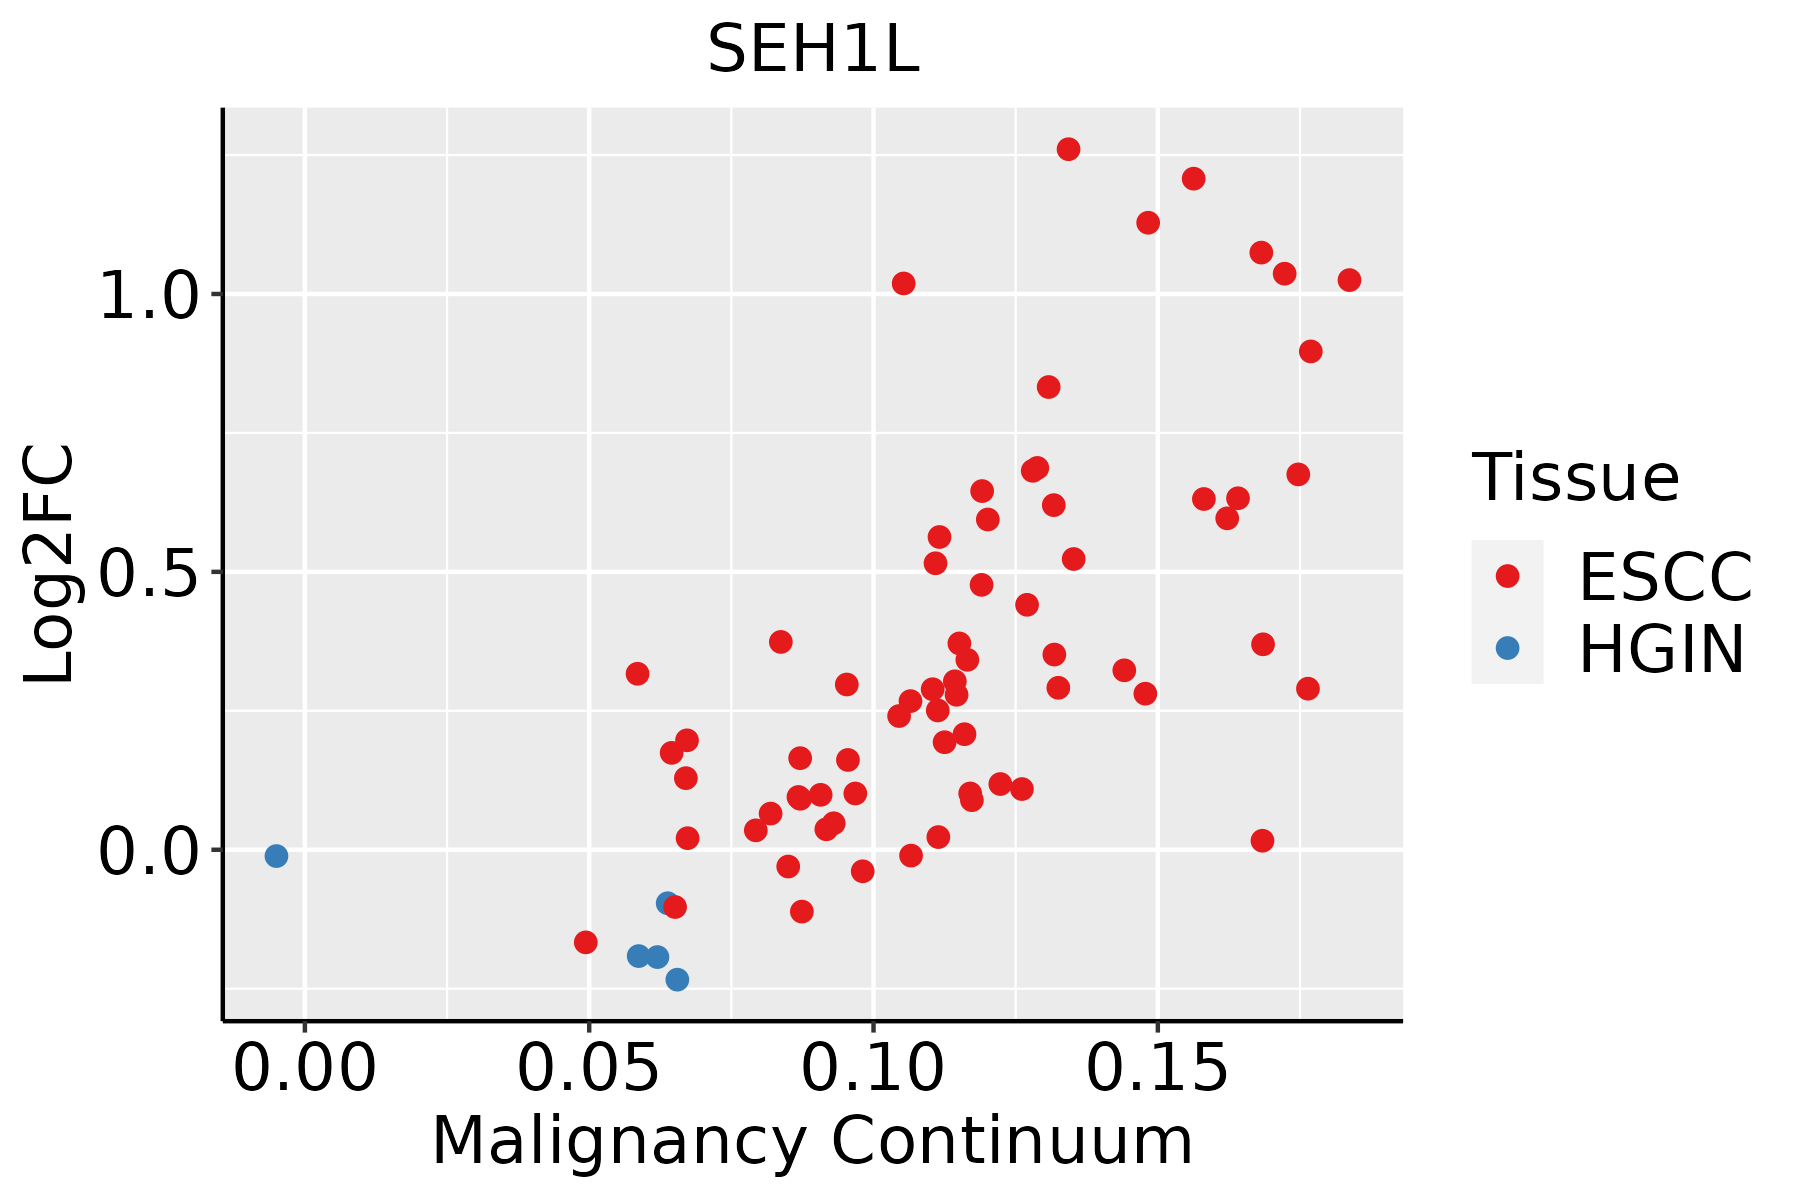 | ESCC: Esophageal squamous cell carcinoma |
| HGIN: High-grade intraepithelial neoplasias | ||
| LGIN: Low-grade intraepithelial neoplasias | ||
| Liver | 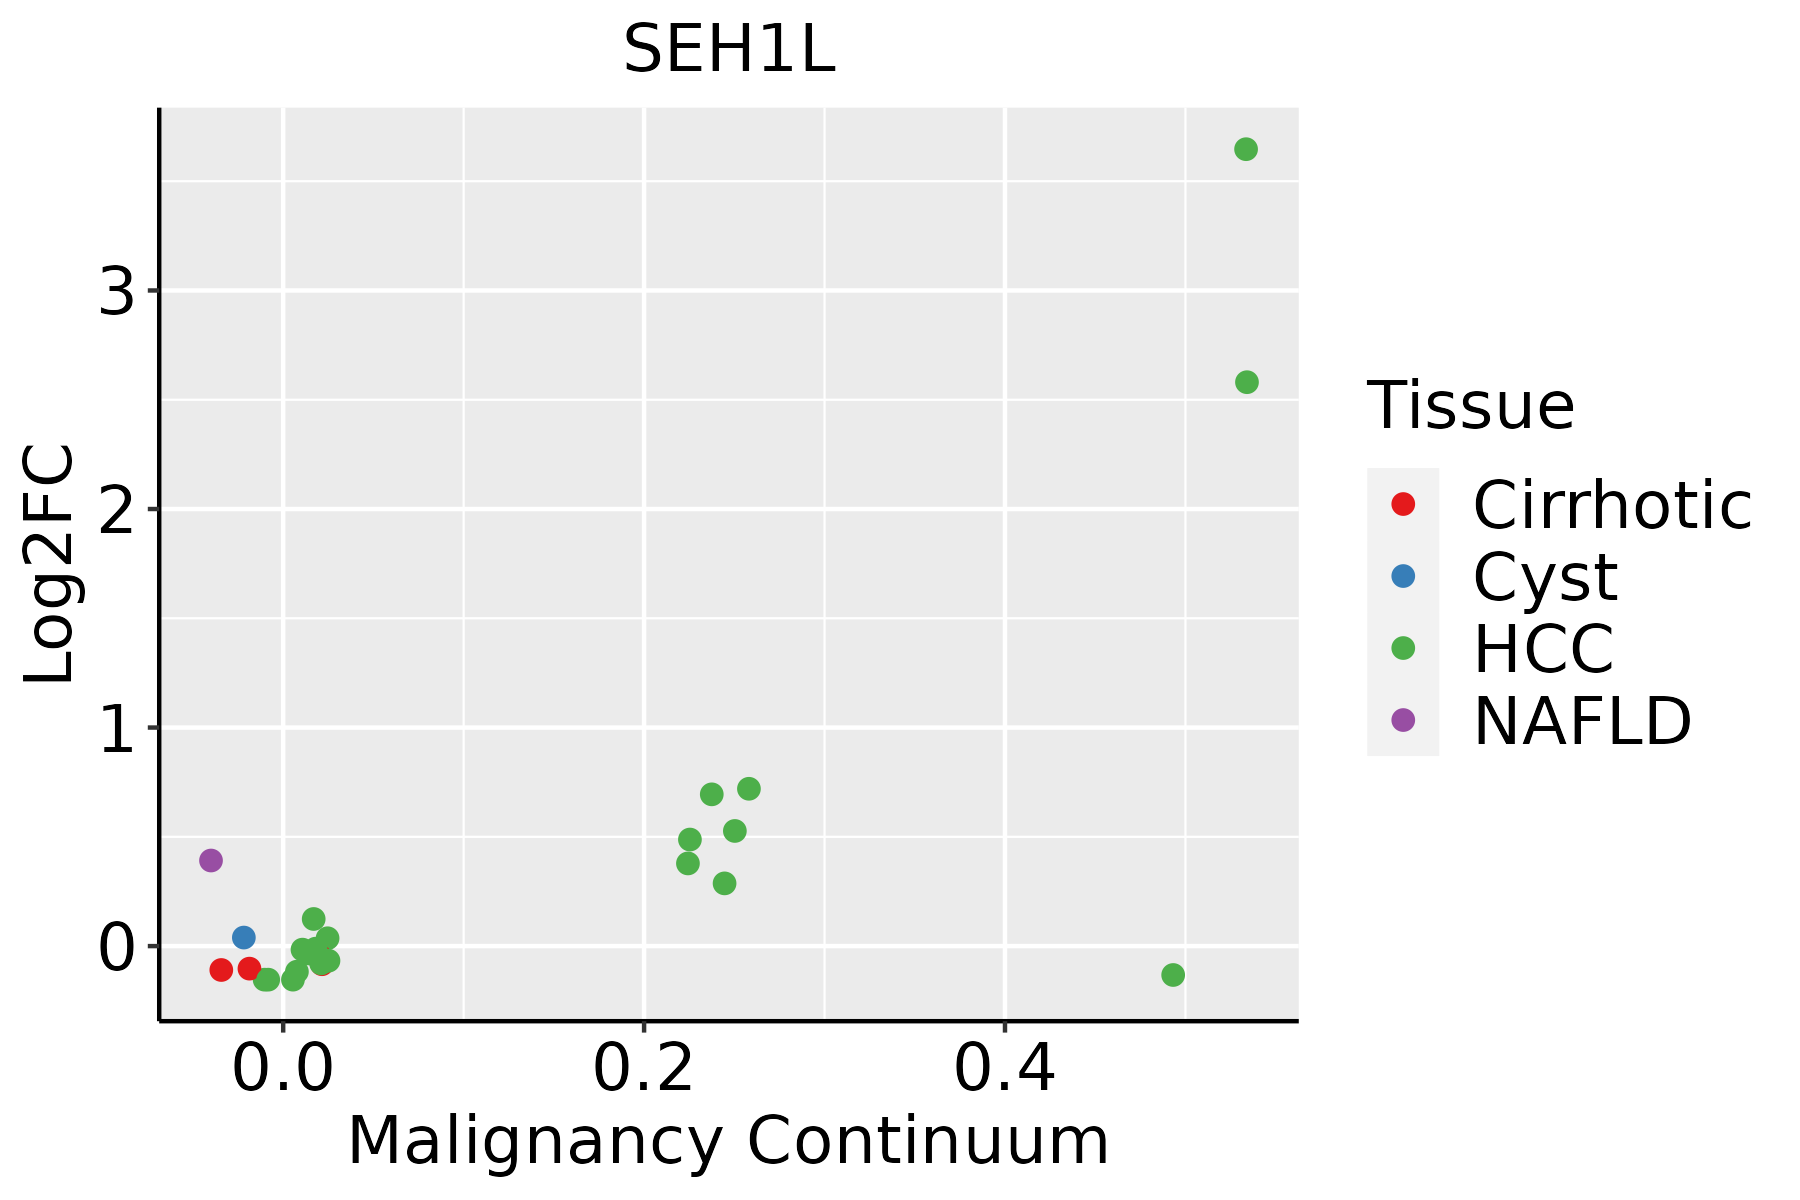 | HCC: Hepatocellular carcinoma |
| NAFLD: Non-alcoholic fatty liver disease | ||
| Oral Cavity |  | EOLP: Erosive Oral lichen planus |
| LP: leukoplakia | ||
| NEOLP: Non-erosive oral lichen planus | ||
| OSCC: Oral squamous cell carcinoma | ||
| Skin |  | AK: Actinic keratosis |
| cSCC: Cutaneous squamous cell carcinoma | ||
| SCCIS:squamous cell carcinoma in situ |
| ∗log2FC in expression of this searched gene in stem-like cells from each diseased tissue sample relative to stem-like cells in normal samples in each tissue plotted against the malignancy continuum. Samples are colored based on if they are from different disease stage. |
Top |
Malignant transformation related pathway analysis |
| Find out the enriched GO biological processes and KEGG pathways involved in transition from healthy to precancer to cancer |
| Tissue | Disease Stage | Enriched GO biological Processes |
| Colorectum | AD |  |
| Colorectum | SER |  |
| Colorectum | MSS |  |
| Colorectum | MSI-H |  |
| Colorectum | FAP |  |
| ∗Top 15 enriched GO BP terms are showed in the bar plot of each disease state in each tissue. Each row represents a significant GO biological process which is colored according to the -log10(p.adjust). |
| Page: 1 2 3 4 5 6 7 8 9 |
| GO ID | Tissue | Disease Stage | Description | Gene Ratio | Bg Ratio | pvalue | p.adjust | Count |
| GO:0006403110 | Esophagus | ESCC | RNA localization | 166/8552 | 201/18723 | 1.95e-27 | 6.18e-25 | 166 |
| GO:014001414 | Esophagus | ESCC | mitotic nuclear division | 218/8552 | 287/18723 | 6.17e-26 | 1.78e-23 | 218 |
| GO:005165617 | Esophagus | ESCC | establishment of organelle localization | 273/8552 | 390/18723 | 9.13e-23 | 1.81e-20 | 273 |
| GO:000007011 | Esophagus | ESCC | mitotic sister chromatid segregation | 138/8552 | 168/18723 | 1.37e-22 | 2.63e-20 | 138 |
| GO:00008194 | Esophagus | ESCC | sister chromatid segregation | 157/8552 | 202/18723 | 8.41e-21 | 1.33e-18 | 157 |
| GO:005123617 | Esophagus | ESCC | establishment of RNA localization | 134/8552 | 166/18723 | 1.23e-20 | 1.81e-18 | 134 |
| GO:005102815 | Esophagus | ESCC | mRNA transport | 110/8552 | 130/18723 | 2.76e-20 | 3.80e-18 | 110 |
| GO:005065717 | Esophagus | ESCC | nucleic acid transport | 131/8552 | 163/18723 | 6.94e-20 | 8.46e-18 | 131 |
| GO:005065817 | Esophagus | ESCC | RNA transport | 131/8552 | 163/18723 | 6.94e-20 | 8.46e-18 | 131 |
| GO:000705911 | Esophagus | ESCC | chromosome segregation | 238/8552 | 346/18723 | 1.72e-18 | 1.82e-16 | 238 |
| GO:001593117 | Esophagus | ESCC | nucleobase-containing compound transport | 162/8552 | 222/18723 | 9.87e-17 | 7.93e-15 | 162 |
| GO:0071496111 | Esophagus | ESCC | cellular response to external stimulus | 215/8552 | 320/18723 | 4.29e-15 | 2.43e-13 | 215 |
| GO:005131011 | Esophagus | ESCC | metaphase plate congression | 58/8552 | 65/18723 | 1.81e-13 | 8.63e-12 | 58 |
| GO:000708011 | Esophagus | ESCC | mitotic metaphase plate congression | 47/8552 | 50/18723 | 3.15e-13 | 1.47e-11 | 47 |
| GO:00482853 | Esophagus | ESCC | organelle fission | 301/8552 | 488/18723 | 4.64e-13 | 2.12e-11 | 301 |
| GO:0031668111 | Esophagus | ESCC | cellular response to extracellular stimulus | 168/8552 | 246/18723 | 4.93e-13 | 2.23e-11 | 168 |
| GO:00988133 | Esophagus | ESCC | nuclear chromosome segregation | 187/8552 | 281/18723 | 1.00e-12 | 4.36e-11 | 187 |
| GO:005130311 | Esophagus | ESCC | establishment of chromosome localization | 67/8552 | 80/18723 | 1.92e-12 | 8.09e-11 | 67 |
| GO:005000011 | Esophagus | ESCC | chromosome localization | 68/8552 | 82/18723 | 3.37e-12 | 1.32e-10 | 68 |
| GO:0031669110 | Esophagus | ESCC | cellular response to nutrient levels | 148/8552 | 215/18723 | 4.58e-12 | 1.76e-10 | 148 |
| Page: 1 2 3 4 5 6 7 8 |
| Pathway ID | Tissue | Disease Stage | Description | Gene Ratio | Bg Ratio | pvalue | p.adjust | qvalue | Count |
| hsa05014210 | Esophagus | ESCC | Amyotrophic lateral sclerosis | 266/4205 | 364/8465 | 1.31e-20 | 2.20e-18 | 1.13e-18 | 266 |
| hsa0301321 | Esophagus | ESCC | Nucleocytoplasmic transport | 89/4205 | 108/8465 | 1.20e-12 | 2.37e-11 | 1.21e-11 | 89 |
| hsa041505 | Esophagus | ESCC | mTOR signaling pathway | 98/4205 | 156/8465 | 5.81e-04 | 1.95e-03 | 9.97e-04 | 98 |
| hsa0501438 | Esophagus | ESCC | Amyotrophic lateral sclerosis | 266/4205 | 364/8465 | 1.31e-20 | 2.20e-18 | 1.13e-18 | 266 |
| hsa0301331 | Esophagus | ESCC | Nucleocytoplasmic transport | 89/4205 | 108/8465 | 1.20e-12 | 2.37e-11 | 1.21e-11 | 89 |
| hsa0415013 | Esophagus | ESCC | mTOR signaling pathway | 98/4205 | 156/8465 | 5.81e-04 | 1.95e-03 | 9.97e-04 | 98 |
| hsa0501422 | Liver | HCC | Amyotrophic lateral sclerosis | 252/4020 | 364/8465 | 8.85e-18 | 7.41e-16 | 4.12e-16 | 252 |
| hsa03013 | Liver | HCC | Nucleocytoplasmic transport | 81/4020 | 108/8465 | 4.28e-09 | 6.83e-08 | 3.80e-08 | 81 |
| hsa041502 | Liver | HCC | mTOR signaling pathway | 95/4020 | 156/8465 | 4.70e-04 | 1.99e-03 | 1.11e-03 | 95 |
| hsa0501432 | Liver | HCC | Amyotrophic lateral sclerosis | 252/4020 | 364/8465 | 8.85e-18 | 7.41e-16 | 4.12e-16 | 252 |
| hsa030131 | Liver | HCC | Nucleocytoplasmic transport | 81/4020 | 108/8465 | 4.28e-09 | 6.83e-08 | 3.80e-08 | 81 |
| hsa0415011 | Liver | HCC | mTOR signaling pathway | 95/4020 | 156/8465 | 4.70e-04 | 1.99e-03 | 1.11e-03 | 95 |
| hsa0501428 | Oral cavity | OSCC | Amyotrophic lateral sclerosis | 246/3704 | 364/8465 | 6.65e-21 | 1.11e-18 | 5.67e-19 | 246 |
| hsa030136 | Oral cavity | OSCC | Nucleocytoplasmic transport | 82/3704 | 108/8465 | 7.93e-12 | 1.33e-10 | 6.77e-11 | 82 |
| hsa041504 | Oral cavity | OSCC | mTOR signaling pathway | 90/3704 | 156/8465 | 2.87e-04 | 9.15e-04 | 4.66e-04 | 90 |
| hsa05014112 | Oral cavity | OSCC | Amyotrophic lateral sclerosis | 246/3704 | 364/8465 | 6.65e-21 | 1.11e-18 | 5.67e-19 | 246 |
| hsa0301311 | Oral cavity | OSCC | Nucleocytoplasmic transport | 82/3704 | 108/8465 | 7.93e-12 | 1.33e-10 | 6.77e-11 | 82 |
| hsa0415012 | Oral cavity | OSCC | mTOR signaling pathway | 90/3704 | 156/8465 | 2.87e-04 | 9.15e-04 | 4.66e-04 | 90 |
| hsa0501445 | Oral cavity | EOLP | Amyotrophic lateral sclerosis | 93/1218 | 364/8465 | 7.07e-09 | 1.14e-07 | 6.74e-08 | 93 |
| hsa030134 | Oral cavity | EOLP | Nucleocytoplasmic transport | 34/1218 | 108/8465 | 4.24e-06 | 2.91e-05 | 1.72e-05 | 34 |
| Page: 1 2 |
Top |
Cell-cell communication analysis |
| Identification of potential cell-cell interactions between two cell types and their ligand-receptor pairs for different disease states |
| Ligand | Receptor | LRpair | Pathway | Tissue | Disease Stage |
| Page: 1 |
Top |
Single-cell gene regulatory network inference analysis |
| Find out the significant the regulons (TFs) and the target genes of each regulon across cell types for different disease states |
| TF | Cell Type | Tissue | Disease Stage | Target Gene | RSS | Regulon Activity |
| ∗The dot plots of a searched regulon are shown for all cell subpopulations in each disease state of each tissue based on the regulon specific score inferred using pySCENIC and by calculating the average expression. |
| Page: 1 |
Top |
Somatic mutation of malignant transformation related genes |
| Annotation of somatic variants for genes involved in malignant transformation |
| Hugo Symbol | Variant Class | Variant Classification | dbSNP RS | HGVSc | HGVSp | HGVSp Short | SWISSPROT | BIOTYPE | SIFT | PolyPhen | Tumor Sample Barcode | Tissue | Histology | Sex | Age | Stage | Therapy Types | Drugs | Outcome |
| SEH1L | SNV | Missense_Mutation | c.594G>C | p.Gln198His | p.Q198H | Q96EE3 | protein_coding | tolerated(0.55) | benign(0.052) | TCGA-AC-A23H-01 | Breast | breast invasive carcinoma | Female | >=65 | I/II | Unknown | Unknown | PD | |
| SEH1L | SNV | Missense_Mutation | rs767376115 | c.527N>A | p.Arg176His | p.R176H | Q96EE3 | protein_coding | deleterious(0) | benign(0.441) | TCGA-B6-A0X0-01 | Breast | breast invasive carcinoma | Female | <65 | I/II | Unknown | Unknown | SD |
| SEH1L | SNV | Missense_Mutation | novel | c.1261N>T | p.Ile421Phe | p.I421F | Q96EE3 | protein_coding | deleterious_low_confidence(0) | benign(0.006) | TCGA-AA-3947-01 | Colorectum | colon adenocarcinoma | Female | <65 | I/II | Unknown | Unknown | SD |
| SEH1L | SNV | Missense_Mutation | novel | c.184C>A | p.Arg62Ser | p.R62S | Q96EE3 | protein_coding | deleterious(0) | possibly_damaging(0.822) | TCGA-AF-3913-01 | Colorectum | rectum adenocarcinoma | Male | <65 | III/IV | Chemotherapy | xeloda | PD |
| SEH1L | SNV | Missense_Mutation | c.957N>T | p.Leu319Phe | p.L319F | Q96EE3 | protein_coding | deleterious(0.03) | benign(0.233) | TCGA-AG-3892-01 | Colorectum | rectum adenocarcinoma | Female | <65 | I/II | Unknown | Unknown | SD | |
| SEH1L | SNV | Missense_Mutation | novel | c.674N>G | p.Ile225Ser | p.I225S | Q96EE3 | protein_coding | deleterious(0) | possibly_damaging(0.897) | TCGA-A5-A0G1-01 | Endometrium | uterine corpus endometrioid carcinoma | Female | >=65 | I/II | Unknown | Unknown | SD |
| SEH1L | SNV | Missense_Mutation | novel | c.674N>G | p.Ile225Ser | p.I225S | Q96EE3 | protein_coding | deleterious(0) | possibly_damaging(0.897) | TCGA-A5-A0GG-01 | Endometrium | uterine corpus endometrioid carcinoma | Female | >=65 | I/II | Unknown | Unknown | SD |
| SEH1L | SNV | Missense_Mutation | novel | c.701N>A | p.Ser234Tyr | p.S234Y | Q96EE3 | protein_coding | deleterious(0.02) | probably_damaging(0.987) | TCGA-AJ-A3BH-01 | Endometrium | uterine corpus endometrioid carcinoma | Female | Unknown | I/II | Unknown | Unknown | SD |
| SEH1L | SNV | Missense_Mutation | novel | c.415N>T | p.Val139Leu | p.V139L | Q96EE3 | protein_coding | tolerated(0.23) | benign(0.175) | TCGA-AX-A06F-01 | Endometrium | uterine corpus endometrioid carcinoma | Female | <65 | III/IV | Chemotherapy | carboplatin | SD |
| SEH1L | SNV | Missense_Mutation | novel | c.730N>T | p.Asp244Tyr | p.D244Y | Q96EE3 | protein_coding | deleterious(0.01) | possibly_damaging(0.82) | TCGA-AX-A1CE-01 | Endometrium | uterine corpus endometrioid carcinoma | Female | <65 | I/II | Unspecific | Paclitaxel | SD |
| Page: 1 2 3 |
Top |
Related drugs of malignant transformation related genes |
| Identification of chemicals and drugs interact with genes involved in malignant transfromation |
| (DGIdb 4.0) |
| Entrez ID | Symbol | Category | Interaction Types | Drug Claim Name | Drug Name | PMIDs |
| Page: 1 |

Copyright 2023-Present -The University of Texas Health Science Center at Houston |