
|
|||||
|
 | |
| |
| |
| |
| |
| |
|
Gene: SECTM1 |
Gene summary for SECTM1 |
| Gene information | Species | Human | Gene symbol | SECTM1 | Gene ID | 6398 |
| Gene name | secreted and transmembrane 1 | |
| Gene Alias | K12 | |
| Cytomap | 17q25.3 | |
| Gene Type | protein-coding | GO ID | GO:0002376 | UniProtAcc | Q8WVN6 |
Top |
Malignant transformation analysis |
| Identification of the aberrant gene expression in precancerous and cancerous lesions by comparing the gene expression of stem-like cells in diseased tissues with normal stem cells |
| Entrez ID | Symbol | Replicates | Species | Organ | Tissue | Adj P-value | Log2FC | Malignancy |
| 6398 | SECTM1 | HTA11_2487_2000001011 | Human | Colorectum | SER | 7.61e-06 | 4.99e-01 | -0.1808 |
| 6398 | SECTM1 | HTA11_411_2000001011 | Human | Colorectum | SER | 2.79e-03 | 1.16e+00 | -0.2602 |
| 6398 | SECTM1 | HTA11_3361_2000001011 | Human | Colorectum | AD | 2.33e-06 | 4.58e-01 | -0.1207 |
| 6398 | SECTM1 | HTA11_1391_2000001011 | Human | Colorectum | AD | 8.90e-04 | 3.75e-01 | -0.059 |
| 6398 | SECTM1 | HTA11_5212_2000001011 | Human | Colorectum | AD | 2.17e-05 | 9.40e-01 | -0.2061 |
| 6398 | SECTM1 | HTA11_99999970781_79442 | Human | Colorectum | MSS | 1.10e-02 | 2.34e-01 | 0.294 |
| 6398 | SECTM1 | LZE24D1 | Human | Esophagus | HGIN | 4.84e-03 | 7.14e-01 | 0.054 |
| 6398 | SECTM1 | LZE24T | Human | Esophagus | ESCC | 2.85e-21 | 8.46e-01 | 0.0596 |
| 6398 | SECTM1 | P2T-E | Human | Esophagus | ESCC | 2.06e-09 | 2.97e-02 | 0.1177 |
| 6398 | SECTM1 | P9T-E | Human | Esophagus | ESCC | 3.47e-09 | 2.62e-01 | 0.1131 |
| 6398 | SECTM1 | P21T-E | Human | Esophagus | ESCC | 4.58e-17 | 2.72e-01 | 0.1617 |
| 6398 | SECTM1 | P26T-E | Human | Esophagus | ESCC | 8.11e-08 | 5.21e-02 | 0.1276 |
| 6398 | SECTM1 | P27T-E | Human | Esophagus | ESCC | 3.56e-03 | 4.09e-02 | 0.1055 |
| 6398 | SECTM1 | P39T-E | Human | Esophagus | ESCC | 2.60e-04 | 1.37e-01 | 0.0894 |
| 6398 | SECTM1 | P40T-E | Human | Esophagus | ESCC | 3.61e-06 | 2.00e-01 | 0.109 |
| 6398 | SECTM1 | P48T-E | Human | Esophagus | ESCC | 7.19e-04 | 2.71e-02 | 0.0959 |
| 6398 | SECTM1 | P52T-E | Human | Esophagus | ESCC | 5.87e-03 | 1.35e-01 | 0.1555 |
| 6398 | SECTM1 | P54T-E | Human | Esophagus | ESCC | 2.54e-02 | 1.25e-01 | 0.0975 |
| 6398 | SECTM1 | P57T-E | Human | Esophagus | ESCC | 1.01e-08 | 8.21e-02 | 0.0926 |
| 6398 | SECTM1 | P61T-E | Human | Esophagus | ESCC | 1.61e-05 | 1.21e-01 | 0.099 |
| Page: 1 2 |
| Tissue | Expression Dynamics | Abbreviation |
| Colorectum (GSE201348) |  | FAP: Familial adenomatous polyposis |
| CRC: Colorectal cancer | ||
| Colorectum (HTA11) |  | AD: Adenomas |
| SER: Sessile serrated lesions | ||
| MSI-H: Microsatellite-high colorectal cancer | ||
| MSS: Microsatellite stable colorectal cancer | ||
| Esophagus | 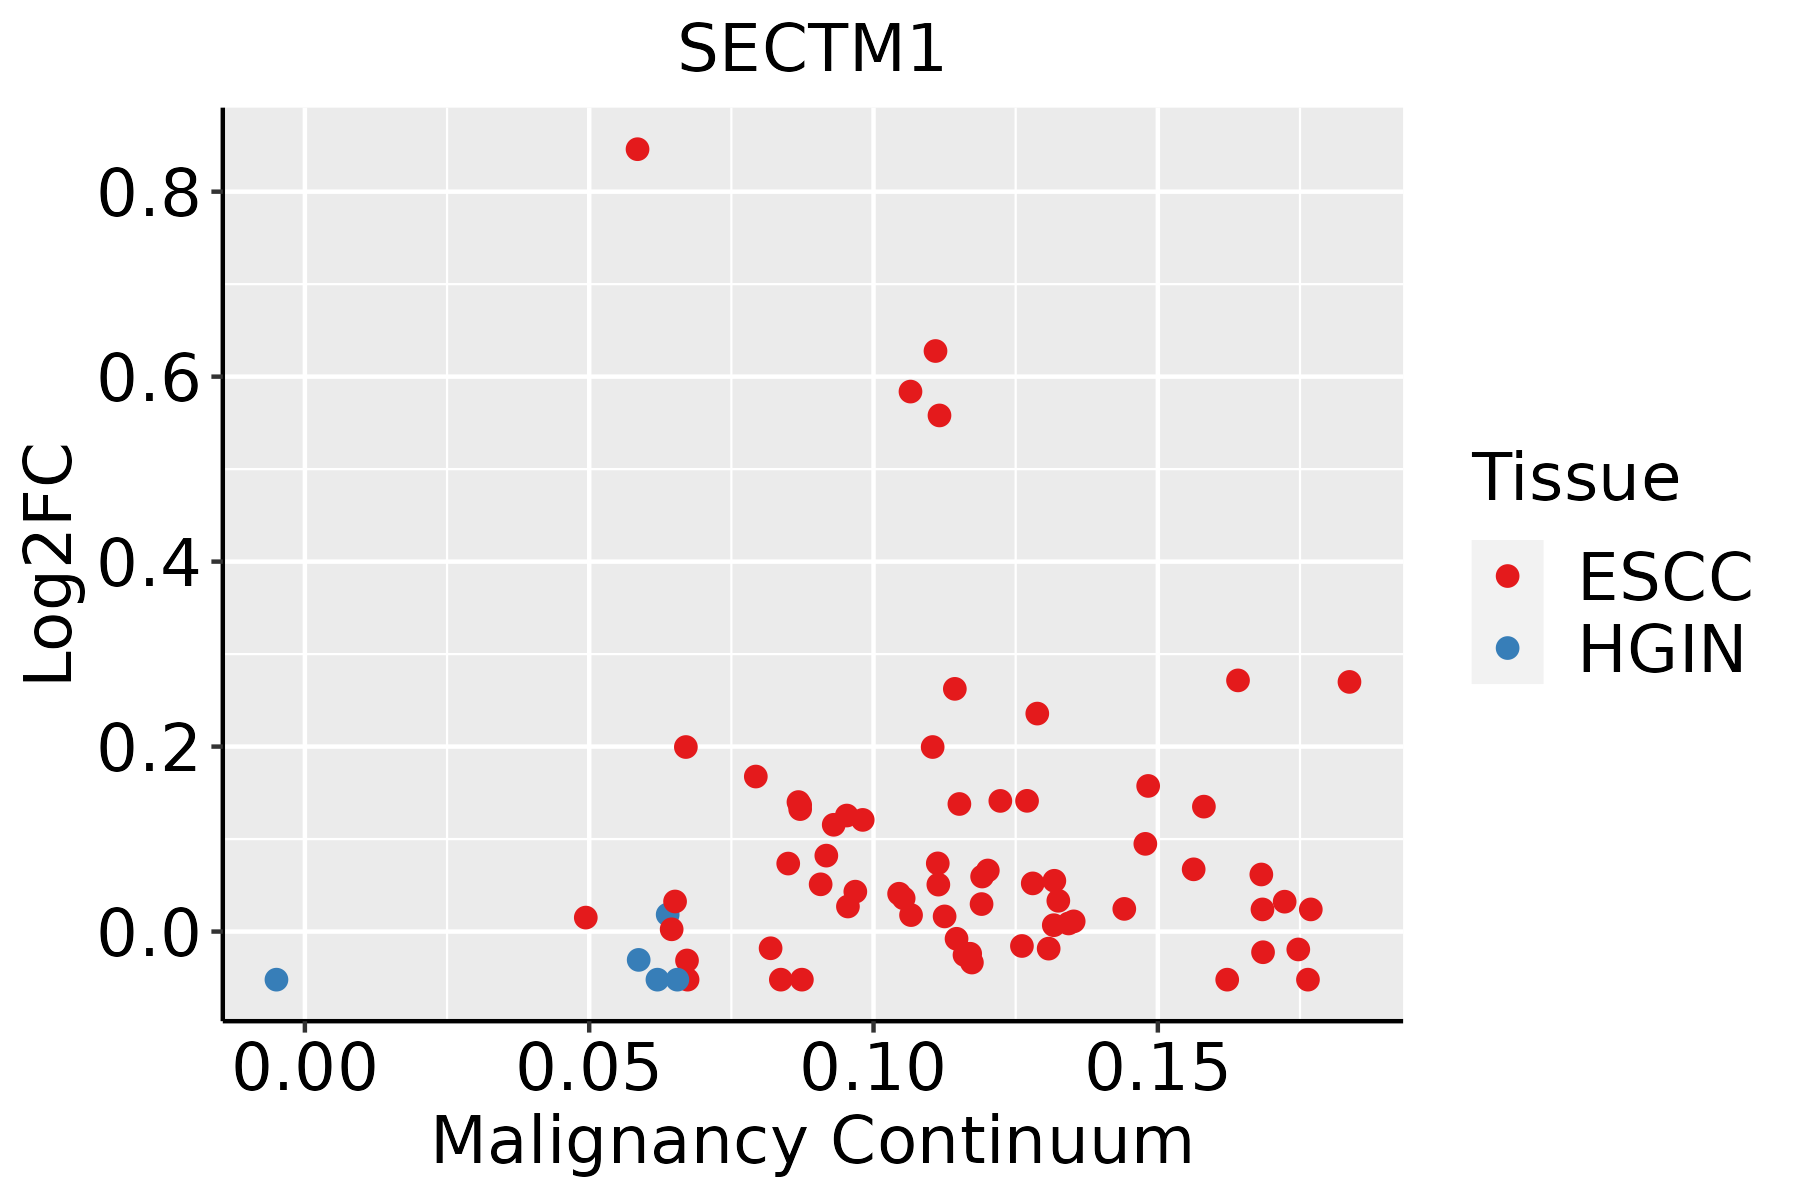 | ESCC: Esophageal squamous cell carcinoma |
| HGIN: High-grade intraepithelial neoplasias | ||
| LGIN: Low-grade intraepithelial neoplasias |
| ∗log2FC in expression of this searched gene in stem-like cells from each diseased tissue sample relative to stem-like cells in normal samples in each tissue plotted against the malignancy continuum. Samples are colored based on if they are from different disease stage. |
Top |
Malignant transformation related pathway analysis |
| Find out the enriched GO biological processes and KEGG pathways involved in transition from healthy to precancer to cancer |
| Tissue | Disease Stage | Enriched GO biological Processes |
| Colorectum | AD |  |
| Colorectum | SER |  |
| Colorectum | MSS |  |
| Colorectum | MSI-H |  |
| Colorectum | FAP |  |
| ∗Top 15 enriched GO BP terms are showed in the bar plot of each disease state in each tissue. Each row represents a significant GO biological process which is colored according to the -log10(p.adjust). |
| Page: 1 2 3 4 5 6 7 8 9 |
| GO ID | Tissue | Disease Stage | Description | Gene Ratio | Bg Ratio | pvalue | p.adjust | Count |
| GO:0043123 | Colorectum | AD | positive regulation of I-kappaB kinase/NF-kappaB signaling | 60/3918 | 186/18723 | 1.91e-04 | 2.56e-03 | 60 |
| GO:0043122 | Colorectum | AD | regulation of I-kappaB kinase/NF-kappaB signaling | 76/3918 | 249/18723 | 2.17e-04 | 2.85e-03 | 76 |
| GO:0007249 | Colorectum | AD | I-kappaB kinase/NF-kappaB signaling | 82/3918 | 281/18723 | 6.09e-04 | 6.40e-03 | 82 |
| GO:00431221 | Colorectum | MSS | regulation of I-kappaB kinase/NF-kappaB signaling | 71/3467 | 249/18723 | 7.12e-05 | 1.21e-03 | 71 |
| GO:00072491 | Colorectum | MSS | I-kappaB kinase/NF-kappaB signaling | 77/3467 | 281/18723 | 1.51e-04 | 2.19e-03 | 77 |
| GO:00431231 | Colorectum | MSS | positive regulation of I-kappaB kinase/NF-kappaB signaling | 55/3467 | 186/18723 | 1.60e-04 | 2.29e-03 | 55 |
| GO:004312318 | Esophagus | ESCC | positive regulation of I-kappaB kinase/NF-kappaB signaling | 132/8552 | 186/18723 | 2.07e-12 | 8.58e-11 | 132 |
| GO:0043122110 | Esophagus | ESCC | regulation of I-kappaB kinase/NF-kappaB signaling | 167/8552 | 249/18723 | 6.11e-12 | 2.32e-10 | 167 |
| GO:000724919 | Esophagus | ESCC | I-kappaB kinase/NF-kappaB signaling | 183/8552 | 281/18723 | 3.02e-11 | 1.01e-09 | 183 |
| Page: 1 |
| Pathway ID | Tissue | Disease Stage | Description | Gene Ratio | Bg Ratio | pvalue | p.adjust | qvalue | Count |
| Page: 1 |
Top |
Cell-cell communication analysis |
| Identification of potential cell-cell interactions between two cell types and their ligand-receptor pairs for different disease states |
| Ligand | Receptor | LRpair | Pathway | Tissue | Disease Stage |
| Page: 1 |
Top |
Single-cell gene regulatory network inference analysis |
| Find out the significant the regulons (TFs) and the target genes of each regulon across cell types for different disease states |
| TF | Cell Type | Tissue | Disease Stage | Target Gene | RSS | Regulon Activity |
| ∗The dot plots of a searched regulon are shown for all cell subpopulations in each disease state of each tissue based on the regulon specific score inferred using pySCENIC and by calculating the average expression. |
| Page: 1 |
Top |
Somatic mutation of malignant transformation related genes |
| Annotation of somatic variants for genes involved in malignant transformation |
| Hugo Symbol | Variant Class | Variant Classification | dbSNP RS | HGVSc | HGVSp | HGVSp Short | SWISSPROT | BIOTYPE | SIFT | PolyPhen | Tumor Sample Barcode | Tissue | Histology | Sex | Age | Stage | Therapy Types | Drugs | Outcome |
| SECTM1 | SNV | Missense_Mutation | novel | c.611N>C | p.Arg204Thr | p.R204T | Q8WVN6 | protein_coding | tolerated_low_confidence(0.05) | benign(0.151) | TCGA-OL-A5RW-01 | Breast | breast invasive carcinoma | Female | <65 | I/II | Chemotherapy | adriamycin | CR |
| SECTM1 | SNV | Missense_Mutation | novel | c.628T>C | p.Trp210Arg | p.W210R | Q8WVN6 | protein_coding | deleterious_low_confidence(0) | benign(0.361) | TCGA-CK-4952-01 | Colorectum | colon adenocarcinoma | Female | <65 | III/IV | Unknown | Unknown | SD |
| SECTM1 | SNV | Missense_Mutation | rs749551747 | c.124G>T | p.Val42Leu | p.V42L | Q8WVN6 | protein_coding | deleterious(0.04) | benign(0.298) | TCGA-CM-5861-01 | Colorectum | colon adenocarcinoma | Female | <65 | I/II | Unknown | Unknown | PD |
| SECTM1 | SNV | Missense_Mutation | c.299C>T | p.Ala100Val | p.A100V | Q8WVN6 | protein_coding | deleterious(0) | probably_damaging(0.996) | TCGA-G4-6320-01 | Colorectum | colon adenocarcinoma | Male | >=65 | III/IV | Chemotherapy | oxaliplatin | SD | |
| SECTM1 | SNV | Missense_Mutation | novel | c.380N>T | p.Arg127Ile | p.R127I | Q8WVN6 | protein_coding | tolerated(0.06) | benign(0.019) | TCGA-A5-A1OF-01 | Endometrium | uterine corpus endometrioid carcinoma | Female | <65 | I/II | Unknown | Unknown | SD |
| SECTM1 | SNV | Missense_Mutation | novel | c.298N>A | p.Ala100Thr | p.A100T | Q8WVN6 | protein_coding | deleterious(0) | probably_damaging(0.996) | TCGA-AX-A1CE-01 | Endometrium | uterine corpus endometrioid carcinoma | Female | <65 | I/II | Unspecific | Paclitaxel | SD |
| SECTM1 | SNV | Missense_Mutation | novel | c.50N>A | p.Gly17Glu | p.G17E | Q8WVN6 | protein_coding | tolerated(0.28) | benign(0.104) | TCGA-AX-A2HD-01 | Endometrium | uterine corpus endometrioid carcinoma | Female | >=65 | III/IV | Unknown | Unknown | SD |
| SECTM1 | SNV | Missense_Mutation | rs150899553 | c.529C>T | p.Arg177Cys | p.R177C | Q8WVN6 | protein_coding | deleterious(0.01) | benign(0.439) | TCGA-D1-A103-01 | Endometrium | uterine corpus endometrioid carcinoma | Female | >=65 | I/II | Unknown | Unknown | SD |
| SECTM1 | SNV | Missense_Mutation | rs766594826 | c.592N>A | p.Ala198Thr | p.A198T | Q8WVN6 | protein_coding | tolerated_low_confidence(1) | benign(0) | TCGA-G3-AAV0-01 | Liver | liver hepatocellular carcinoma | Male | <65 | I/II | Unknown | Unknown | SD |
| SECTM1 | SNV | Missense_Mutation | c.734N>G | p.Ala245Gly | p.A245G | Q8WVN6 | protein_coding | deleterious_low_confidence(0) | benign(0.139) | TCGA-64-1678-01 | Lung | lung adenocarcinoma | Female | >=65 | I/II | Chemotherapy | carboplatin | SD |
| Page: 1 2 |
Top |
Related drugs of malignant transformation related genes |
| Identification of chemicals and drugs interact with genes involved in malignant transfromation |
| (DGIdb 4.0) |
| Entrez ID | Symbol | Category | Interaction Types | Drug Claim Name | Drug Name | PMIDs |
| Page: 1 |

Copyright 2023-Present -The University of Texas Health Science Center at Houston |