
|
|||||
|
 | |
| |
| |
| |
| |
| |
|
Gene: SECISBP2L |
Gene summary for SECISBP2L |
| Gene information | Species | Human | Gene symbol | SECISBP2L | Gene ID | 9728 |
| Gene name | SECIS binding protein 2 like | |
| Gene Alias | SBP2L | |
| Cytomap | 15q21.1 | |
| Gene Type | protein-coding | GO ID | GO:0001514 | UniProtAcc | A0A024R5R0 |
Top |
Malignant transformation analysis |
| Identification of the aberrant gene expression in precancerous and cancerous lesions by comparing the gene expression of stem-like cells in diseased tissues with normal stem cells |
| Entrez ID | Symbol | Replicates | Species | Organ | Tissue | Adj P-value | Log2FC | Malignancy |
| 9728 | SECISBP2L | LZE4T | Human | Esophagus | ESCC | 1.43e-17 | 4.03e-01 | 0.0811 |
| 9728 | SECISBP2L | LZE7T | Human | Esophagus | ESCC | 6.43e-06 | 5.64e-01 | 0.0667 |
| 9728 | SECISBP2L | LZE8T | Human | Esophagus | ESCC | 4.53e-03 | 8.27e-02 | 0.067 |
| 9728 | SECISBP2L | LZE22T | Human | Esophagus | ESCC | 4.70e-02 | 2.13e-01 | 0.068 |
| 9728 | SECISBP2L | LZE24T | Human | Esophagus | ESCC | 4.01e-19 | 3.43e-01 | 0.0596 |
| 9728 | SECISBP2L | LZE21T | Human | Esophagus | ESCC | 2.31e-04 | 2.26e-01 | 0.0655 |
| 9728 | SECISBP2L | LZE6T | Human | Esophagus | ESCC | 7.16e-08 | 2.15e-01 | 0.0845 |
| 9728 | SECISBP2L | P1T-E | Human | Esophagus | ESCC | 2.68e-09 | 5.18e-01 | 0.0875 |
| 9728 | SECISBP2L | P2T-E | Human | Esophagus | ESCC | 3.63e-23 | 3.32e-01 | 0.1177 |
| 9728 | SECISBP2L | P4T-E | Human | Esophagus | ESCC | 5.53e-22 | 4.38e-01 | 0.1323 |
| 9728 | SECISBP2L | P5T-E | Human | Esophagus | ESCC | 4.53e-16 | 2.86e-01 | 0.1327 |
| 9728 | SECISBP2L | P8T-E | Human | Esophagus | ESCC | 1.90e-40 | 7.86e-01 | 0.0889 |
| 9728 | SECISBP2L | P9T-E | Human | Esophagus | ESCC | 9.54e-13 | 3.23e-01 | 0.1131 |
| 9728 | SECISBP2L | P10T-E | Human | Esophagus | ESCC | 1.51e-37 | 6.09e-01 | 0.116 |
| 9728 | SECISBP2L | P11T-E | Human | Esophagus | ESCC | 5.52e-12 | 8.25e-01 | 0.1426 |
| 9728 | SECISBP2L | P12T-E | Human | Esophagus | ESCC | 1.04e-23 | 4.54e-01 | 0.1122 |
| 9728 | SECISBP2L | P15T-E | Human | Esophagus | ESCC | 1.75e-22 | 5.38e-01 | 0.1149 |
| 9728 | SECISBP2L | P16T-E | Human | Esophagus | ESCC | 9.25e-33 | 5.78e-01 | 0.1153 |
| 9728 | SECISBP2L | P17T-E | Human | Esophagus | ESCC | 1.14e-06 | 3.47e-01 | 0.1278 |
| 9728 | SECISBP2L | P19T-E | Human | Esophagus | ESCC | 1.53e-06 | 9.43e-01 | 0.1662 |
| Page: 1 2 3 4 5 6 |
| Tissue | Expression Dynamics | Abbreviation |
| Esophagus | 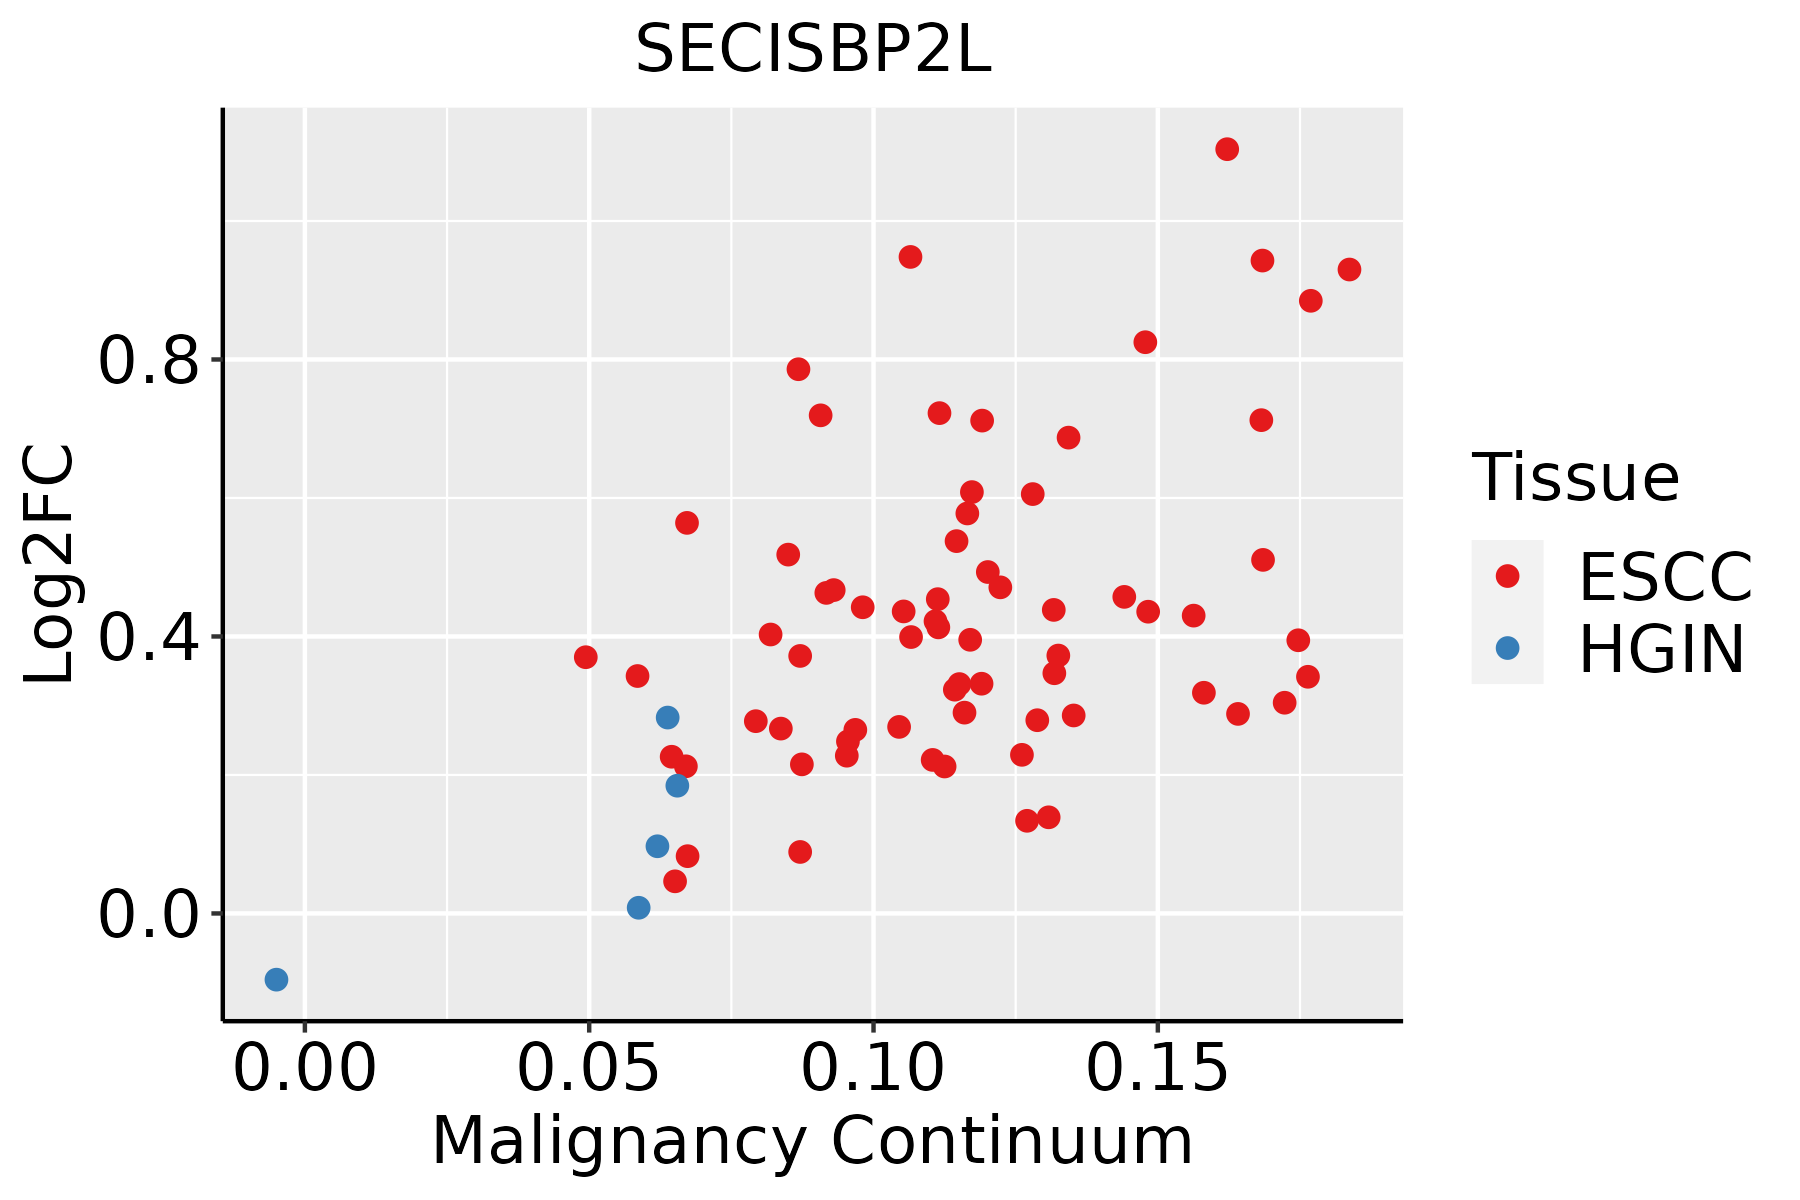 | ESCC: Esophageal squamous cell carcinoma |
| HGIN: High-grade intraepithelial neoplasias | ||
| LGIN: Low-grade intraepithelial neoplasias | ||
| Liver | 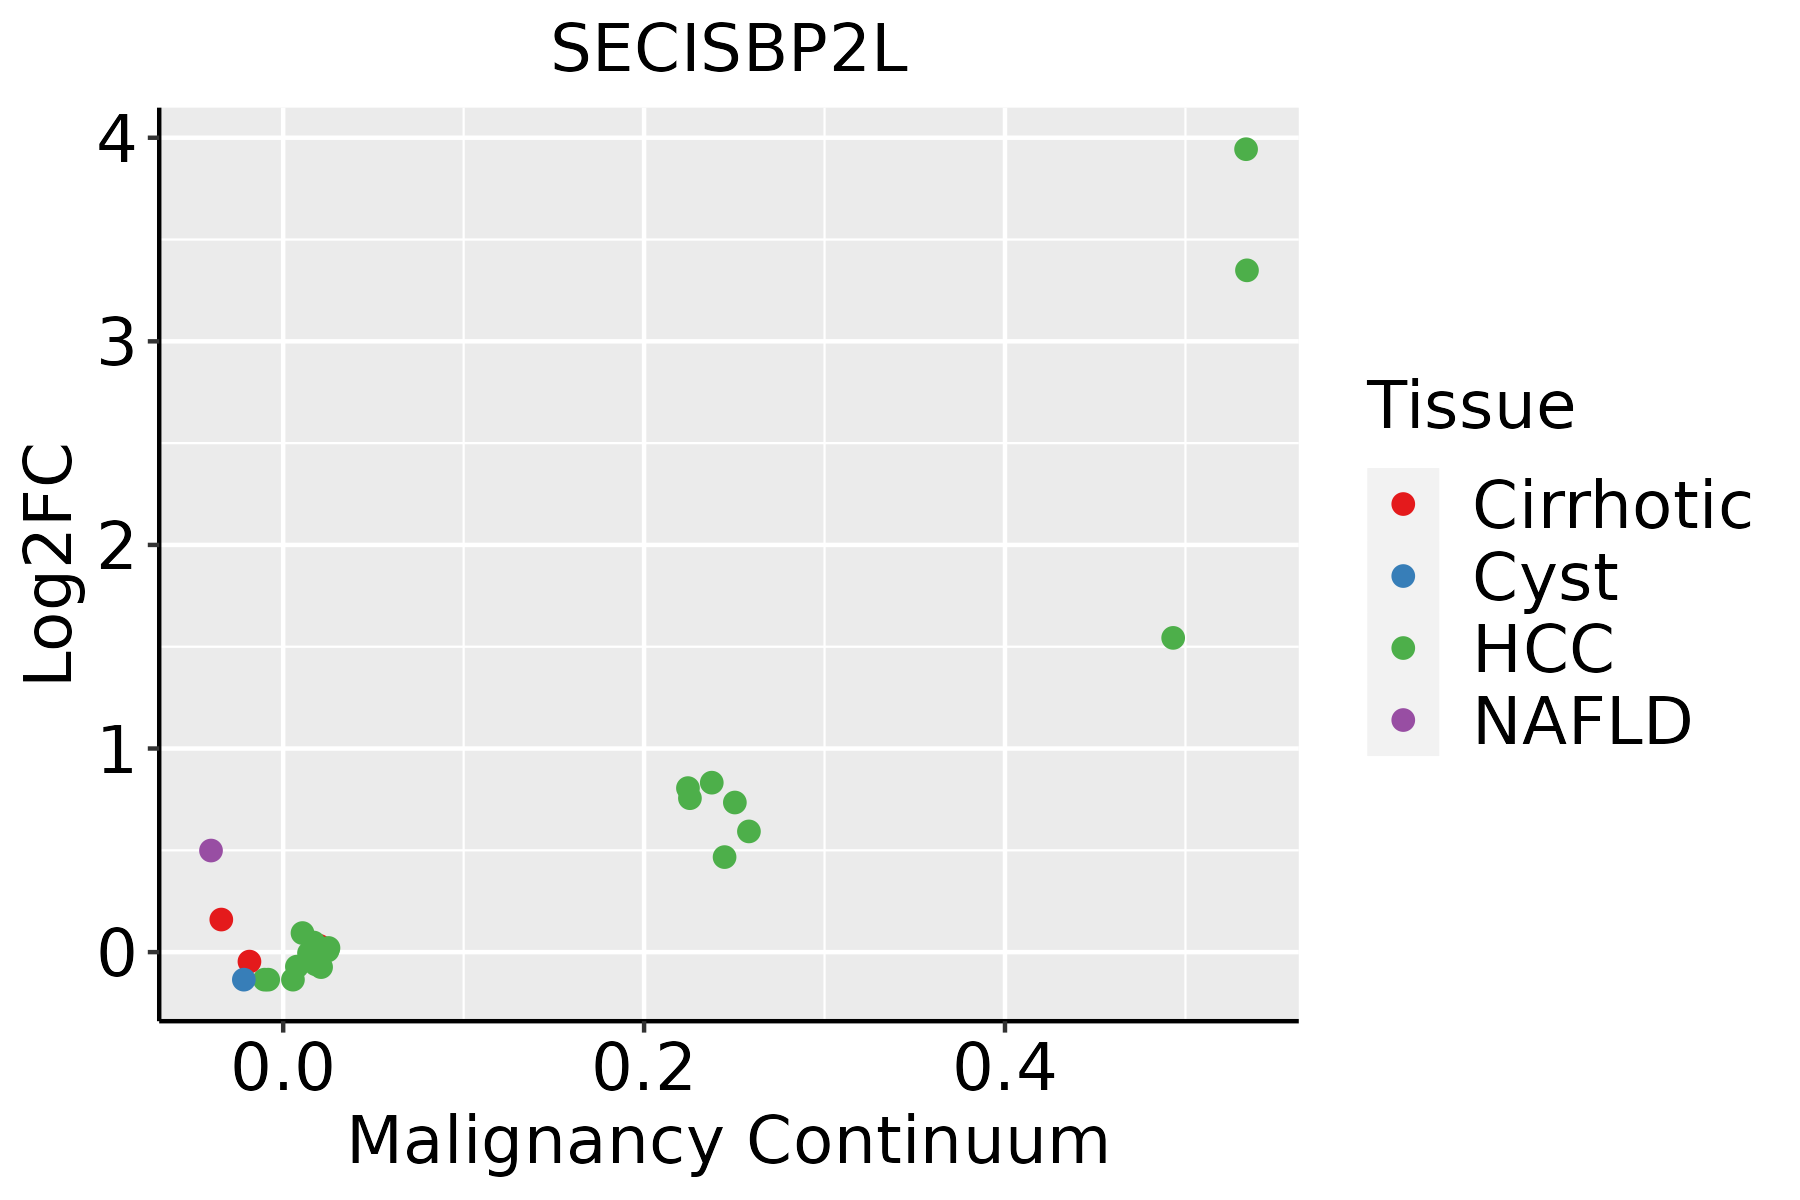 | HCC: Hepatocellular carcinoma |
| NAFLD: Non-alcoholic fatty liver disease | ||
| Lung | 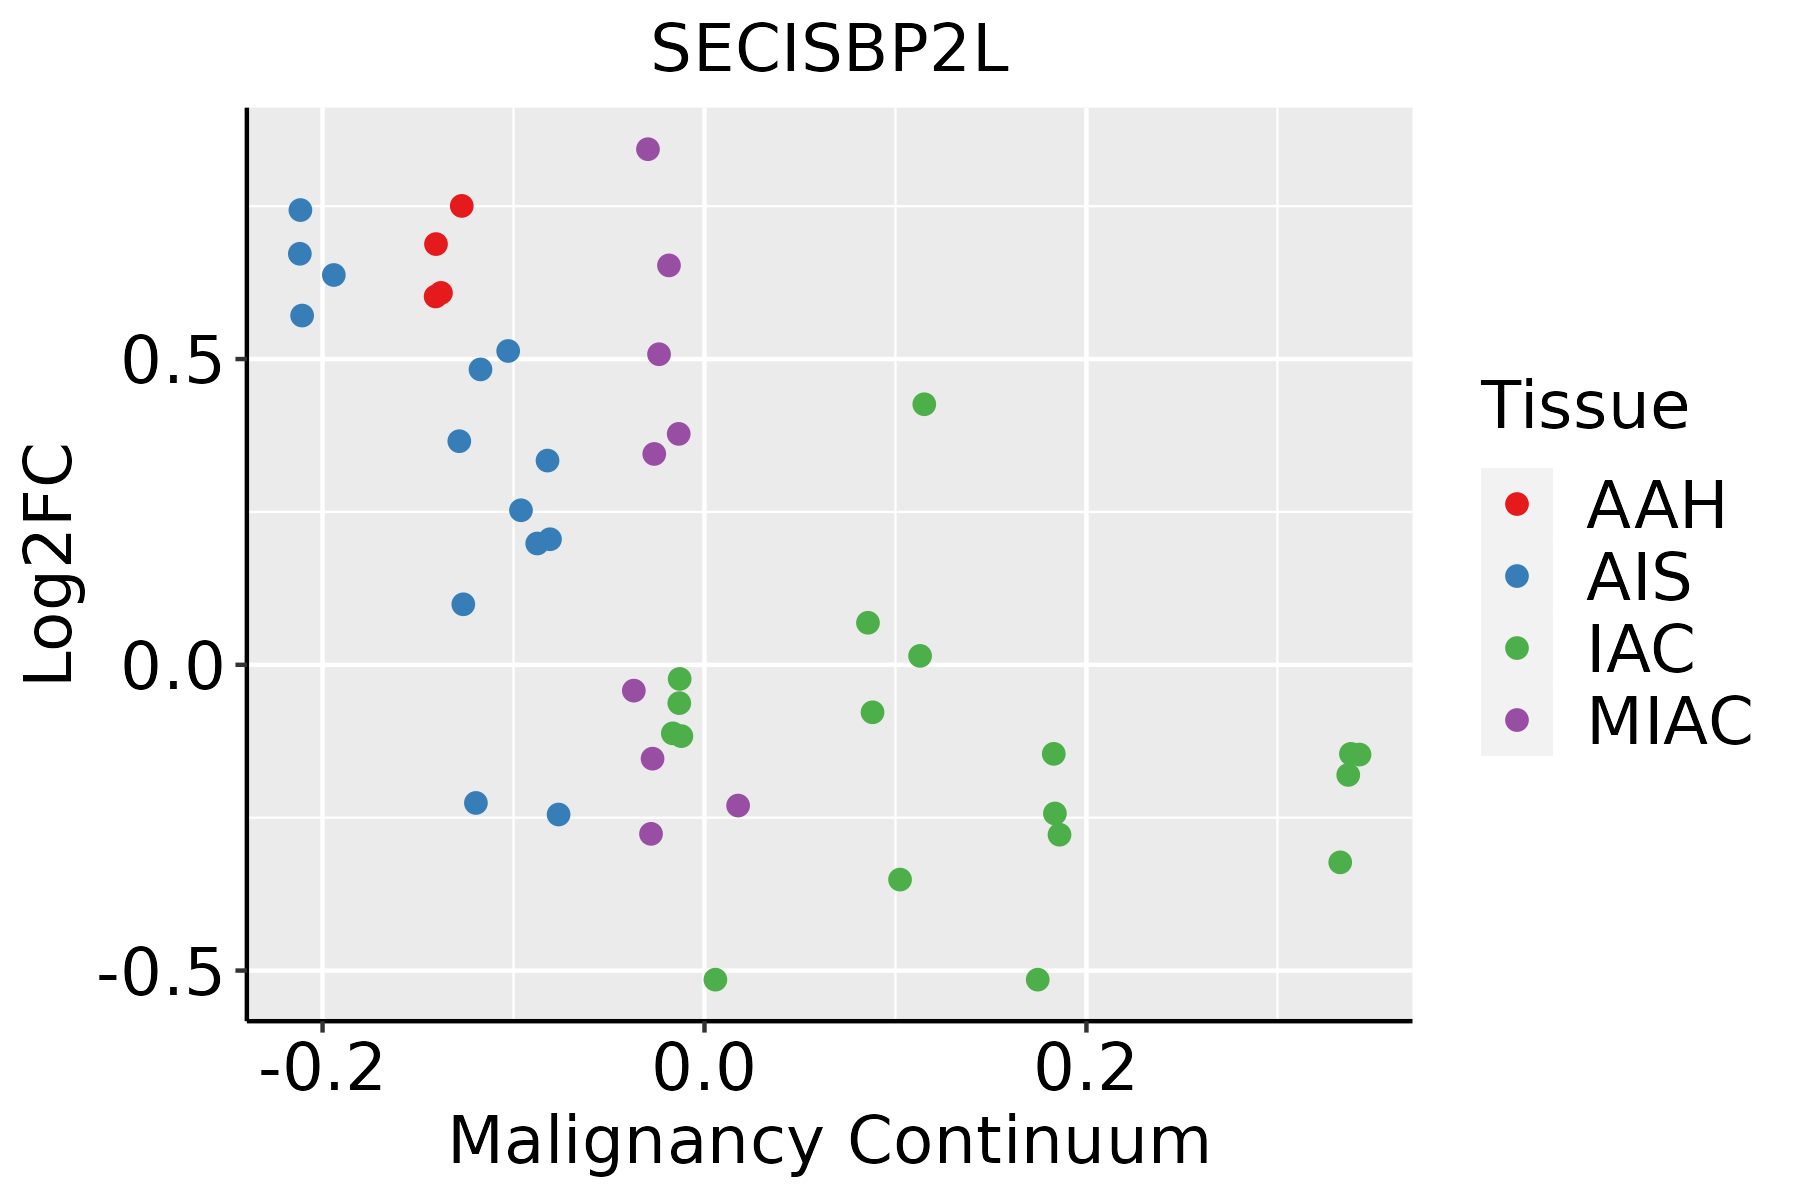 | AAH: Atypical adenomatous hyperplasia |
| AIS: Adenocarcinoma in situ | ||
| IAC: Invasive lung adenocarcinoma | ||
| MIA: Minimally invasive adenocarcinoma | ||
| Prostate | 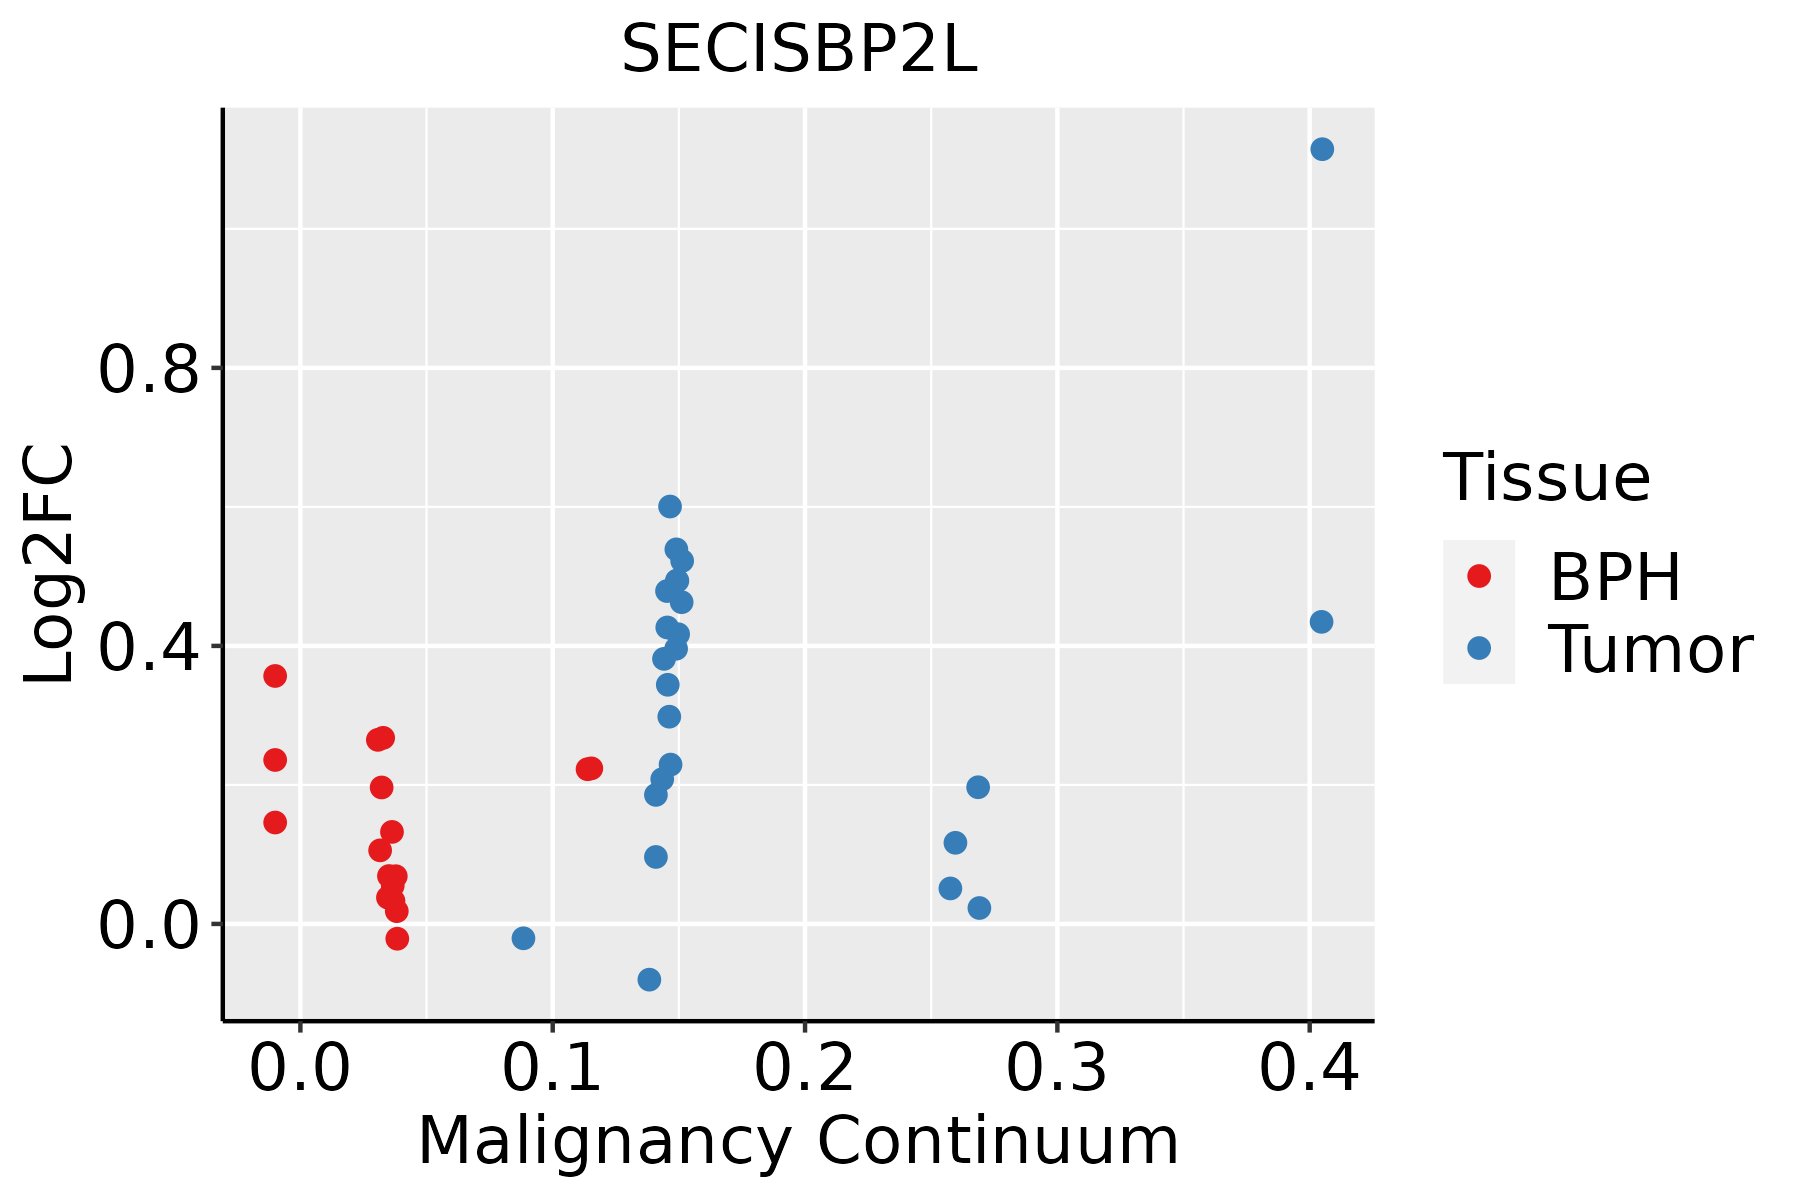 | BPH: Benign Prostatic Hyperplasia |
| Thyroid | 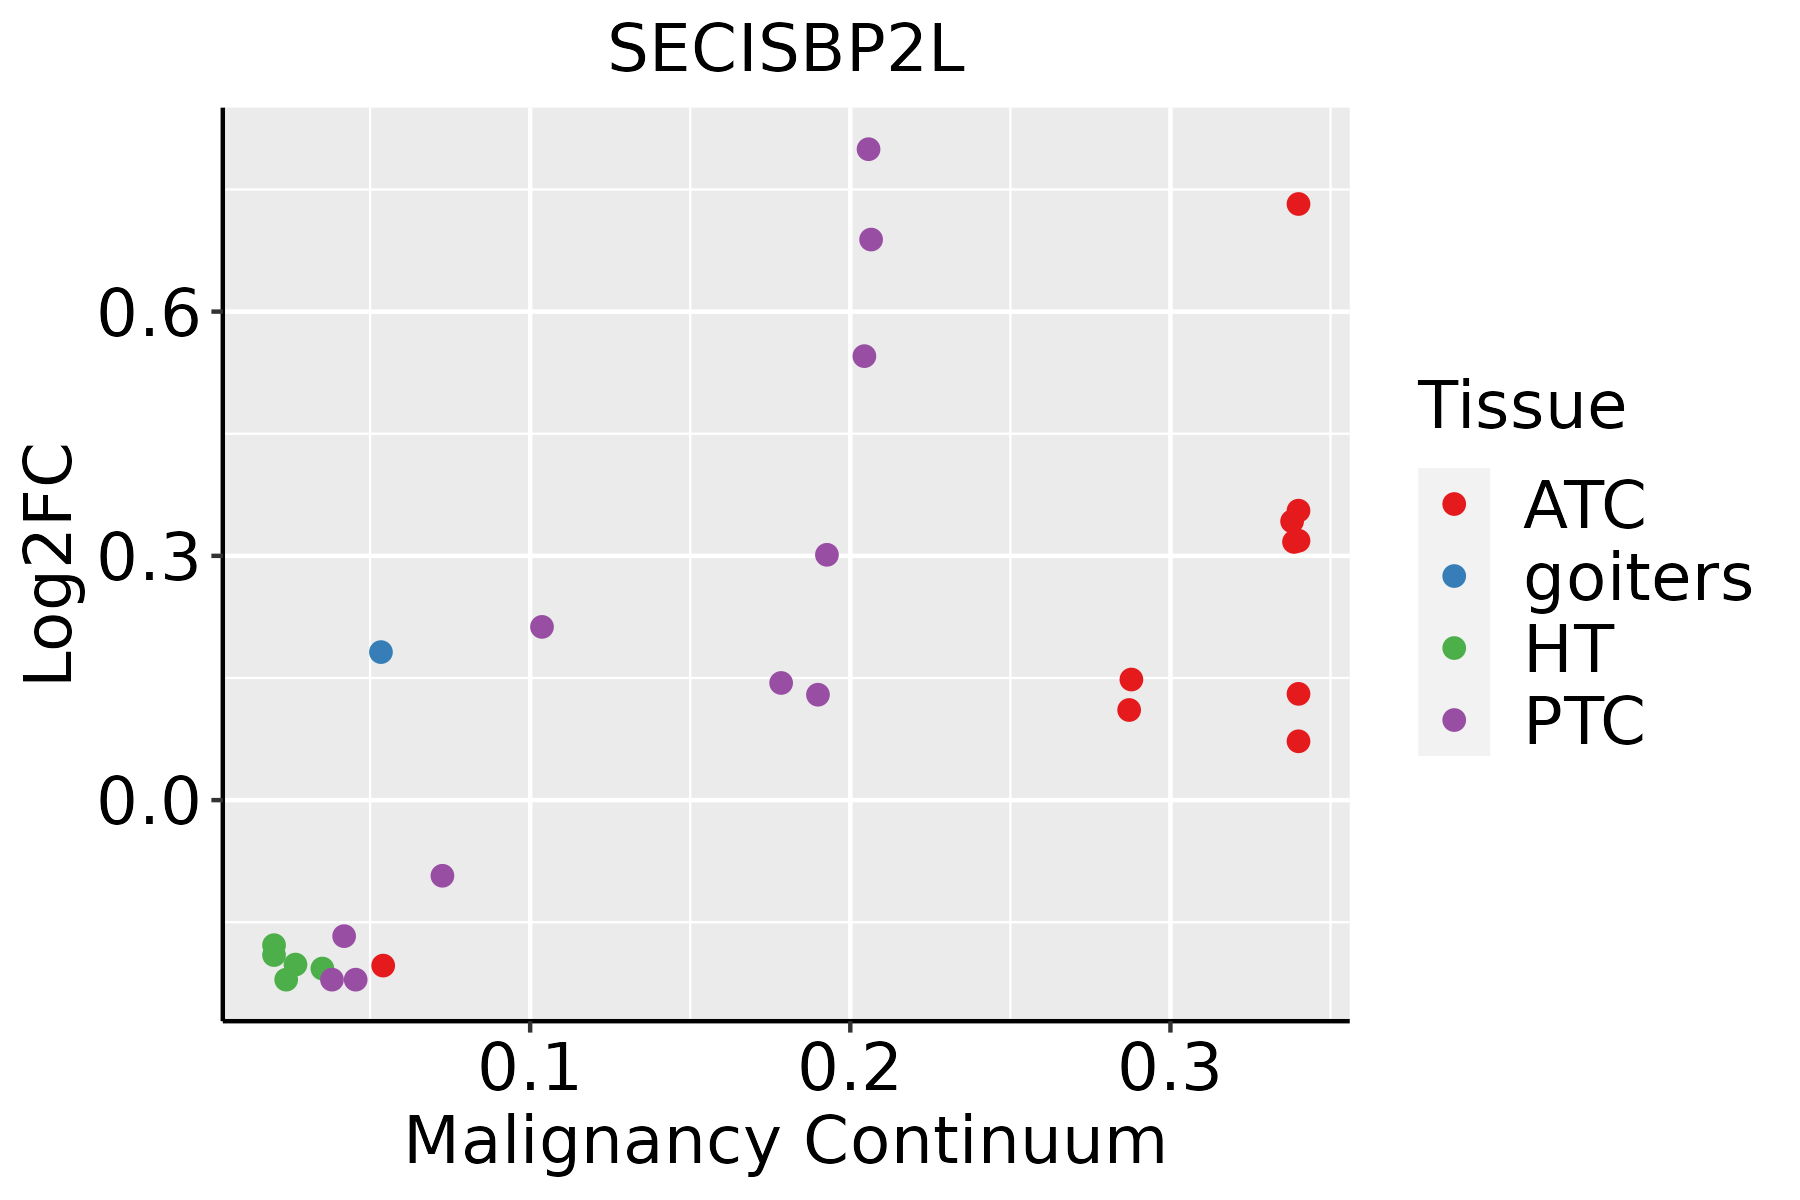 | ATC: Anaplastic thyroid cancer |
| HT: Hashimoto's thyroiditis | ||
| PTC: Papillary thyroid cancer |
| ∗log2FC in expression of this searched gene in stem-like cells from each diseased tissue sample relative to stem-like cells in normal samples in each tissue plotted against the malignancy continuum. Samples are colored based on if they are from different disease stage. |
Top |
Malignant transformation related pathway analysis |
| Find out the enriched GO biological processes and KEGG pathways involved in transition from healthy to precancer to cancer |
| Tissue | Disease Stage | Enriched GO biological Processes |
| Colorectum | AD |  |
| Colorectum | SER |  |
| Colorectum | MSS |  |
| Colorectum | MSI-H |  |
| Colorectum | FAP |  |
| ∗Top 15 enriched GO BP terms are showed in the bar plot of each disease state in each tissue. Each row represents a significant GO biological process which is colored according to the -log10(p.adjust). |
| Page: 1 2 3 4 5 6 7 8 9 |
| GO ID | Tissue | Disease Stage | Description | Gene Ratio | Bg Ratio | pvalue | p.adjust | Count |
| GO:0006417111 | Esophagus | ESCC | regulation of translation | 304/8552 | 468/18723 | 1.53e-17 | 1.33e-15 | 304 |
| GO:000641419 | Esophagus | ESCC | translational elongation | 41/8552 | 55/18723 | 1.26e-05 | 1.16e-04 | 41 |
| GO:00064177 | Liver | NAFLD | regulation of translation | 85/1882 | 468/18723 | 4.58e-08 | 4.54e-06 | 85 |
| GO:00064145 | Liver | NAFLD | translational elongation | 16/1882 | 55/18723 | 6.71e-05 | 1.44e-03 | 16 |
| GO:000641722 | Liver | HCC | regulation of translation | 287/7958 | 468/18723 | 8.79e-17 | 8.08e-15 | 287 |
| GO:000641412 | Liver | HCC | translational elongation | 36/7958 | 55/18723 | 4.94e-04 | 3.23e-03 | 36 |
| GO:00064178 | Lung | IAC | regulation of translation | 86/2061 | 468/18723 | 1.16e-06 | 6.18e-05 | 86 |
| GO:000641713 | Lung | AIS | regulation of translation | 78/1849 | 468/18723 | 2.68e-06 | 1.49e-04 | 78 |
| GO:000641723 | Lung | AAH | regulation of translation | 32/613 | 468/18723 | 7.62e-05 | 6.21e-03 | 32 |
| GO:000641733 | Lung | MIAC | regulation of translation | 51/967 | 468/18723 | 3.94e-07 | 6.52e-05 | 51 |
| GO:00064146 | Lung | MIAC | translational elongation | 10/967 | 55/18723 | 4.52e-04 | 1.25e-02 | 10 |
| GO:000641718 | Prostate | BPH | regulation of translation | 157/3107 | 468/18723 | 9.09e-20 | 5.63e-17 | 157 |
| GO:000641410 | Prostate | BPH | translational elongation | 20/3107 | 55/18723 | 3.18e-04 | 2.43e-03 | 20 |
| GO:000641719 | Prostate | Tumor | regulation of translation | 161/3246 | 468/18723 | 1.55e-19 | 8.74e-17 | 161 |
| GO:000641415 | Prostate | Tumor | translational elongation | 19/3246 | 55/18723 | 1.59e-03 | 9.67e-03 | 19 |
| GO:0006417113 | Thyroid | PTC | regulation of translation | 236/5968 | 468/18723 | 2.70e-17 | 2.52e-15 | 236 |
| GO:000641735 | Thyroid | ATC | regulation of translation | 236/6293 | 468/18723 | 2.39e-14 | 1.34e-12 | 236 |
| Page: 1 |
| Pathway ID | Tissue | Disease Stage | Description | Gene Ratio | Bg Ratio | pvalue | p.adjust | qvalue | Count |
| Page: 1 |
Top |
Cell-cell communication analysis |
| Identification of potential cell-cell interactions between two cell types and their ligand-receptor pairs for different disease states |
| Ligand | Receptor | LRpair | Pathway | Tissue | Disease Stage |
| Page: 1 |
Top |
Single-cell gene regulatory network inference analysis |
| Find out the significant the regulons (TFs) and the target genes of each regulon across cell types for different disease states |
| TF | Cell Type | Tissue | Disease Stage | Target Gene | RSS | Regulon Activity |
| ∗The dot plots of a searched regulon are shown for all cell subpopulations in each disease state of each tissue based on the regulon specific score inferred using pySCENIC and by calculating the average expression. |
| Page: 1 |
Top |
Somatic mutation of malignant transformation related genes |
| Annotation of somatic variants for genes involved in malignant transformation |
| Hugo Symbol | Variant Class | Variant Classification | dbSNP RS | HGVSc | HGVSp | HGVSp Short | SWISSPROT | BIOTYPE | SIFT | PolyPhen | Tumor Sample Barcode | Tissue | Histology | Sex | Age | Stage | Therapy Types | Drugs | Outcome |
| SECISBP2L | SNV | Missense_Mutation | c.1534A>T | p.Thr512Ser | p.T512S | Q93073 | protein_coding | tolerated(0.16) | benign(0.025) | TCGA-A8-A09Z-01 | Breast | breast invasive carcinoma | Female | >=65 | I/II | Unknown | Unknown | SD | |
| SECISBP2L | SNV | Missense_Mutation | rs769403849 | c.2147G>A | p.Arg716Lys | p.R716K | Q93073 | protein_coding | tolerated(0.06) | possibly_damaging(0.891) | TCGA-AC-A23H-01 | Breast | breast invasive carcinoma | Female | >=65 | I/II | Unknown | Unknown | PD |
| SECISBP2L | SNV | Missense_Mutation | novel | c.869G>T | p.Arg290Ile | p.R290I | Q93073 | protein_coding | deleterious_low_confidence(0) | probably_damaging(0.96) | TCGA-AN-A046-01 | Breast | breast invasive carcinoma | Female | >=65 | I/II | Unknown | Unknown | SD |
| SECISBP2L | SNV | Missense_Mutation | rs371138651 | c.682G>A | p.Ala228Thr | p.A228T | Q93073 | protein_coding | deleterious(0.04) | benign(0.403) | TCGA-AN-A046-01 | Breast | breast invasive carcinoma | Female | >=65 | I/II | Unknown | Unknown | SD |
| SECISBP2L | SNV | Missense_Mutation | c.52C>G | p.Pro18Ala | p.P18A | Q93073 | protein_coding | deleterious(0) | probably_damaging(0.994) | TCGA-AN-A0FW-01 | Breast | breast invasive carcinoma | Female | >=65 | III/IV | Unknown | Unknown | SD | |
| SECISBP2L | SNV | Missense_Mutation | novel | c.1388N>T | p.Ser463Leu | p.S463L | Q93073 | protein_coding | deleterious(0) | probably_damaging(0.941) | TCGA-AO-A0JC-01 | Breast | breast invasive carcinoma | Female | <65 | I/II | Chemotherapy | fluorouracil | SD |
| SECISBP2L | SNV | Missense_Mutation | novel | c.1609C>A | p.Pro537Thr | p.P537T | Q93073 | protein_coding | tolerated(0.16) | benign(0) | TCGA-D8-A1XQ-01 | Breast | breast invasive carcinoma | Female | >=65 | I/II | Unknown | Unknown | SD |
| SECISBP2L | SNV | Missense_Mutation | c.2371G>T | p.Val791Leu | p.V791L | Q93073 | protein_coding | tolerated(0.06) | possibly_damaging(0.891) | TCGA-E9-A5UP-01 | Breast | breast invasive carcinoma | Female | <65 | I/II | Hormone Therapy | tamoxiphen | SD | |
| SECISBP2L | SNV | Missense_Mutation | novel | c.1424N>A | p.Ala475Asp | p.A475D | Q93073 | protein_coding | deleterious(0.01) | benign(0.062) | TCGA-2W-A8YY-01 | Cervix | cervical & endocervical cancer | Female | <65 | I/II | Chemotherapy | cisplatin | CR |
| SECISBP2L | SNV | Missense_Mutation | novel | c.746G>C | p.Arg249Thr | p.R249T | Q93073 | protein_coding | deleterious(0.05) | probably_damaging(0.991) | TCGA-VS-A8EI-01 | Cervix | cervical & endocervical cancer | Female | <65 | I/II | Chemotherapy | cisplatin | CR |
| Page: 1 2 3 4 5 6 7 8 9 10 11 12 13 14 |
Top |
Related drugs of malignant transformation related genes |
| Identification of chemicals and drugs interact with genes involved in malignant transfromation |
| (DGIdb 4.0) |
| Entrez ID | Symbol | Category | Interaction Types | Drug Claim Name | Drug Name | PMIDs |
| Page: 1 |

Copyright 2023-Present -The University of Texas Health Science Center at Houston |