Schematic overview of the cellular and molecular mechanisms involved in the cancer progression, including the proposed cellular and molecular mechanisms in cancer cells trajectory. AT1: alveolar type 1 cells; AT2: alveolar type 2 cells; AAH: atypical adenomatous hyperplasia; AIS: adenocarcinoma in situ; MIA: minimally invasive adenocarcinoma; IA: invasive adenocarcinoma; EMT: epithelial-mesenchymal transition

Home

Download

Statistics

Help

Contact

Center for Computational Systems Medicine
leaf

Gene summary

leaf

Malignant transformation analysis

leaf

Malignant transformation related pathway analysis

leaf

Cell-cell communication analysis

leaf

Single-cell gene regulatory network inference analysis

leaf

Somatic mutation of malignant transformation related genes

leaf

Related drugs of malignant transformation related genes

Gene: SECISBP2

Gene summary for SECISBP2

check button Gene summary.

Gene informationSpeciesHuman
Gene symbol

SECISBP2

Gene ID

79048

Gene nameSECIS binding protein 2
Gene AliasSBP2
Cytomap9q22.2
Gene Typeprotein-coding
GO ID

GO:0000184

UniProtAcc

B4DZC7


Top

Malignant transformation analysis

check button Identification of the aberrant gene expression in precancerous and cancerous lesions by comparing the gene expression of stem-like cells in diseased tissues with normal stem cells
check button Malignant transformation involving gene list.
Entrez IDSymbolReplicatesSpeciesOrganTissueAdj P-valueLog2FCMalignancy
79048SECISBP2HTA11_347_2000001011HumanColorectumAD1.59e-022.86e-01-0.1954
79048SECISBP2HTA11_99999965104_69814HumanColorectumMSS1.12e-108.22e-010.281
79048SECISBP2HTA11_99999974143_84620HumanColorectumMSS7.38e-03-2.26e-010.3005
79048SECISBP2A015-C-203HumanColorectumFAP3.07e-25-1.87e-01-0.1294
79048SECISBP2A015-C-204HumanColorectumFAP1.28e-021.05e-02-0.0228
79048SECISBP2A014-C-040HumanColorectumFAP5.00e-03-9.28e-02-0.1184
79048SECISBP2A002-C-201HumanColorectumFAP8.96e-10-1.27e-010.0324
79048SECISBP2A002-C-203HumanColorectumFAP2.33e-02-1.42e-020.2786
79048SECISBP2A001-C-108HumanColorectumFAP7.03e-12-1.33e-02-0.0272
79048SECISBP2A002-C-205HumanColorectumFAP1.01e-15-1.80e-01-0.1236
79048SECISBP2A015-C-006HumanColorectumFAP4.17e-11-1.47e-01-0.0994
79048SECISBP2A015-C-106HumanColorectumFAP4.01e-071.66e-02-0.0511
79048SECISBP2A002-C-114HumanColorectumFAP1.41e-13-1.58e-01-0.1561
79048SECISBP2A015-C-104HumanColorectumFAP7.27e-27-4.41e-02-0.1899
79048SECISBP2A001-C-014HumanColorectumFAP2.48e-121.32e-020.0135
79048SECISBP2A002-C-016HumanColorectumFAP4.29e-17-1.05e-010.0521
79048SECISBP2A015-C-002HumanColorectumFAP5.09e-097.23e-03-0.0763
79048SECISBP2A001-C-203HumanColorectumFAP3.40e-085.24e-02-0.0481
79048SECISBP2A002-C-116HumanColorectumFAP2.34e-29-2.38e-01-0.0452
79048SECISBP2A014-C-008HumanColorectumFAP5.23e-10-9.63e-02-0.191
Page: 1 2 3 4 5 6 7 8 

check button Transcriptomic changes along malignancy continuum.
TissueExpression DynamicsAbbreviation
Colorectum (GSE201348)The image shows the transcriptomic changes along malignancy continuum.log2FC in expression of this searched gene in stem-like cells from each diseased tissue sample relative to stem-like cells in normal samples in each tissue plotted against the malignancy continuum. Samples are colored based on if they are from different disease stage.FAP: Familial adenomatous polyposis
CRC: Colorectal cancer
Colorectum (HTA11)The image shows the transcriptomic changes along malignancy continuum.log2FC in expression of this searched gene in stem-like cells from each diseased tissue sample relative to stem-like cells in normal samples in each tissue plotted against the malignancy continuum. Samples are colored based on if they are from different disease stage.AD: Adenomas
SER: Sessile serrated lesions
MSI-H: Microsatellite-high colorectal cancer
MSS: Microsatellite stable colorectal cancer
EsophagusThe image shows the transcriptomic changes along malignancy continuum.log2FC in expression of this searched gene in stem-like cells from each diseased tissue sample relative to stem-like cells in normal samples in each tissue plotted against the malignancy continuum. Samples are colored based on if they are from different disease stage.ESCC: Esophageal squamous cell carcinoma
HGIN: High-grade intraepithelial neoplasias
LGIN: Low-grade intraepithelial neoplasias
LiverThe image shows the transcriptomic changes along malignancy continuum.log2FC in expression of this searched gene in stem-like cells from each diseased tissue sample relative to stem-like cells in normal samples in each tissue plotted against the malignancy continuum. Samples are colored based on if they are from different disease stage.
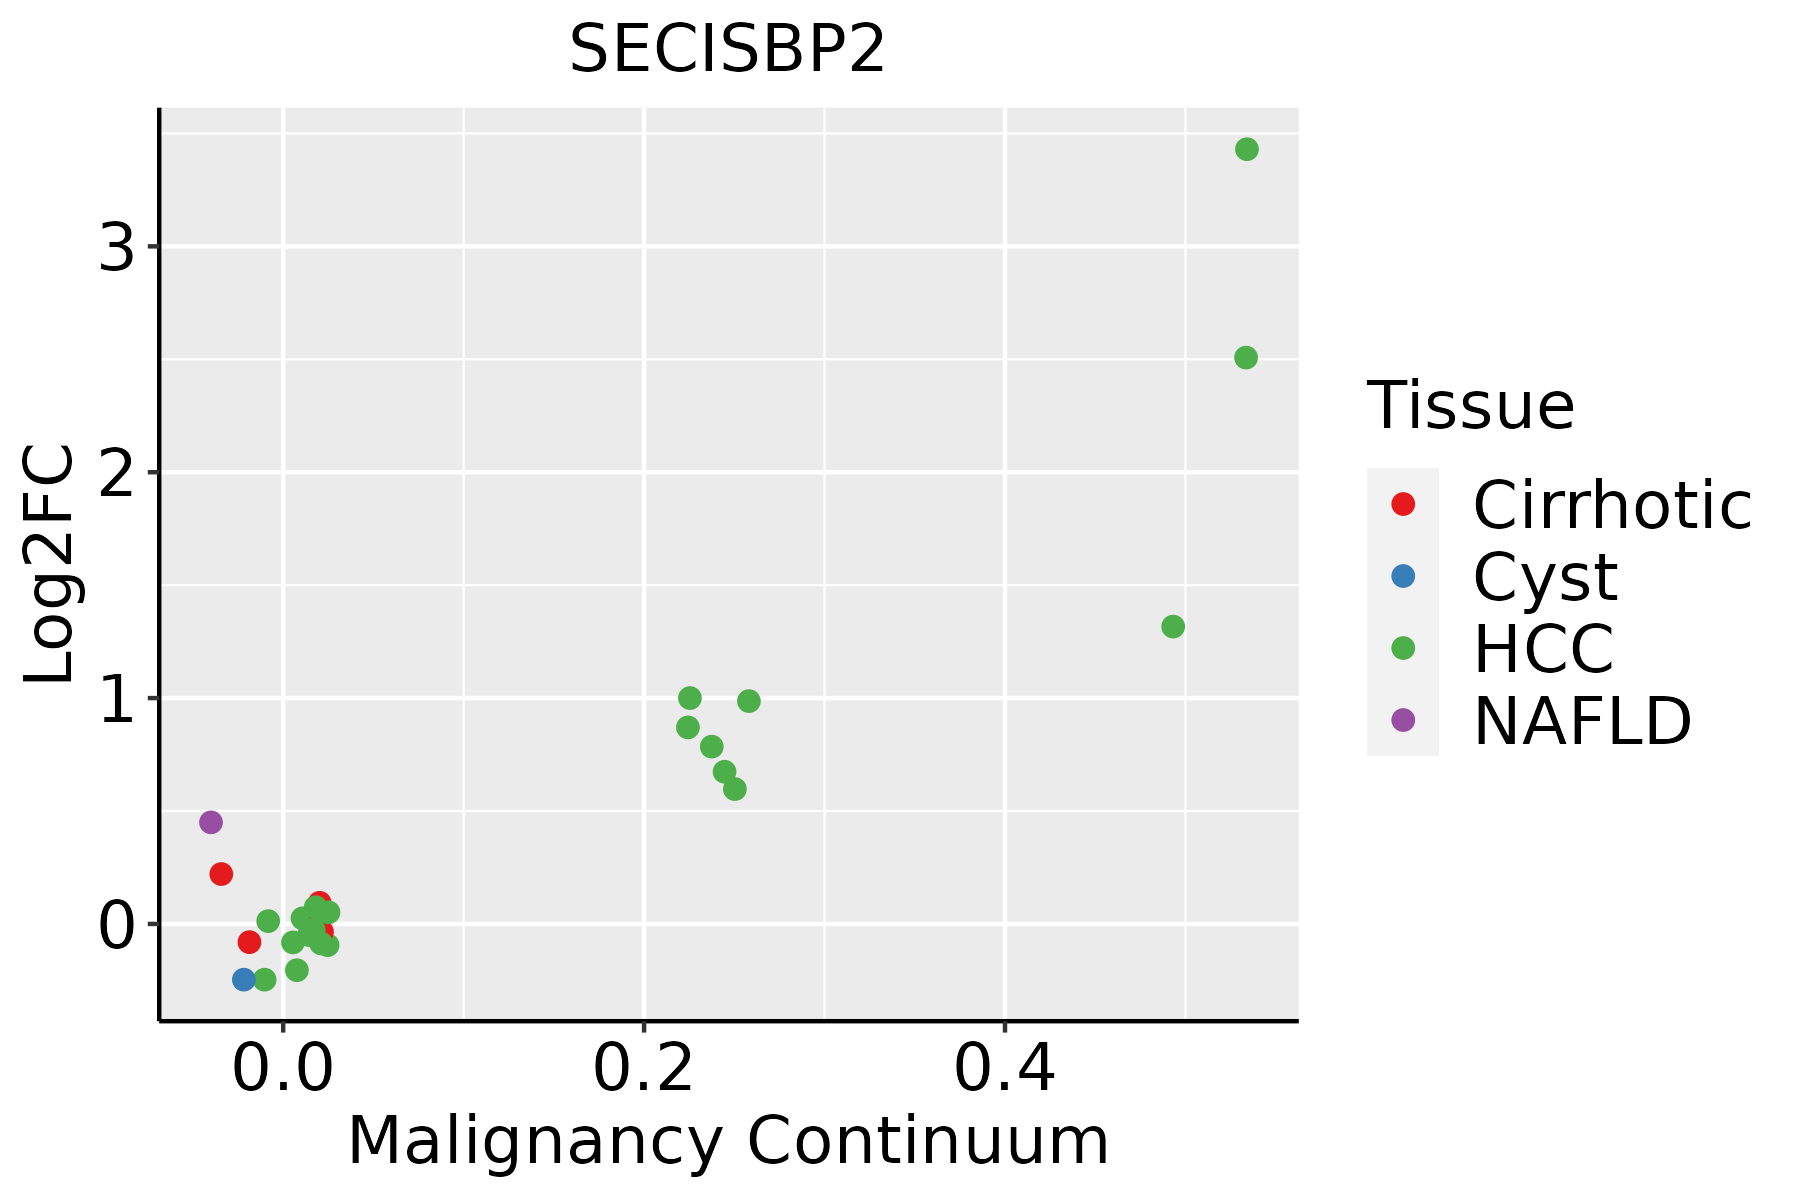
HCC: Hepatocellular carcinoma
NAFLD: Non-alcoholic fatty liver disease
Oral CavityThe image shows the transcriptomic changes along malignancy continuum.log2FC in expression of this searched gene in stem-like cells from each diseased tissue sample relative to stem-like cells in normal samples in each tissue plotted against the malignancy continuum. Samples are colored based on if they are from different disease stage.
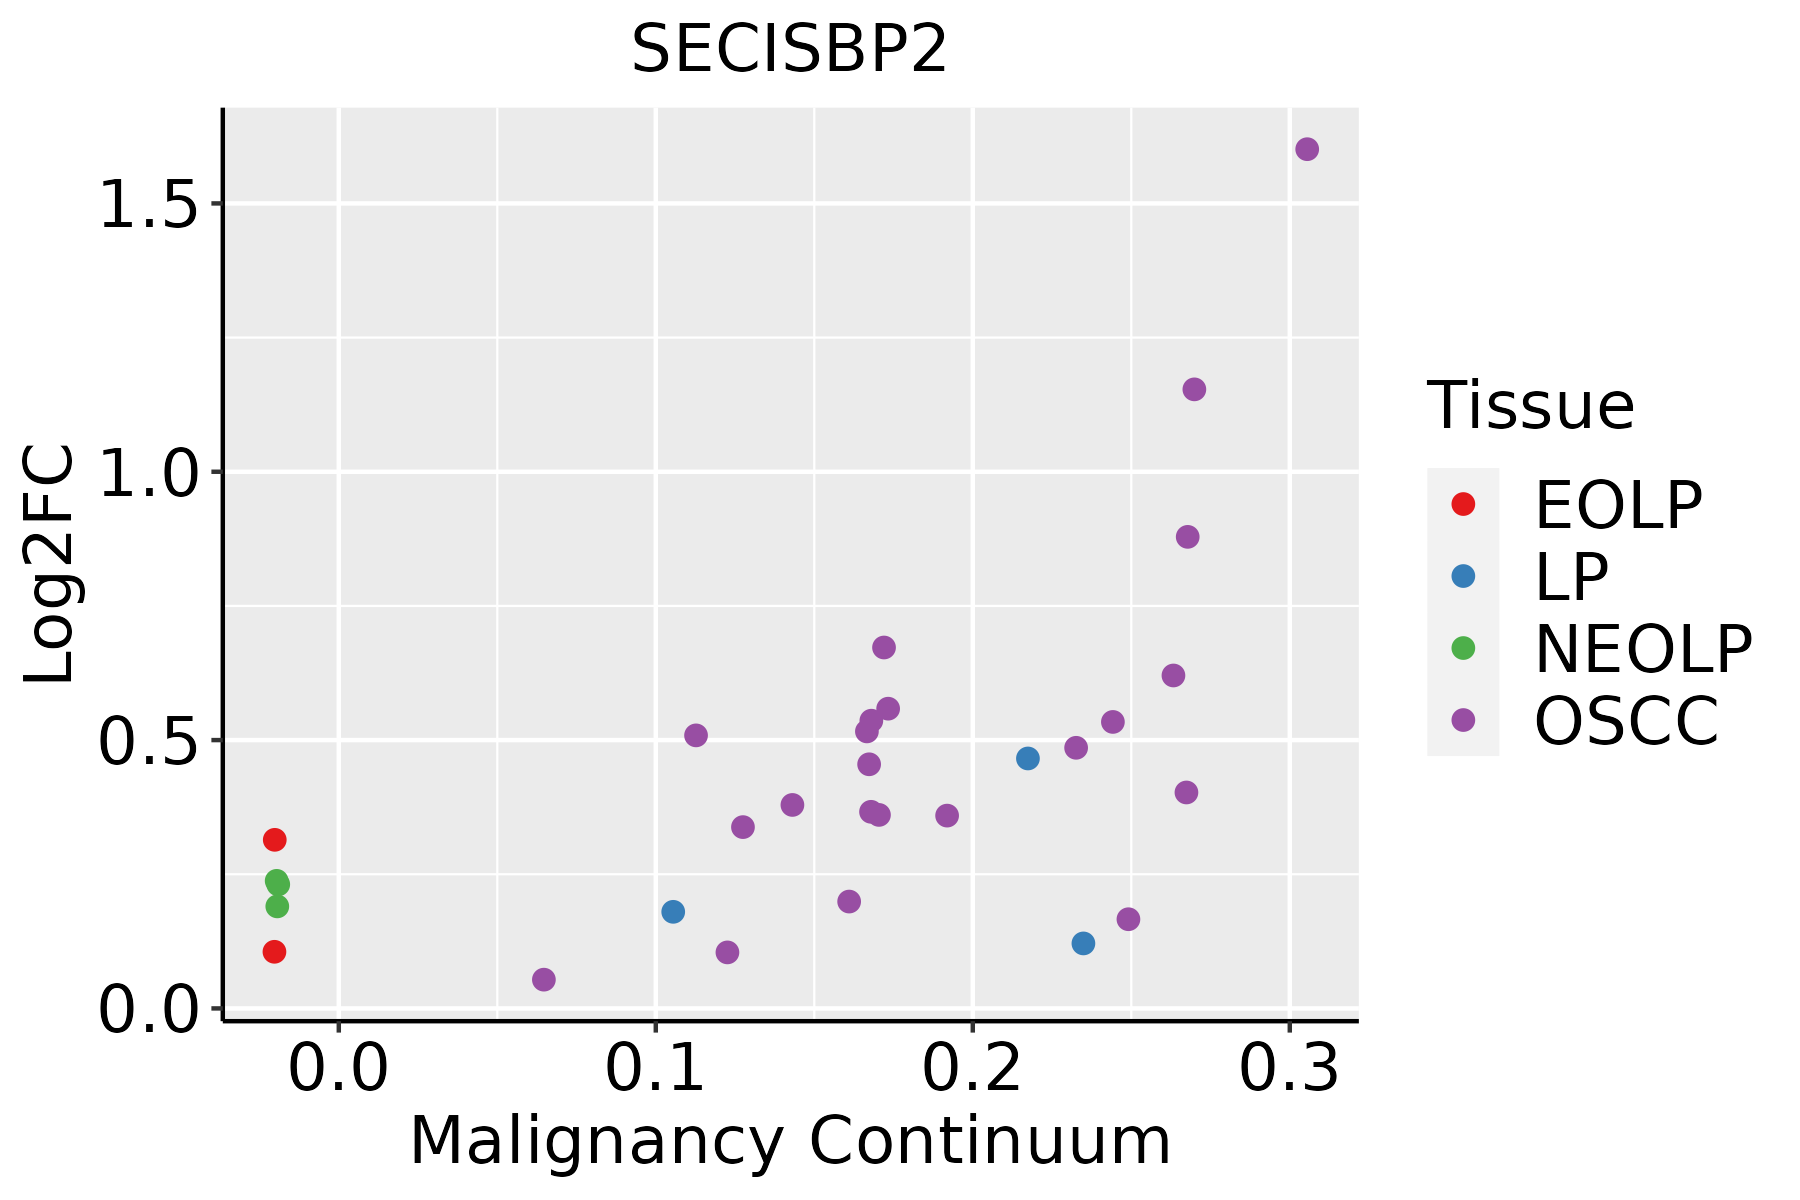
EOLP: Erosive Oral lichen planus
LP: leukoplakia
NEOLP: Non-erosive oral lichen planus
OSCC: Oral squamous cell carcinoma
ProstateThe image shows the transcriptomic changes along malignancy continuum.log2FC in expression of this searched gene in stem-like cells from each diseased tissue sample relative to stem-like cells in normal samples in each tissue plotted against the malignancy continuum. Samples are colored based on if they are from different disease stage.BPH: Benign Prostatic Hyperplasia
SkinThe image shows the transcriptomic changes along malignancy continuum.log2FC in expression of this searched gene in stem-like cells from each diseased tissue sample relative to stem-like cells in normal samples in each tissue plotted against the malignancy continuum. Samples are colored based on if they are from different disease stage.
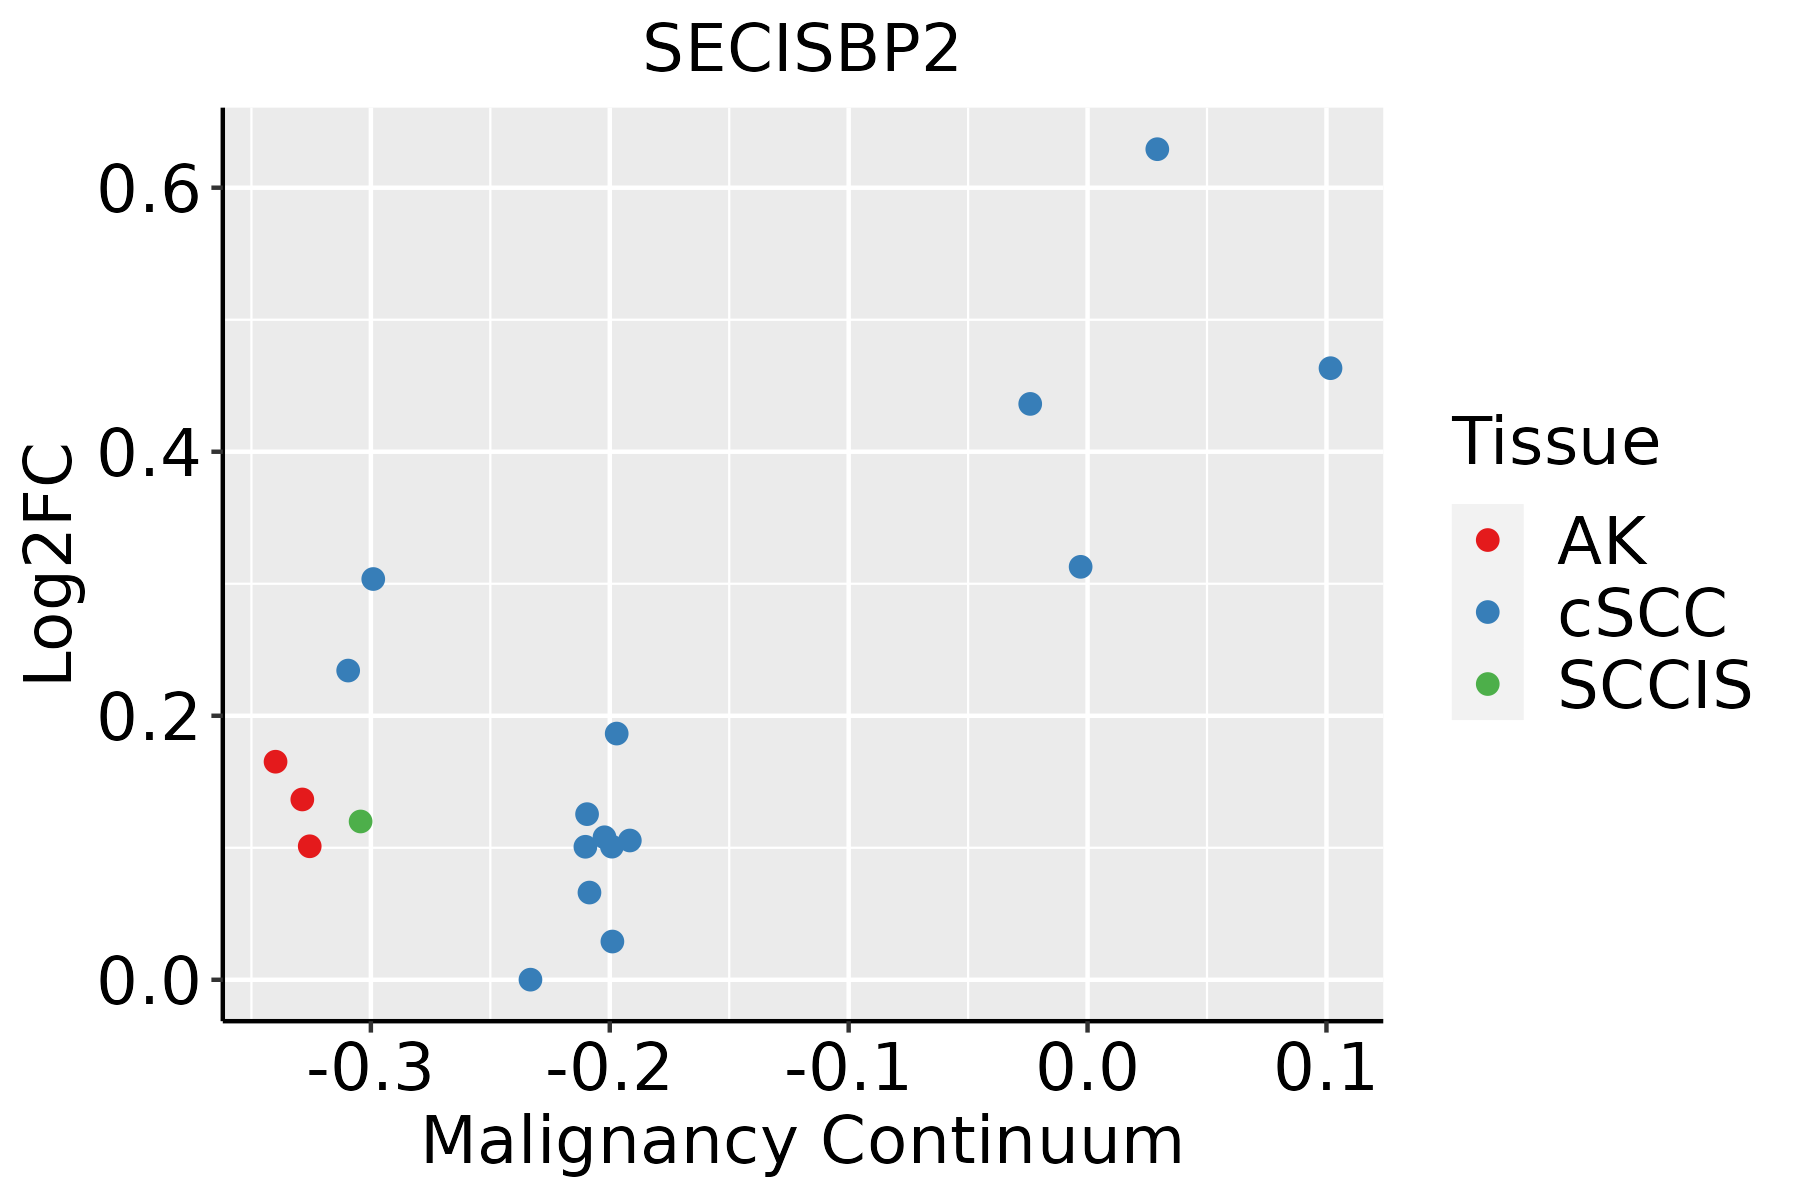
AK: Actinic keratosis
cSCC: Cutaneous squamous cell carcinoma
SCCIS:squamous cell carcinoma in situ
ThyroidThe image shows the transcriptomic changes along malignancy continuum.log2FC in expression of this searched gene in stem-like cells from each diseased tissue sample relative to stem-like cells in normal samples in each tissue plotted against the malignancy continuum. Samples are colored based on if they are from different disease stage.
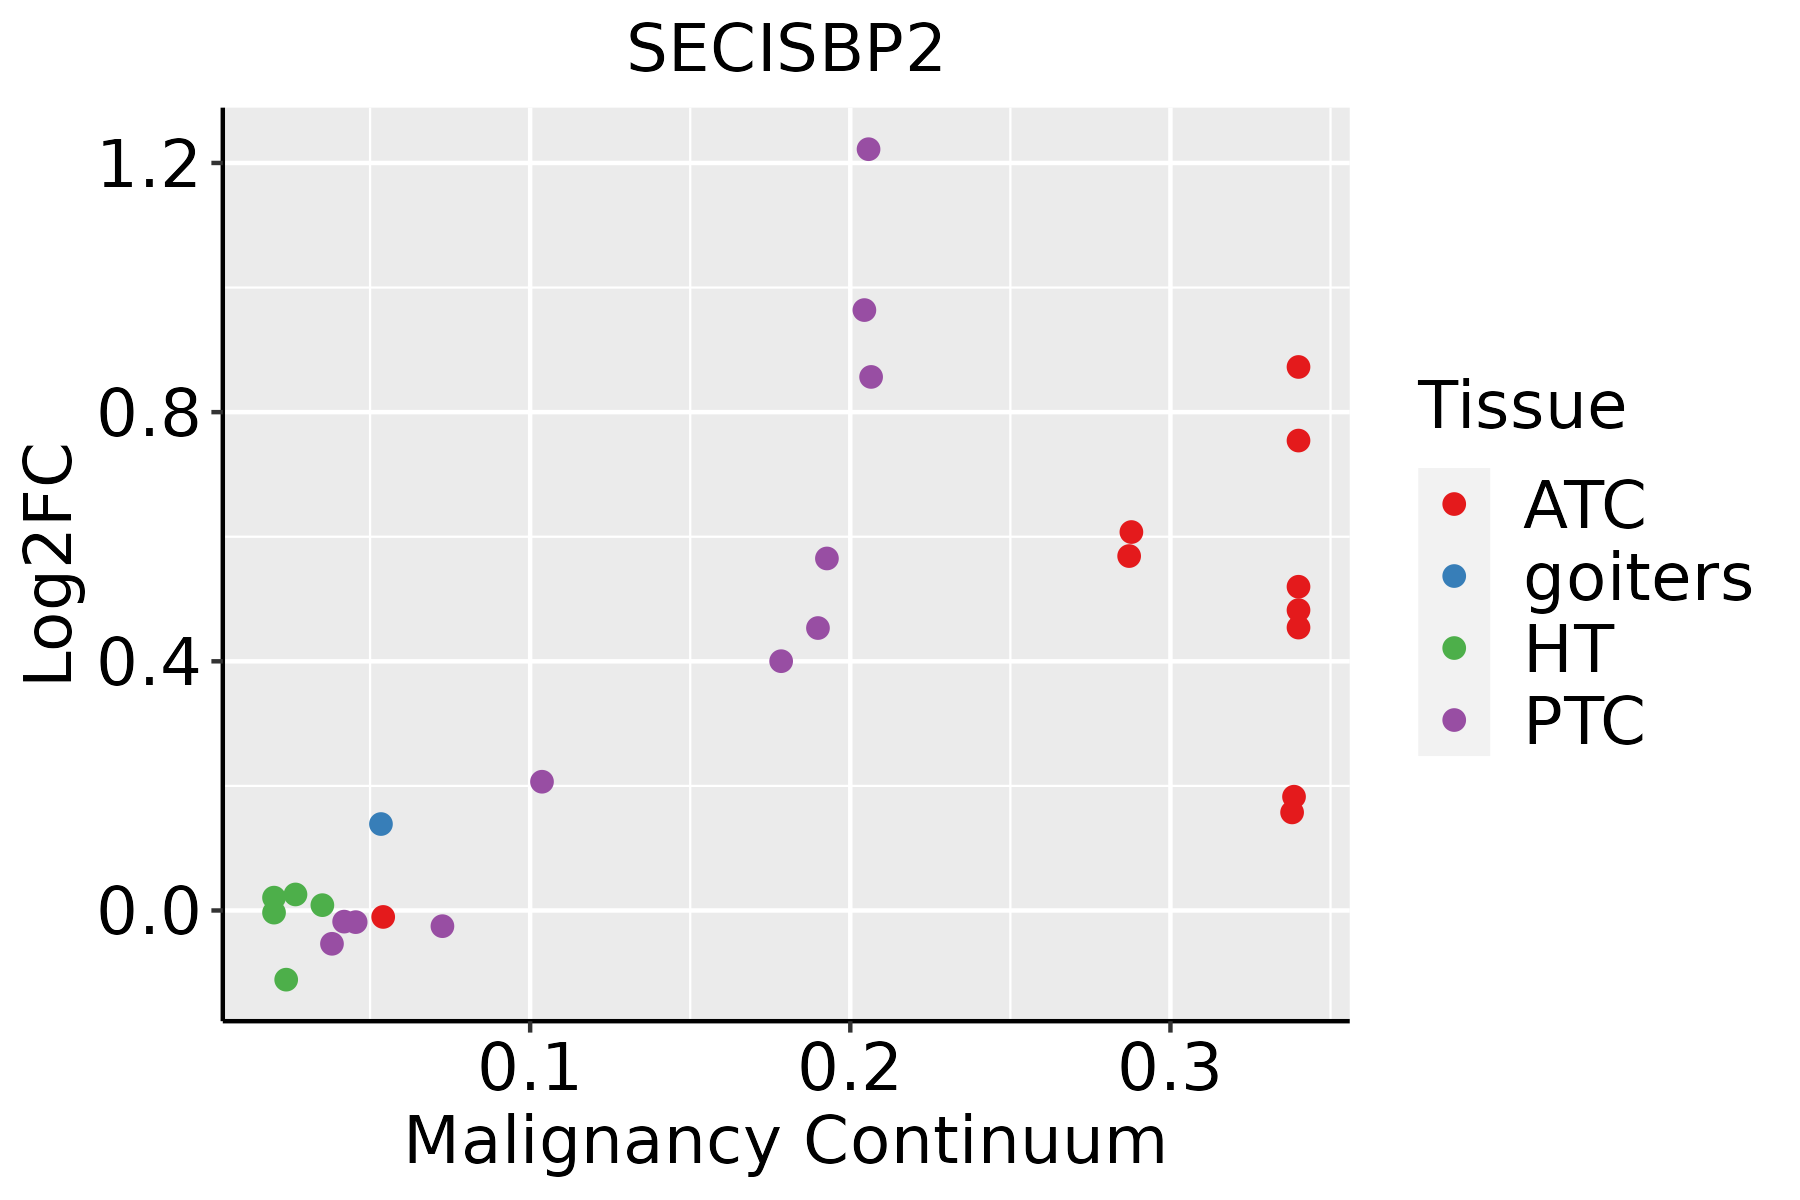
ATC: Anaplastic thyroid cancer
HT: Hashimoto's thyroiditis
PTC: Papillary thyroid cancer
∗log2FC in expression of this searched gene in stem-like cells from each diseased tissue sample relative to stem-like cells in normal samples in each tissue plotted against the malignancy continuum. Samples are colored based on if they are from different disease stage.

Top

Malignant transformation related pathway analysis

check buttonFind out the enriched GO biological processes and KEGG pathways involved in transition from healthy to precancer to cancer
check button Figure of enriched GO biological processes.
TissueDisease StageEnriched GO biological Processes
ColorectumADGO analysis - Figure of enriched GO biological processes: Top 15 enriched GO BP terms are showed in the bar plot of each disease state in each tissue. Each row represents a significant GO biological process which is colored according to the -log10(p.adjust).
ColorectumSERGO analysis - Figure of enriched GO biological processes: Top 15 enriched GO BP terms are showed in the bar plot of each disease state in each tissue. Each row represents a significant GO biological process which is colored according to the -log10(p.adjust).
ColorectumMSSGO analysis - Figure of enriched GO biological processes: Top 15 enriched GO BP terms are showed in the bar plot of each disease state in each tissue. Each row represents a significant GO biological process which is colored according to the -log10(p.adjust).
ColorectumMSI-HGO analysis - Figure of enriched GO biological processes: Top 15 enriched GO BP terms are showed in the bar plot of each disease state in each tissue. Each row represents a significant GO biological process which is colored according to the -log10(p.adjust).
ColorectumFAPGO analysis - Figure of enriched GO biological processes: Top 15 enriched GO BP terms are showed in the bar plot of each disease state in each tissue. Each row represents a significant GO biological process which is colored according to the -log10(p.adjust).
∗Top 15 enriched GO BP terms are showed in the bar plot of each disease state in each tissue. Each row represents a significant GO biological process which is colored according to the -log10(p.adjust).
Page: 1 2 3 4 5 6 7 8 9 

check button Enriched GO biological processes.
GO IDTissueDisease StageDescriptionGene RatioBg Ratiopvaluep.adjustCount
GO:1903311ColorectumADregulation of mRNA metabolic process117/3918288/187231.69e-144.23e-12117
GO:0009895ColorectumADnegative regulation of catabolic process124/3918320/187231.66e-133.35e-11124
GO:0031330ColorectumADnegative regulation of cellular catabolic process104/3918262/187232.66e-123.96e-10104
GO:0006401ColorectumADRNA catabolic process102/3918278/187238.64e-106.76e-08102
GO:0044270ColorectumADcellular nitrogen compound catabolic process147/3918451/187233.35e-092.23e-07147
GO:0046700ColorectumADheterocycle catabolic process145/3918445/187234.37e-092.84e-07145
GO:0006402ColorectumADmRNA catabolic process87/3918232/187234.40e-092.84e-0787
GO:0034655ColorectumADnucleobase-containing compound catabolic process133/3918407/187231.56e-089.12e-07133
GO:0019439ColorectumADaromatic compound catabolic process146/3918467/187237.48e-083.84e-06146
GO:1901361ColorectumADorganic cyclic compound catabolic process153/3918495/187238.23e-084.18e-06153
GO:0061013ColorectumADregulation of mRNA catabolic process64/3918166/187231.44e-076.59e-0664
GO:0006417ColorectumADregulation of translation141/3918468/187231.32e-064.22e-05141
GO:1903312ColorectumADnegative regulation of mRNA metabolic process37/391892/187231.95e-054.01e-0437
GO:1902369ColorectumADnegative regulation of RNA catabolic process30/391875/187231.30e-041.87e-0330
GO:0000956ColorectumADnuclear-transcribed mRNA catabolic process40/3918112/187232.11e-042.79e-0340
GO:1902373ColorectumADnegative regulation of mRNA catabolic process24/391863/187231.34e-031.17e-0224
GO:0006414ColorectumADtranslational elongation21/391855/187232.53e-031.93e-0221
GO:19033112ColorectumMSSregulation of mRNA metabolic process115/3467288/187231.23e-176.41e-15115
GO:00064012ColorectumMSSRNA catabolic process102/3467278/187235.07e-131.02e-10102
GO:00064022ColorectumMSSmRNA catabolic process89/3467232/187238.70e-131.60e-1089
Page: 1 2 3 4 5 6 7 8 9 10 11 12 13 14 15 16 

check button Enriched KEGG pathways.
Pathway IDTissueDisease StageDescriptionGene RatioBg Ratiopvaluep.adjustqvalueCount
Page: 1 

Top

Cell-cell communication analysis

check buttonIdentification of potential cell-cell interactions between two cell types and their ligand-receptor pairs for different disease states
LigandReceptorLRpairPathwayTissueDisease Stage
Page: 1 

Top

Single-cell gene regulatory network inference analysis

check buttonFind out the significant the regulons (TFs) and the target genes of each regulon across cell types for different disease states
TFCell TypeTissueDisease StageTarget GeneRSSRegulon Activity
∗The dot plots of a searched regulon are shown for all cell subpopulations in each disease state of each tissue based on the regulon specific score inferred using pySCENIC and by calculating the average expression.
Page: 1 

Top

Somatic mutation of malignant transformation related genes

check buttonAnnotation of somatic variants for genes involved in malignant transformation
Hugo SymbolVariant ClassVariant ClassificationdbSNP RSHGVScHGVSpHGVSp ShortSWISSPROTBIOTYPESIFTPolyPhenTumor Sample BarcodeTissueHistologySexAgeStageTherapy TypesDrugsOutcome
SECISBP2SNVMissense_Mutationrs147681365c.1720N>Ap.Glu574Lysp.E574KQ96T21protein_codingtolerated(0.7)benign(0.01)TCGA-BH-A18G-01Breastbreast invasive carcinomaFemale>=65I/IIUnknownUnknownSD
SECISBP2SNVMissense_Mutationc.92N>Gp.Asn31Serp.N31SQ96T21protein_codingtolerated(0.44)benign(0.007)TCGA-E9-A1RE-01Breastbreast invasive carcinomaFemale>=65III/IVHormone TherapytamoxiphenSD
SECISBP2SNVMissense_Mutationnovelc.2057N>Cp.Leu686Prop.L686PQ96T21protein_codingdeleterious(0)probably_damaging(1)TCGA-GM-A3NY-01Breastbreast invasive carcinomaFemale>=65I/IIHormone TherapyarimidexSD
SECISBP2insertionNonsense_Mutationnovelc.572_573insTAGCTCCGGAAATTAACAGAAACATTTGCTGGAAGGAGGp.Ser191_Asp192insSerSerGlyAsnTerGlnLysHisLeuLeuGluGlyGlyp.S191_D192insSSGN*QKHLLEGGQ96T21protein_codingTCGA-A8-A09C-01Breastbreast invasive carcinomaFemale>=65I/IIUnknownUnknownSD
SECISBP2SNVMissense_Mutationnovelc.158N>Cp.Phe53Serp.F53SQ96T21protein_codingtolerated(0.06)benign(0.348)TCGA-2W-A8YY-01Cervixcervical & endocervical cancerFemale<65I/IIChemotherapycisplatinCR
SECISBP2SNVMissense_Mutationnovelc.2011N>Tp.Arg671Cysp.R671CQ96T21protein_codingdeleterious(0)possibly_damaging(0.906)TCGA-2W-A8YY-01Cervixcervical & endocervical cancerFemale<65I/IIChemotherapycisplatinCR
SECISBP2SNVMissense_Mutationc.2464N>Ap.Glu822Lysp.E822KQ96T21protein_codingtolerated(1)benign(0.02)TCGA-DG-A2KK-01Cervixcervical & endocervical cancerFemale<65III/IVChemotherapycisplatinSD
SECISBP2SNVMissense_Mutationc.1863N>Gp.Phe621Leup.F621LQ96T21protein_codingtolerated(1)benign(0)TCGA-EX-A69M-01Cervixcervical & endocervical cancerFemale<65I/IIUnknownUnknownPD
SECISBP2SNVMissense_Mutationc.2146G>Ap.Asp716Asnp.D716NQ96T21protein_codingtolerated(0.05)probably_damaging(0.999)TCGA-MY-A5BD-01Cervixcervical & endocervical cancerFemale<65I/IIChemotherapycisplatinCR
SECISBP2insertionIn_Frame_Insnovelc.1619_1633dupGGCAAGAGAGAAAGCp.Arg540_Lys544dupp.R540_K544dupQ96T21protein_codingTCGA-JW-AAVH-01Cervixcervical & endocervical cancerFemale<65I/IIUnknownUnknownSD
Page: 1 2 3 4 5 6 7 

Top

Related drugs of malignant transformation related genes

check buttonIdentification of chemicals and drugs interact with genes involved in malignant transfromation
(DGIdb 4.0)
Entrez IDSymbolCategoryInteraction TypesDrug Claim NameDrug NamePMIDs
Page: 1