
|
|||||
|
 | |
| |
| |
| |
| |
| |
|
Gene: SEC63 |
Gene summary for SEC63 |
| Gene information | Species | Human | Gene symbol | SEC63 | Gene ID | 11231 |
| Gene name | SEC63 homolog, protein translocation regulator | |
| Gene Alias | DNAJC23 | |
| Cytomap | 6q21 | |
| Gene Type | protein-coding | GO ID | GO:0001889 | UniProtAcc | A0A0S2Z5M1 |
Top |
Malignant transformation analysis |
| Identification of the aberrant gene expression in precancerous and cancerous lesions by comparing the gene expression of stem-like cells in diseased tissues with normal stem cells |
| Entrez ID | Symbol | Replicates | Species | Organ | Tissue | Adj P-value | Log2FC | Malignancy |
| 11231 | SEC63 | LZE4T | Human | Esophagus | ESCC | 1.40e-10 | 3.60e-01 | 0.0811 |
| 11231 | SEC63 | LZE5T | Human | Esophagus | ESCC | 9.14e-03 | 2.44e-01 | 0.0514 |
| 11231 | SEC63 | LZE7T | Human | Esophagus | ESCC | 3.09e-05 | 7.09e-01 | 0.0667 |
| 11231 | SEC63 | LZE8T | Human | Esophagus | ESCC | 2.35e-05 | 1.73e-01 | 0.067 |
| 11231 | SEC63 | LZE20T | Human | Esophagus | ESCC | 1.13e-03 | 8.13e-02 | 0.0662 |
| 11231 | SEC63 | LZE24T | Human | Esophagus | ESCC | 5.00e-09 | 5.50e-01 | 0.0596 |
| 11231 | SEC63 | LZE6T | Human | Esophagus | ESCC | 1.67e-06 | 8.43e-02 | 0.0845 |
| 11231 | SEC63 | P2T-E | Human | Esophagus | ESCC | 4.06e-50 | 1.08e+00 | 0.1177 |
| 11231 | SEC63 | P4T-E | Human | Esophagus | ESCC | 6.50e-26 | 8.07e-01 | 0.1323 |
| 11231 | SEC63 | P5T-E | Human | Esophagus | ESCC | 3.79e-17 | 5.16e-01 | 0.1327 |
| 11231 | SEC63 | P8T-E | Human | Esophagus | ESCC | 1.51e-23 | 4.81e-01 | 0.0889 |
| 11231 | SEC63 | P9T-E | Human | Esophagus | ESCC | 9.93e-09 | 3.61e-01 | 0.1131 |
| 11231 | SEC63 | P10T-E | Human | Esophagus | ESCC | 1.23e-46 | 1.13e+00 | 0.116 |
| 11231 | SEC63 | P11T-E | Human | Esophagus | ESCC | 5.10e-13 | 5.76e-01 | 0.1426 |
| 11231 | SEC63 | P12T-E | Human | Esophagus | ESCC | 2.65e-23 | 6.69e-01 | 0.1122 |
| 11231 | SEC63 | P15T-E | Human | Esophagus | ESCC | 2.68e-17 | 5.49e-01 | 0.1149 |
| 11231 | SEC63 | P16T-E | Human | Esophagus | ESCC | 1.35e-51 | 1.12e+00 | 0.1153 |
| 11231 | SEC63 | P17T-E | Human | Esophagus | ESCC | 7.53e-03 | 4.22e-01 | 0.1278 |
| 11231 | SEC63 | P19T-E | Human | Esophagus | ESCC | 5.87e-03 | 4.98e-01 | 0.1662 |
| 11231 | SEC63 | P20T-E | Human | Esophagus | ESCC | 1.46e-13 | 3.01e-01 | 0.1124 |
| Page: 1 2 3 4 5 6 7 8 |
| Tissue | Expression Dynamics | Abbreviation |
| Esophagus |  | ESCC: Esophageal squamous cell carcinoma |
| HGIN: High-grade intraepithelial neoplasias | ||
| LGIN: Low-grade intraepithelial neoplasias | ||
| Liver |  | HCC: Hepatocellular carcinoma |
| NAFLD: Non-alcoholic fatty liver disease | ||
| Oral Cavity | 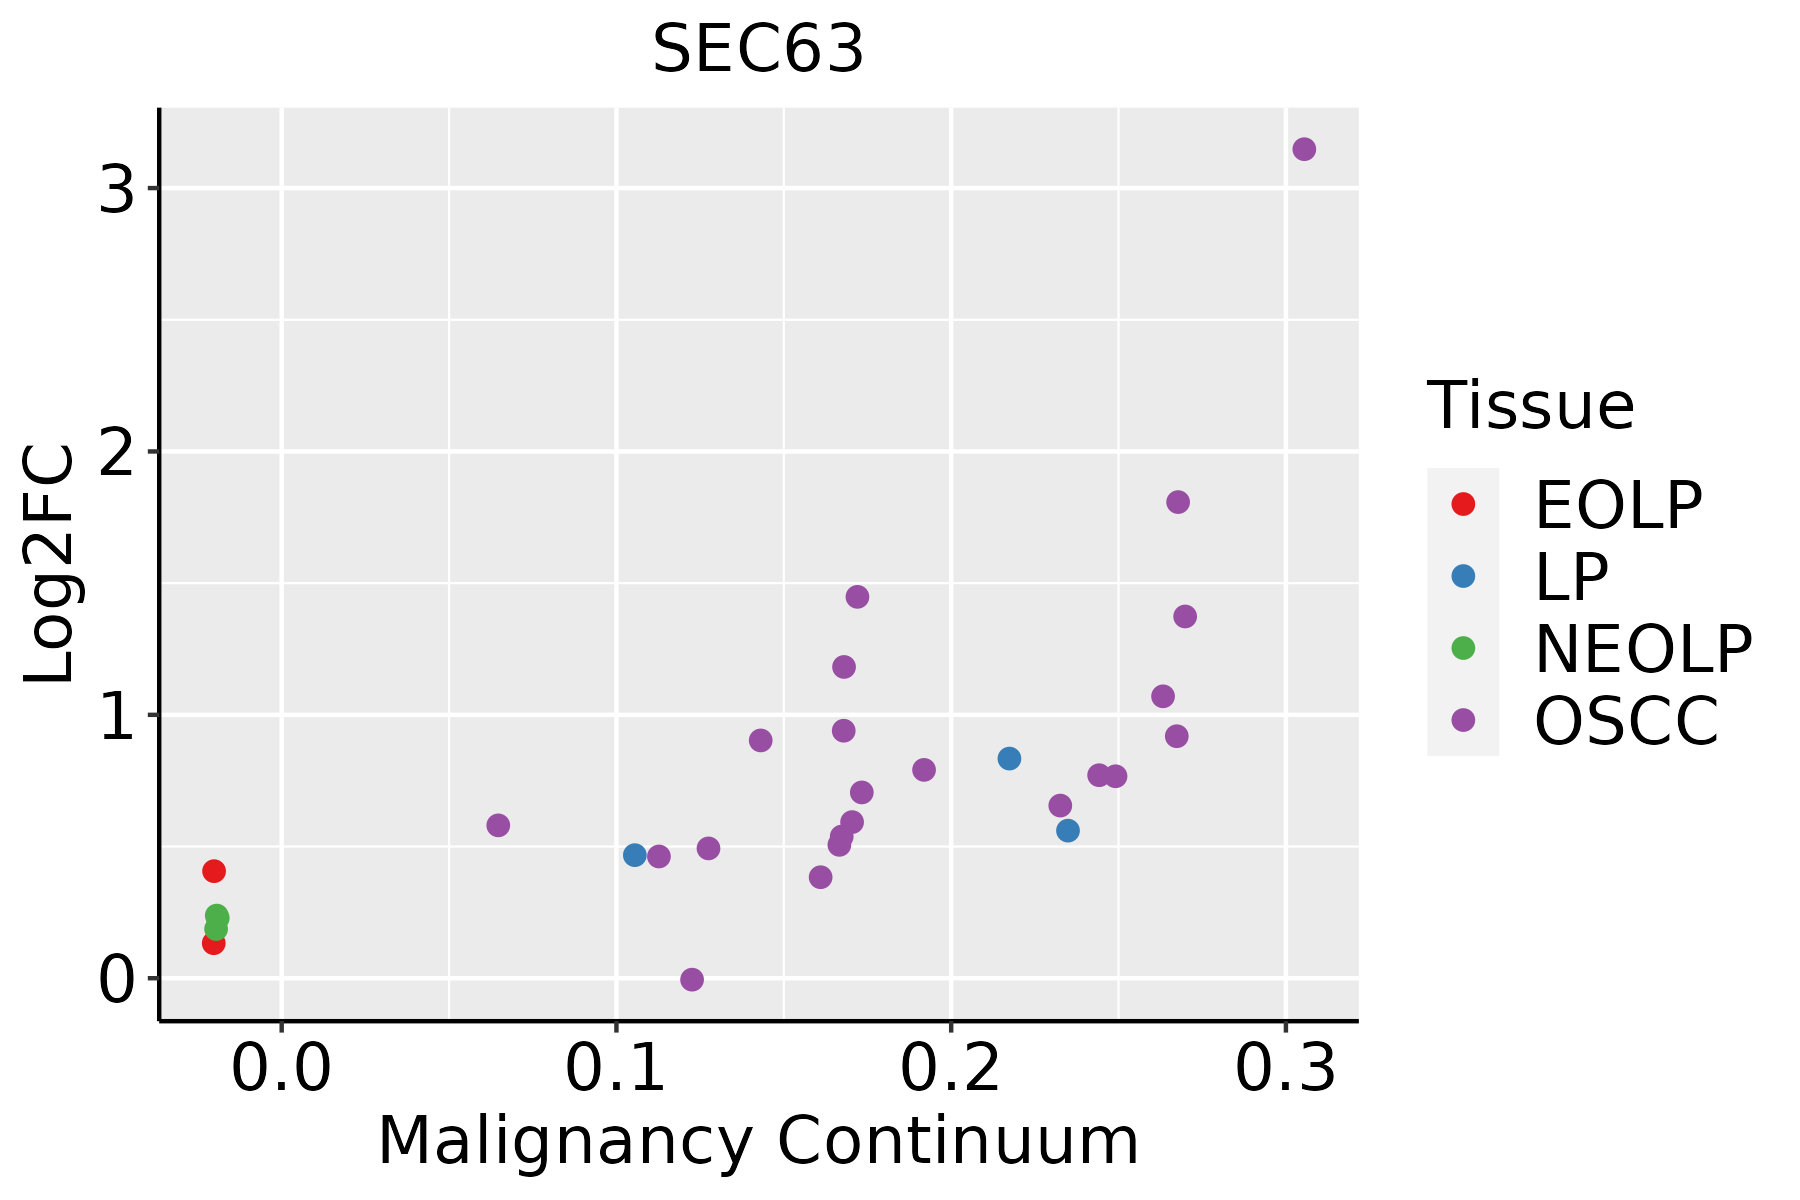 | EOLP: Erosive Oral lichen planus |
| LP: leukoplakia | ||
| NEOLP: Non-erosive oral lichen planus | ||
| OSCC: Oral squamous cell carcinoma | ||
| Prostate | 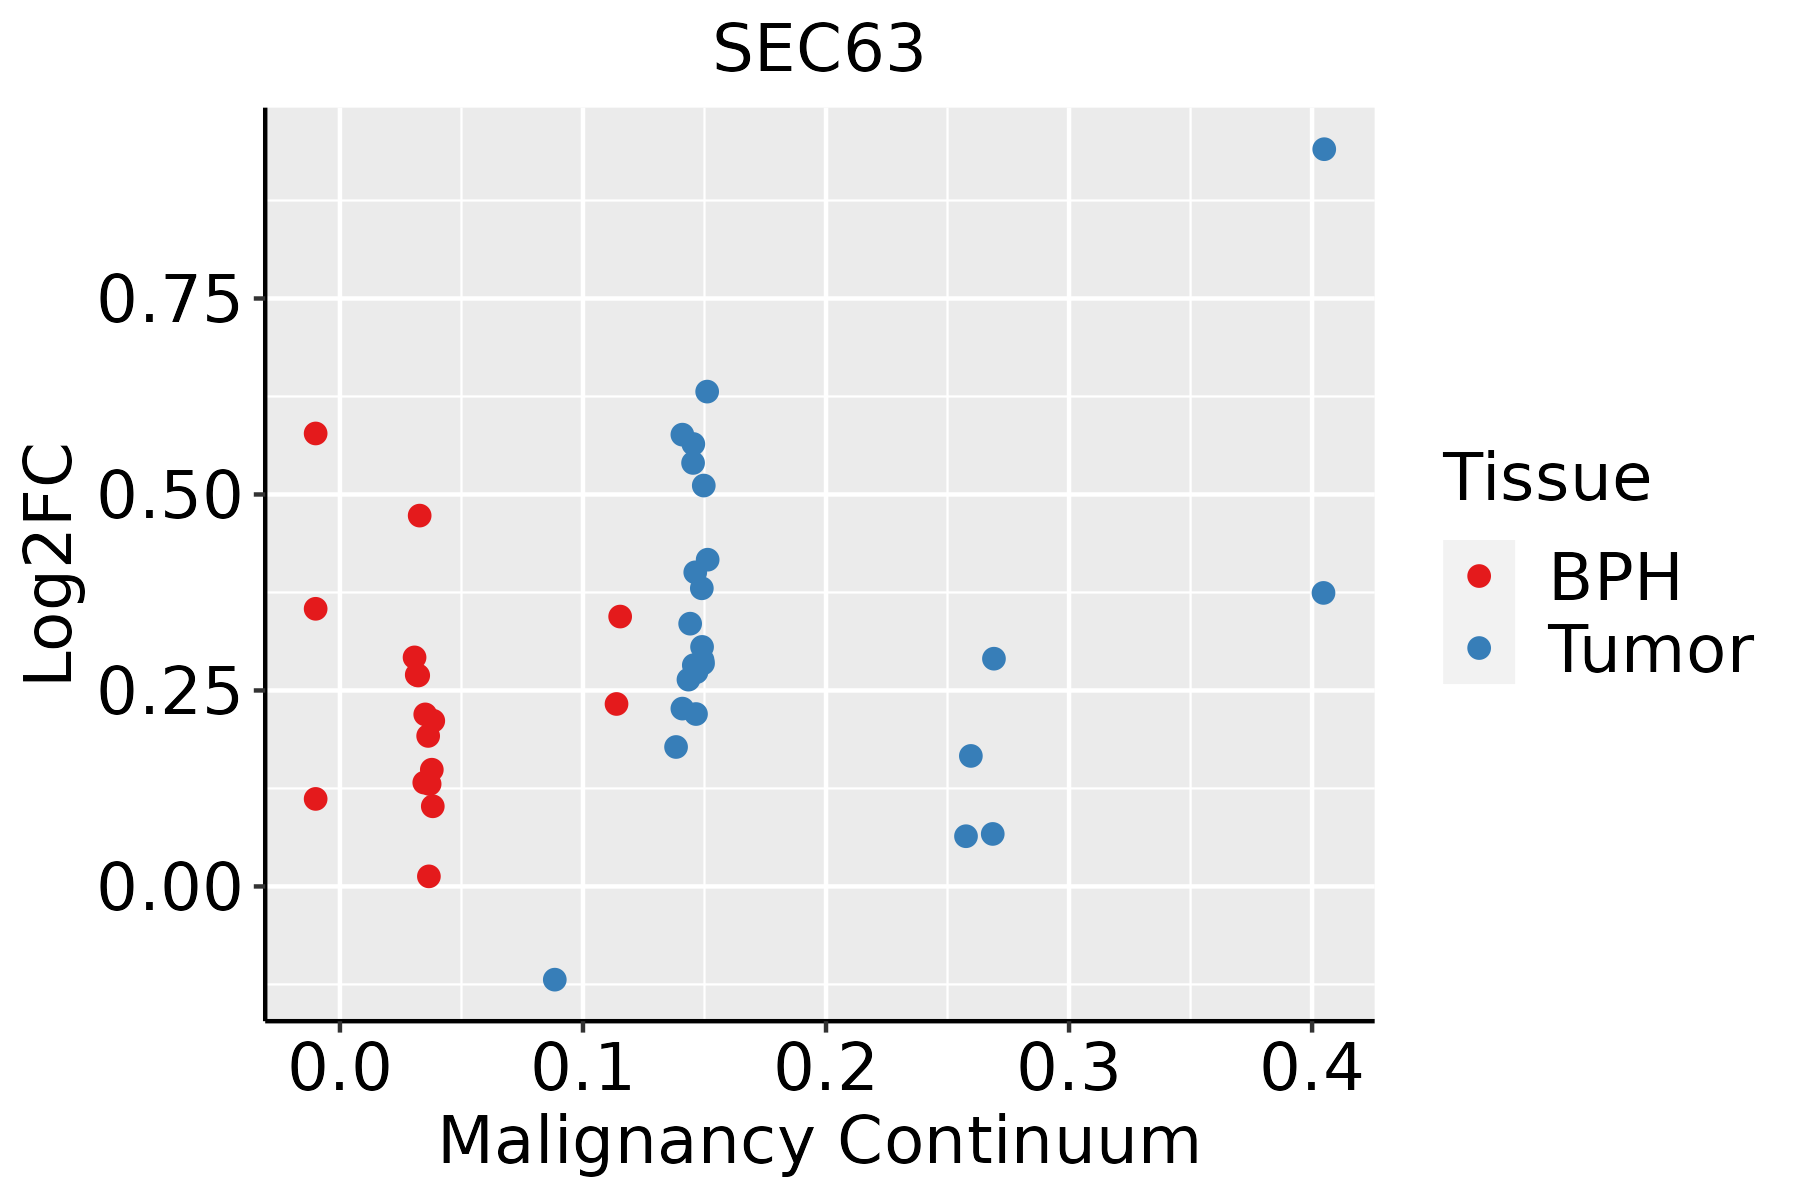 | BPH: Benign Prostatic Hyperplasia |
| Skin | 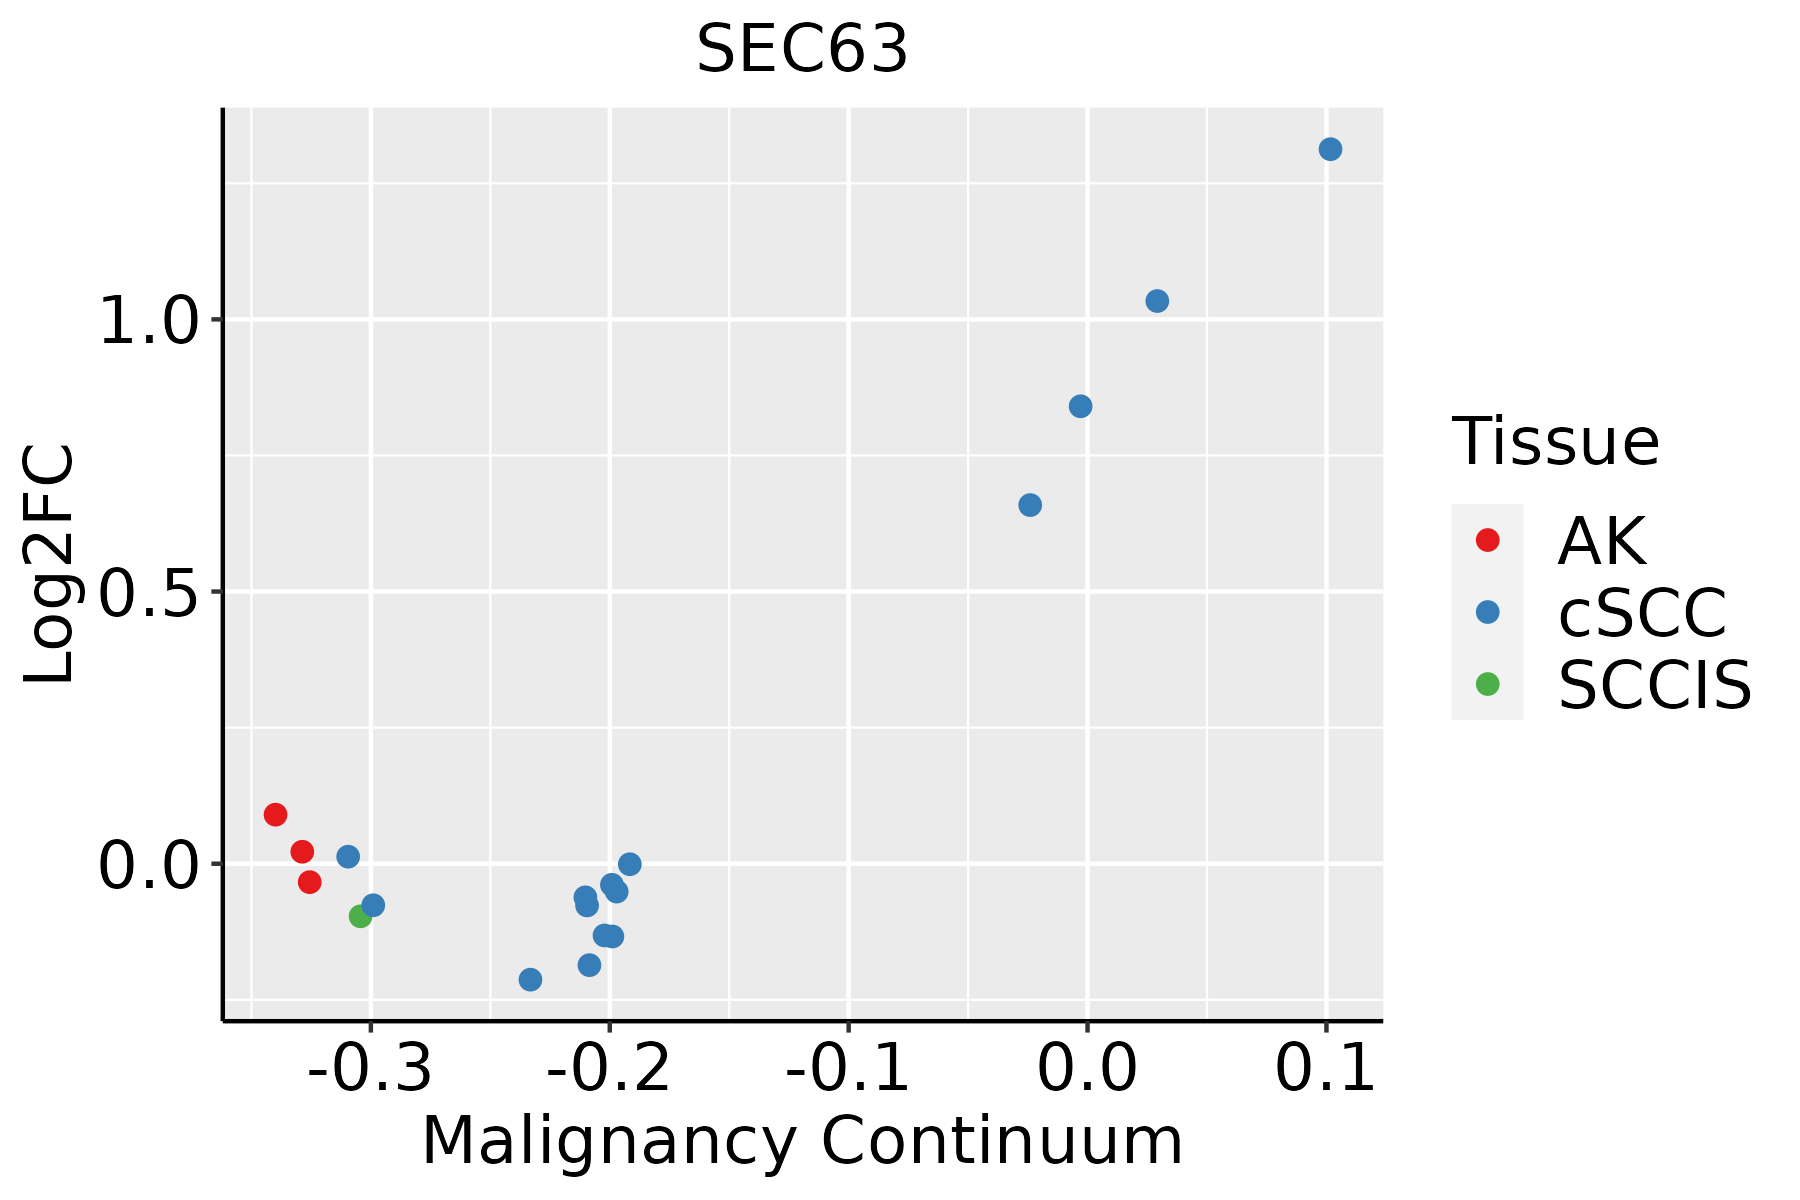 | AK: Actinic keratosis |
| cSCC: Cutaneous squamous cell carcinoma | ||
| SCCIS:squamous cell carcinoma in situ | ||
| Thyroid | 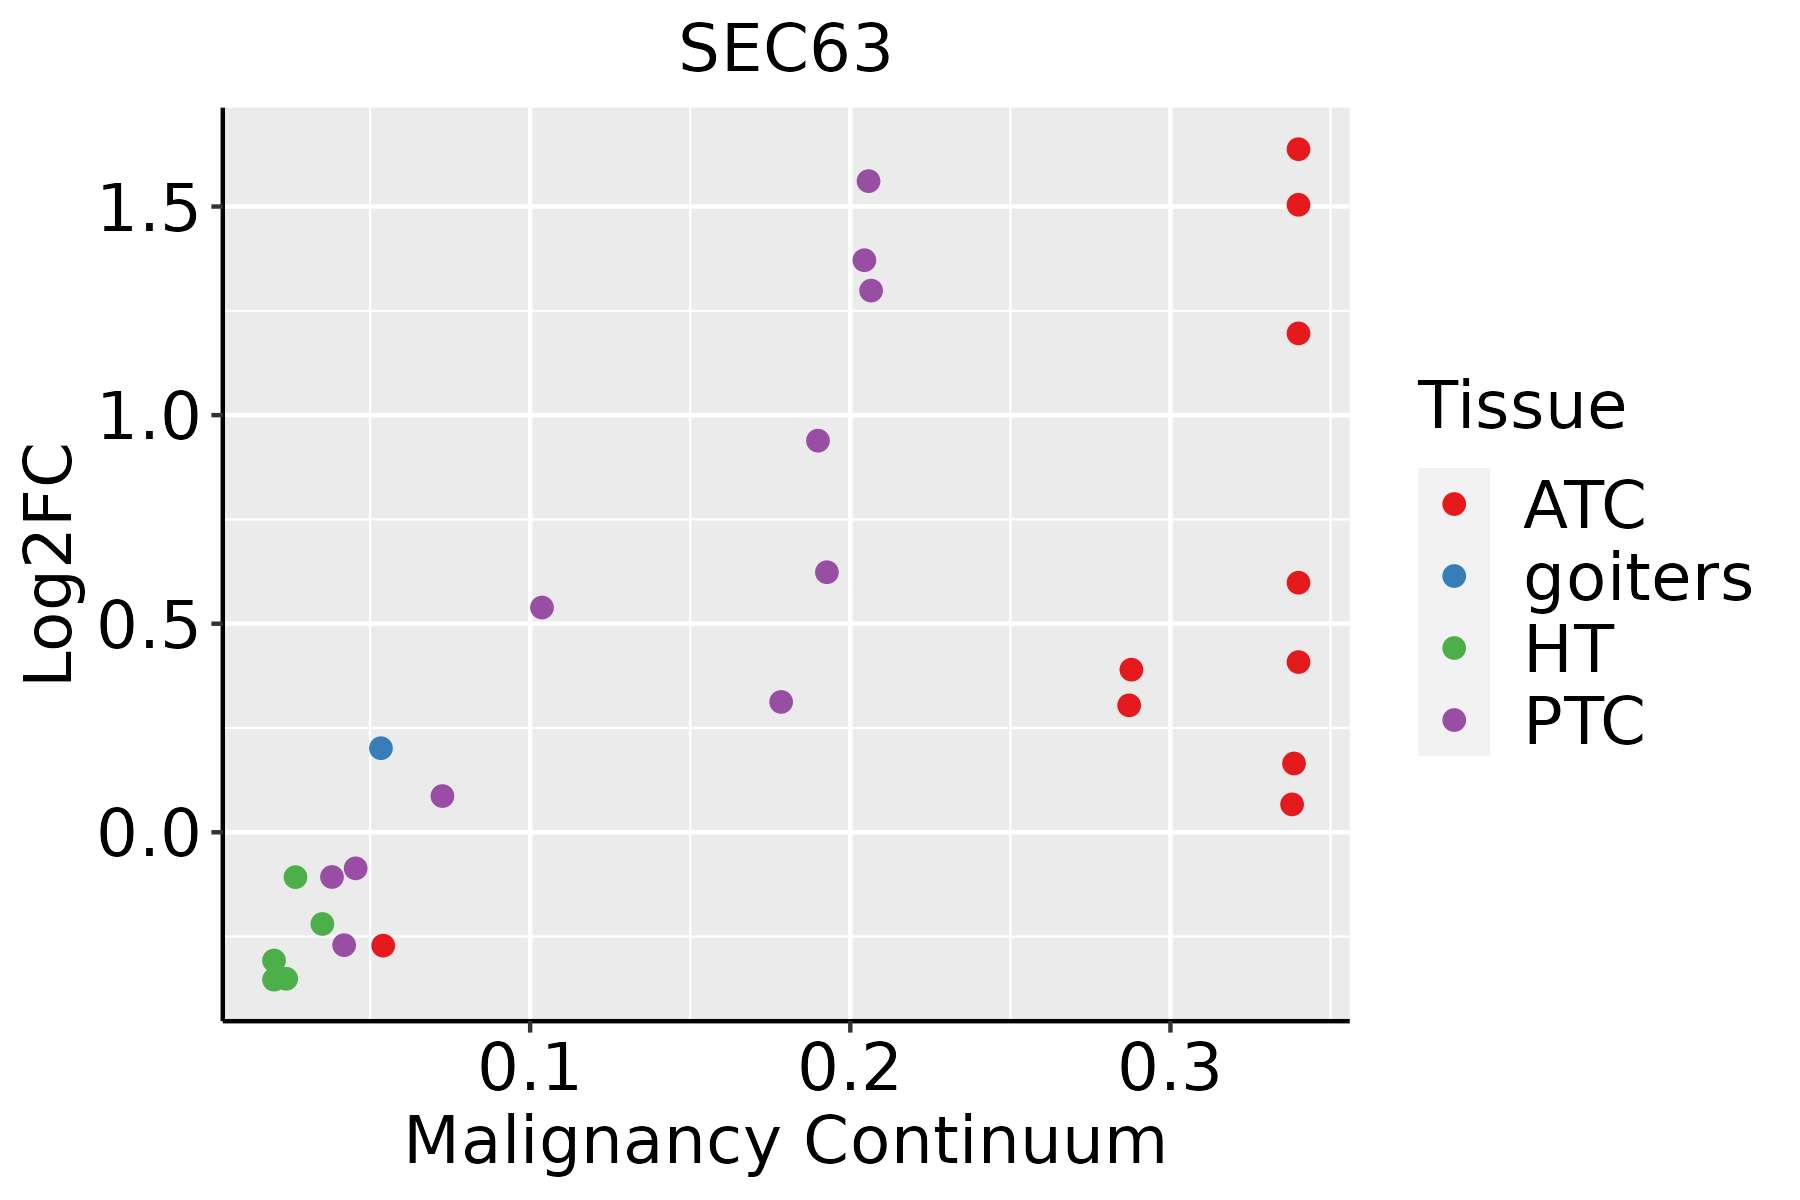 | ATC: Anaplastic thyroid cancer |
| HT: Hashimoto's thyroiditis | ||
| PTC: Papillary thyroid cancer |
| ∗log2FC in expression of this searched gene in stem-like cells from each diseased tissue sample relative to stem-like cells in normal samples in each tissue plotted against the malignancy continuum. Samples are colored based on if they are from different disease stage. |
Top |
Malignant transformation related pathway analysis |
| Find out the enriched GO biological processes and KEGG pathways involved in transition from healthy to precancer to cancer |
| Tissue | Disease Stage | Enriched GO biological Processes |
| Colorectum | AD |  |
| Colorectum | SER |  |
| Colorectum | MSS |  |
| Colorectum | MSI-H |  |
| Colorectum | FAP |  |
| ∗Top 15 enriched GO BP terms are showed in the bar plot of each disease state in each tissue. Each row represents a significant GO biological process which is colored according to the -log10(p.adjust). |
| Page: 1 2 3 4 5 6 7 8 9 |
| GO ID | Tissue | Disease Stage | Description | Gene Ratio | Bg Ratio | pvalue | p.adjust | Count |
| GO:0072594110 | Esophagus | ESCC | establishment of protein localization to organelle | 311/8552 | 422/18723 | 3.02e-32 | 2.13e-29 | 311 |
| GO:0006605111 | Esophagus | ESCC | protein targeting | 229/8552 | 314/18723 | 4.93e-23 | 1.01e-20 | 229 |
| GO:0090150110 | Esophagus | ESCC | establishment of protein localization to membrane | 182/8552 | 260/18723 | 1.27e-15 | 8.19e-14 | 182 |
| GO:0048732111 | Esophagus | ESCC | gland development | 269/8552 | 436/18723 | 7.81e-12 | 2.95e-10 | 269 |
| GO:00718069 | Esophagus | ESCC | protein transmembrane transport | 47/8552 | 59/18723 | 9.02e-08 | 1.51e-06 | 47 |
| GO:000756820 | Esophagus | ESCC | aging | 201/8552 | 339/18723 | 2.64e-07 | 3.94e-06 | 201 |
| GO:0061008110 | Esophagus | ESCC | hepaticobiliary system development | 98/8552 | 150/18723 | 8.91e-07 | 1.15e-05 | 98 |
| GO:0001889110 | Esophagus | ESCC | liver development | 96/8552 | 147/18723 | 1.18e-06 | 1.47e-05 | 96 |
| GO:00650026 | Esophagus | ESCC | intracellular protein transmembrane transport | 40/8552 | 51/18723 | 1.76e-06 | 2.08e-05 | 40 |
| GO:007097218 | Esophagus | ESCC | protein localization to endoplasmic reticulum | 52/8552 | 74/18723 | 1.58e-05 | 1.42e-04 | 52 |
| GO:00066124 | Esophagus | ESCC | protein targeting to membrane | 83/8552 | 131/18723 | 3.31e-05 | 2.73e-04 | 83 |
| GO:000662019 | Esophagus | ESCC | posttranslational protein targeting to endoplasmic reticulum membrane | 11/8552 | 12/18723 | 1.26e-03 | 6.06e-03 | 11 |
| GO:007259915 | Esophagus | ESCC | establishment of protein localization to endoplasmic reticulum | 31/8552 | 46/18723 | 2.42e-03 | 1.06e-02 | 31 |
| GO:004504715 | Esophagus | ESCC | protein targeting to ER | 28/8552 | 42/18723 | 4.90e-03 | 1.89e-02 | 28 |
| GO:007259412 | Liver | Cirrhotic | establishment of protein localization to organelle | 189/4634 | 422/18723 | 1.01e-19 | 2.45e-17 | 189 |
| GO:00066057 | Liver | Cirrhotic | protein targeting | 148/4634 | 314/18723 | 3.86e-18 | 6.20e-16 | 148 |
| GO:00901507 | Liver | Cirrhotic | establishment of protein localization to membrane | 123/4634 | 260/18723 | 1.85e-15 | 2.15e-13 | 123 |
| GO:000188912 | Liver | Cirrhotic | liver development | 81/4634 | 147/18723 | 2.99e-15 | 3.35e-13 | 81 |
| GO:006100812 | Liver | Cirrhotic | hepaticobiliary system development | 82/4634 | 150/18723 | 3.72e-15 | 4.09e-13 | 82 |
| GO:00709724 | Liver | Cirrhotic | protein localization to endoplasmic reticulum | 45/4634 | 74/18723 | 4.79e-11 | 2.73e-09 | 45 |
| Page: 1 2 3 4 5 6 7 8 9 |
| Pathway ID | Tissue | Disease Stage | Description | Gene Ratio | Bg Ratio | pvalue | p.adjust | qvalue | Count |
| hsa04141211 | Esophagus | ESCC | Protein processing in endoplasmic reticulum | 147/4205 | 174/8465 | 3.29e-22 | 1.10e-19 | 5.64e-20 | 147 |
| hsa0306026 | Esophagus | ESCC | Protein export | 22/4205 | 23/8465 | 2.43e-06 | 1.43e-05 | 7.32e-06 | 22 |
| hsa04141310 | Esophagus | ESCC | Protein processing in endoplasmic reticulum | 147/4205 | 174/8465 | 3.29e-22 | 1.10e-19 | 5.64e-20 | 147 |
| hsa0306036 | Esophagus | ESCC | Protein export | 22/4205 | 23/8465 | 2.43e-06 | 1.43e-05 | 7.32e-06 | 22 |
| hsa0414114 | Liver | Cirrhotic | Protein processing in endoplasmic reticulum | 114/2530 | 174/8465 | 1.16e-22 | 9.67e-21 | 5.96e-21 | 114 |
| hsa030608 | Liver | Cirrhotic | Protein export | 20/2530 | 23/8465 | 2.00e-08 | 3.51e-07 | 2.17e-07 | 20 |
| hsa0414115 | Liver | Cirrhotic | Protein processing in endoplasmic reticulum | 114/2530 | 174/8465 | 1.16e-22 | 9.67e-21 | 5.96e-21 | 114 |
| hsa0306011 | Liver | Cirrhotic | Protein export | 20/2530 | 23/8465 | 2.00e-08 | 3.51e-07 | 2.17e-07 | 20 |
| hsa0414122 | Liver | HCC | Protein processing in endoplasmic reticulum | 146/4020 | 174/8465 | 7.34e-24 | 2.46e-21 | 1.37e-21 | 146 |
| hsa0306021 | Liver | HCC | Protein export | 21/4020 | 23/8465 | 1.20e-05 | 8.53e-05 | 4.74e-05 | 21 |
| hsa0414132 | Liver | HCC | Protein processing in endoplasmic reticulum | 146/4020 | 174/8465 | 7.34e-24 | 2.46e-21 | 1.37e-21 | 146 |
| hsa0306031 | Liver | HCC | Protein export | 21/4020 | 23/8465 | 1.20e-05 | 8.53e-05 | 4.74e-05 | 21 |
| hsa0414130 | Oral cavity | OSCC | Protein processing in endoplasmic reticulum | 143/3704 | 174/8465 | 6.82e-26 | 2.28e-23 | 1.16e-23 | 143 |
| hsa0306018 | Oral cavity | OSCC | Protein export | 21/3704 | 23/8465 | 2.42e-06 | 1.27e-05 | 6.45e-06 | 21 |
| hsa04141113 | Oral cavity | OSCC | Protein processing in endoplasmic reticulum | 143/3704 | 174/8465 | 6.82e-26 | 2.28e-23 | 1.16e-23 | 143 |
| hsa0306019 | Oral cavity | OSCC | Protein export | 21/3704 | 23/8465 | 2.42e-06 | 1.27e-05 | 6.45e-06 | 21 |
| hsa04141210 | Oral cavity | LP | Protein processing in endoplasmic reticulum | 113/2418 | 174/8465 | 8.74e-24 | 5.82e-22 | 3.76e-22 | 113 |
| hsa0306025 | Oral cavity | LP | Protein export | 21/2418 | 23/8465 | 4.72e-10 | 8.28e-09 | 5.34e-09 | 21 |
| hsa0414138 | Oral cavity | LP | Protein processing in endoplasmic reticulum | 113/2418 | 174/8465 | 8.74e-24 | 5.82e-22 | 3.76e-22 | 113 |
| hsa0306035 | Oral cavity | LP | Protein export | 21/2418 | 23/8465 | 4.72e-10 | 8.28e-09 | 5.34e-09 | 21 |
| Page: 1 2 |
Top |
Cell-cell communication analysis |
| Identification of potential cell-cell interactions between two cell types and their ligand-receptor pairs for different disease states |
| Ligand | Receptor | LRpair | Pathway | Tissue | Disease Stage |
| Page: 1 |
Top |
Single-cell gene regulatory network inference analysis |
| Find out the significant the regulons (TFs) and the target genes of each regulon across cell types for different disease states |
| TF | Cell Type | Tissue | Disease Stage | Target Gene | RSS | Regulon Activity |
| ∗The dot plots of a searched regulon are shown for all cell subpopulations in each disease state of each tissue based on the regulon specific score inferred using pySCENIC and by calculating the average expression. |
| Page: 1 |
Top |
Somatic mutation of malignant transformation related genes |
| Annotation of somatic variants for genes involved in malignant transformation |
| Hugo Symbol | Variant Class | Variant Classification | dbSNP RS | HGVSc | HGVSp | HGVSp Short | SWISSPROT | BIOTYPE | SIFT | PolyPhen | Tumor Sample Barcode | Tissue | Histology | Sex | Age | Stage | Therapy Types | Drugs | Outcome |
| SEC63 | SNV | Missense_Mutation | novel | c.94N>C | p.Tyr32His | p.Y32H | Q9UGP8 | protein_coding | deleterious(0) | probably_damaging(0.94) | TCGA-A2-A3XT-01 | Breast | breast invasive carcinoma | Female | <65 | I/II | Chemotherapy | cyclophosphamide | PR |
| SEC63 | SNV | Missense_Mutation | c.2029G>A | p.Glu677Lys | p.E677K | Q9UGP8 | protein_coding | deleterious(0.01) | possibly_damaging(0.571) | TCGA-AC-A23H-01 | Breast | breast invasive carcinoma | Female | >=65 | I/II | Unknown | Unknown | PD | |
| SEC63 | SNV | Missense_Mutation | rs754641338 | c.185G>A | p.Arg62Gln | p.R62Q | Q9UGP8 | protein_coding | tolerated(0.61) | benign(0.009) | TCGA-AN-A0FL-01 | Breast | breast invasive carcinoma | Female | <65 | I/II | Unknown | Unknown | SD |
| SEC63 | SNV | Missense_Mutation | c.1363G>C | p.Asp455His | p.D455H | Q9UGP8 | protein_coding | deleterious(0) | probably_damaging(0.999) | TCGA-AO-A1KS-01 | Breast | breast invasive carcinoma | Female | >=65 | I/II | Hormone Therapy | arimidex | SD | |
| SEC63 | deletion | Frame_Shift_Del | novel | c.163delN | p.Arg55GlyfsTer10 | p.R55Gfs*10 | Q9UGP8 | protein_coding | TCGA-EW-A2FV-01 | Breast | breast invasive carcinoma | Female | <65 | III/IV | Chemotherapy | docetaxel | SD | ||
| SEC63 | SNV | Missense_Mutation | novel | c.716G>A | p.Arg239Gln | p.R239Q | Q9UGP8 | protein_coding | tolerated(0.08) | benign(0.051) | TCGA-2W-A8YY-01 | Cervix | cervical & endocervical cancer | Female | <65 | I/II | Chemotherapy | cisplatin | CR |
| SEC63 | SNV | Missense_Mutation | c.1732N>C | p.Glu578Gln | p.E578Q | Q9UGP8 | protein_coding | tolerated(0.16) | benign(0.023) | TCGA-EK-A2RJ-01 | Cervix | cervical & endocervical cancer | Female | <65 | I/II | Unknown | Unknown | SD | |
| SEC63 | SNV | Missense_Mutation | c.1887N>C | p.Glu629Asp | p.E629D | Q9UGP8 | protein_coding | deleterious(0.01) | probably_damaging(0.934) | TCGA-FU-A3HZ-01 | Cervix | cervical & endocervical cancer | Female | <65 | I/II | Chemotherapy | cisplatin | CR | |
| SEC63 | SNV | Missense_Mutation | novel | c.1585N>G | p.Lys529Glu | p.K529E | Q9UGP8 | protein_coding | tolerated(0.15) | possibly_damaging(0.783) | TCGA-A6-2686-01 | Colorectum | colon adenocarcinoma | Female | >=65 | I/II | Unknown | Unknown | SD |
| SEC63 | SNV | Missense_Mutation | novel | c.716N>A | p.Arg239Gln | p.R239Q | Q9UGP8 | protein_coding | tolerated(0.08) | benign(0.051) | TCGA-AA-3510-01 | Colorectum | colon adenocarcinoma | Male | >=65 | I/II | Unknown | Unknown | SD |
| Page: 1 2 3 4 5 6 7 |
Top |
Related drugs of malignant transformation related genes |
| Identification of chemicals and drugs interact with genes involved in malignant transfromation |
| (DGIdb 4.0) |
| Entrez ID | Symbol | Category | Interaction Types | Drug Claim Name | Drug Name | PMIDs |
| Page: 1 |

Copyright 2023-Present -The University of Texas Health Science Center at Houston |