| Tissue | Expression Dynamics | Abbreviation |
| Breast | 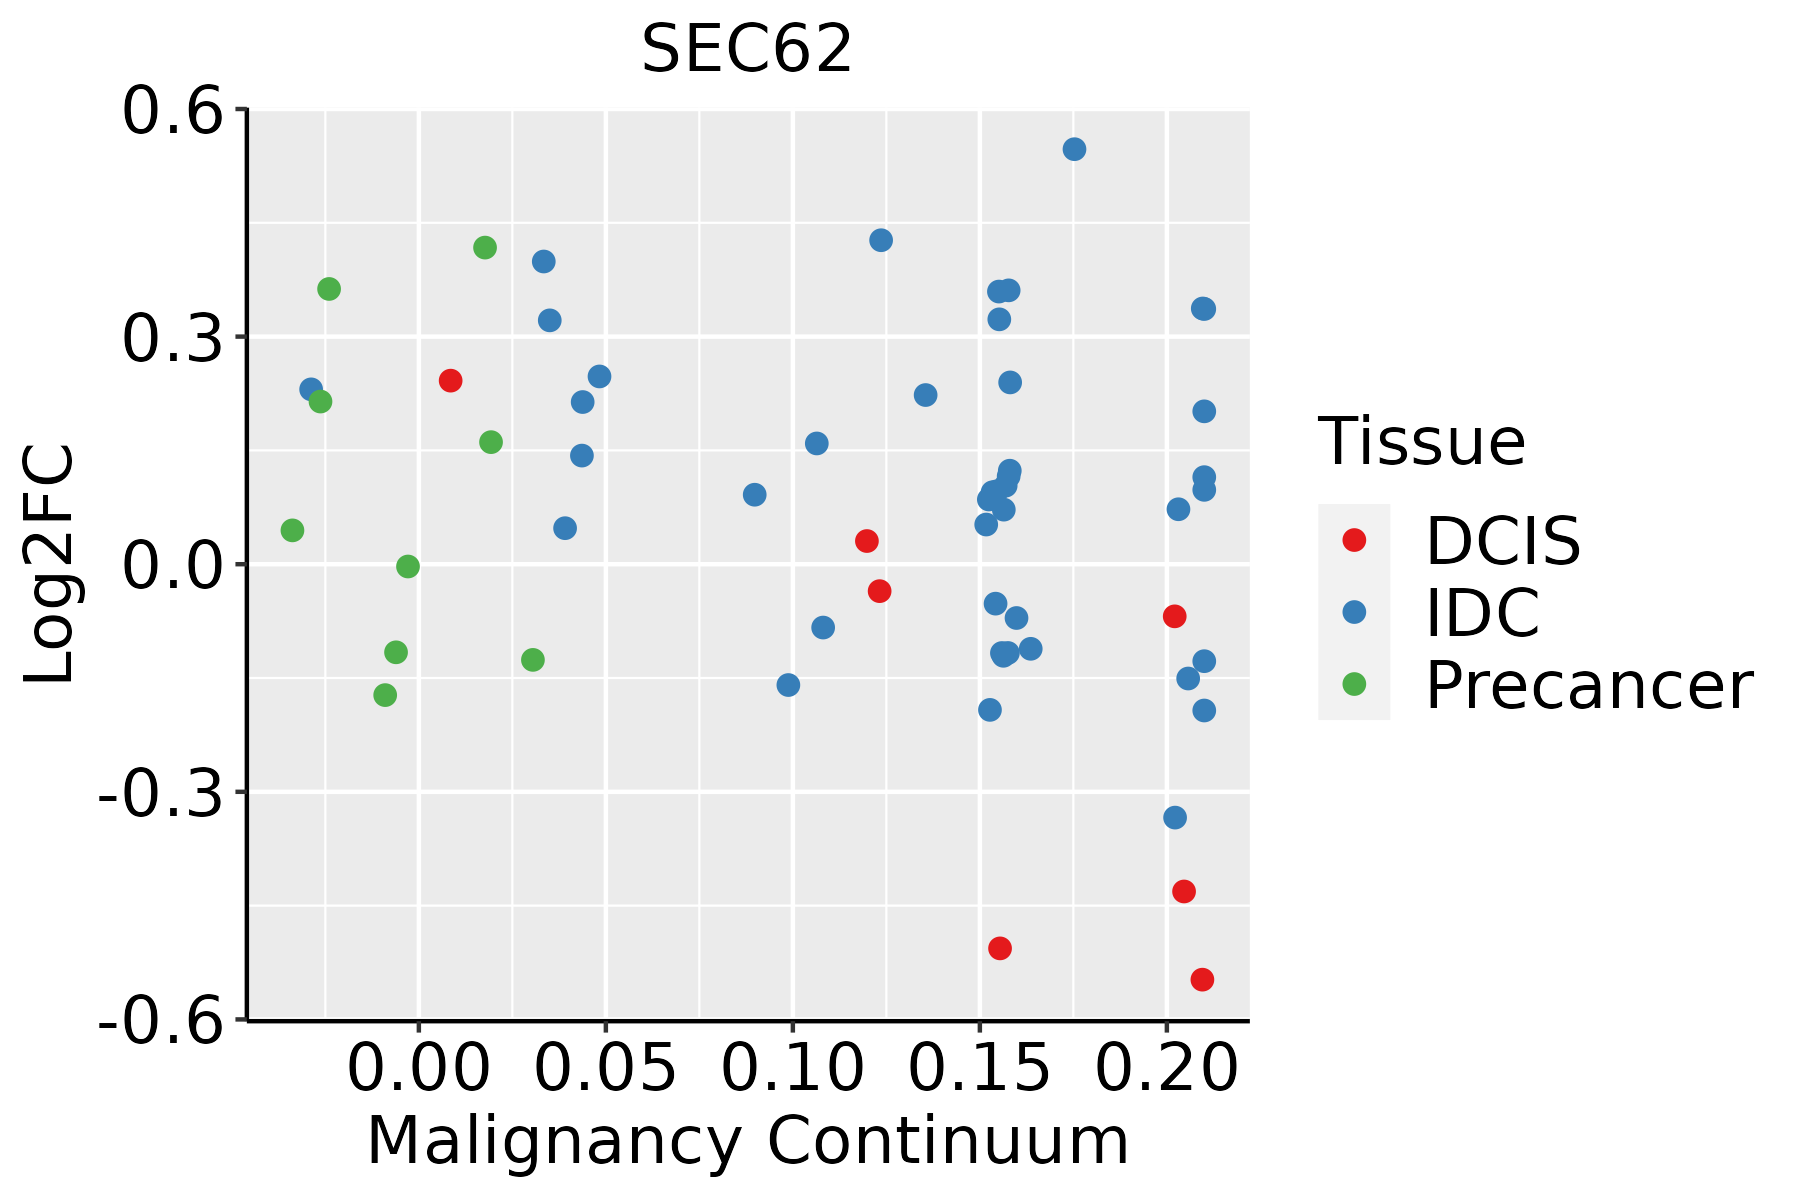 | IDC: Invasive ductal carcinoma |
| DCIS: Ductal carcinoma in situ |
| Precancer(BRCA1-mut): Precancerous lesion from BRCA1 mutation carriers |
| Colorectum (GSE201348) |  | FAP: Familial adenomatous polyposis |
| CRC: Colorectal cancer |
| Colorectum (HTA11) |  | AD: Adenomas |
| SER: Sessile serrated lesions |
| MSI-H: Microsatellite-high colorectal cancer |
| MSS: Microsatellite stable colorectal cancer |
| Endometrium |  | AEH: Atypical endometrial hyperplasia |
| EEC: Endometrioid Cancer |
| Esophagus | 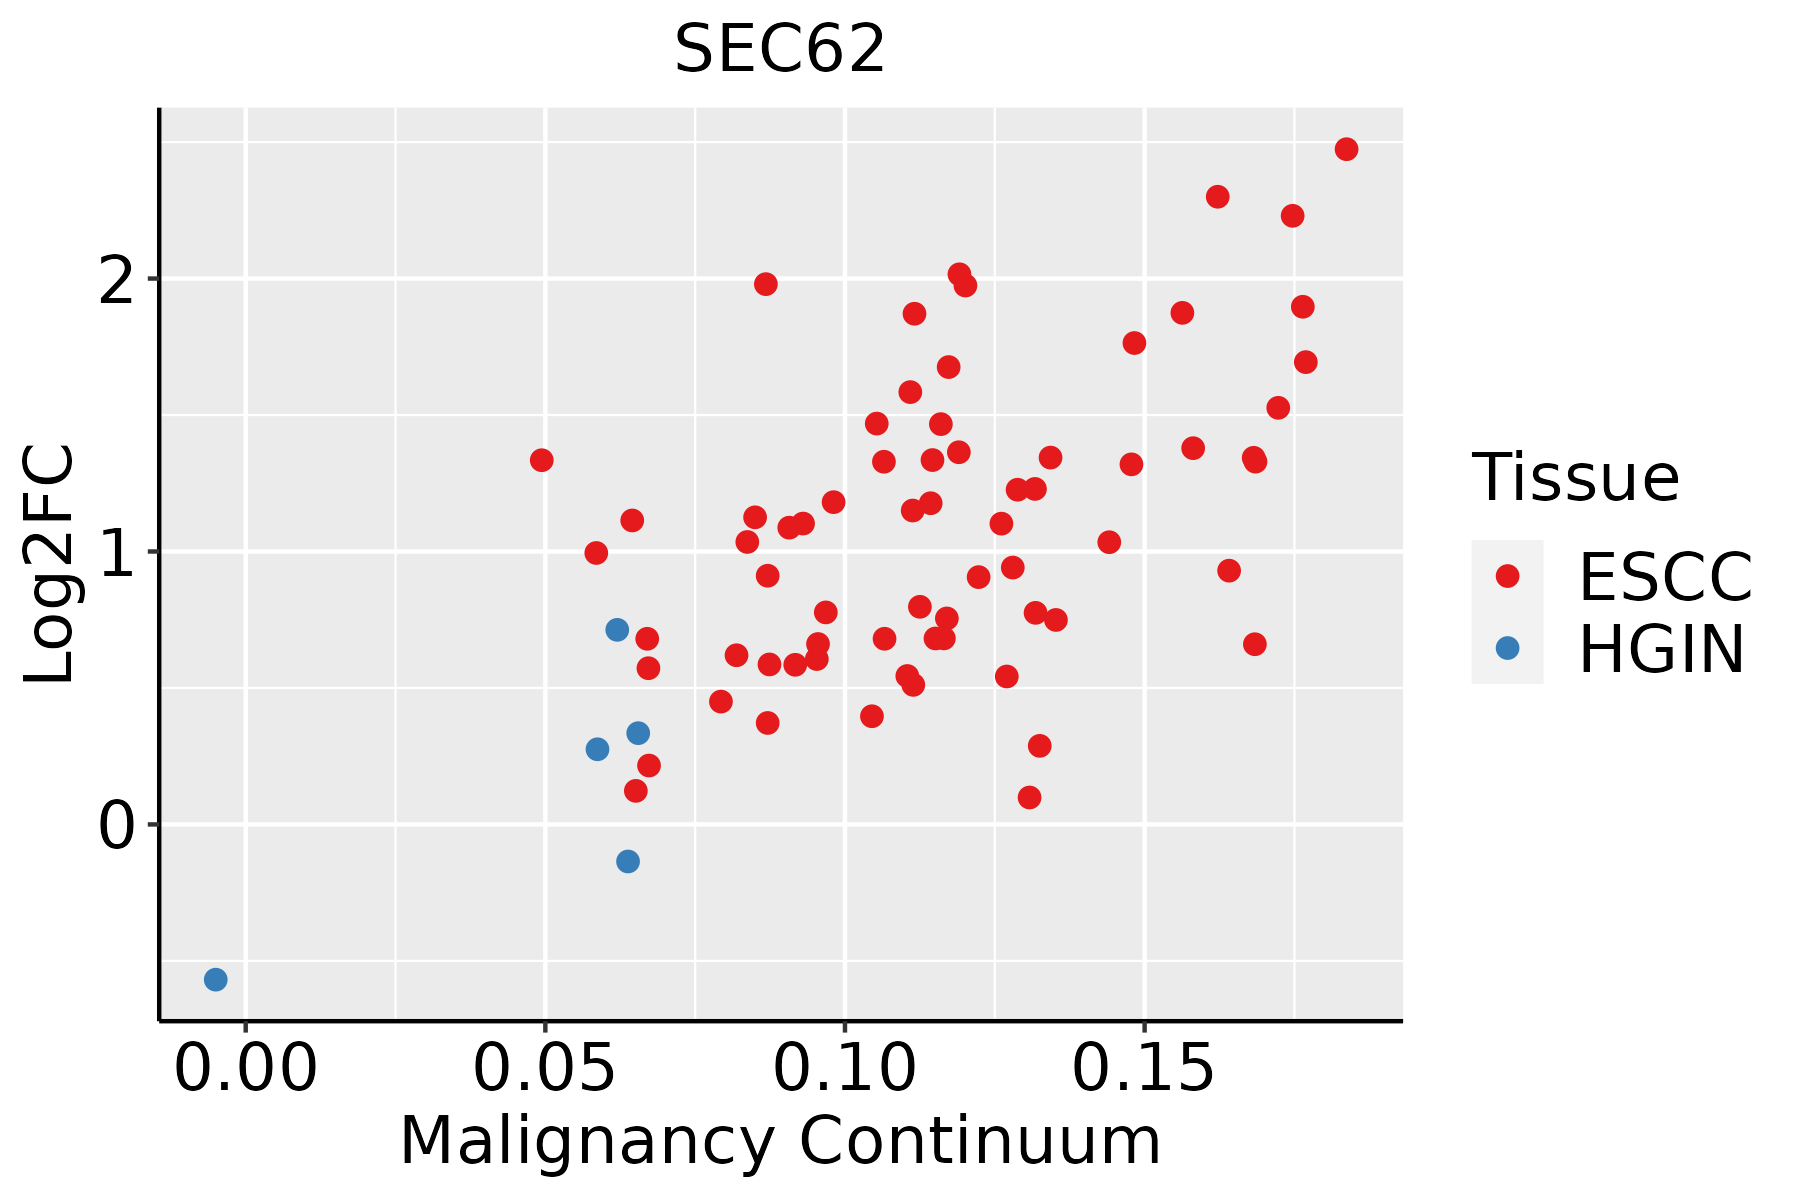 | ESCC: Esophageal squamous cell carcinoma |
| HGIN: High-grade intraepithelial neoplasias |
| LGIN: Low-grade intraepithelial neoplasias |
| Liver |  | HCC: Hepatocellular carcinoma |
| NAFLD: Non-alcoholic fatty liver disease |
| Lung | 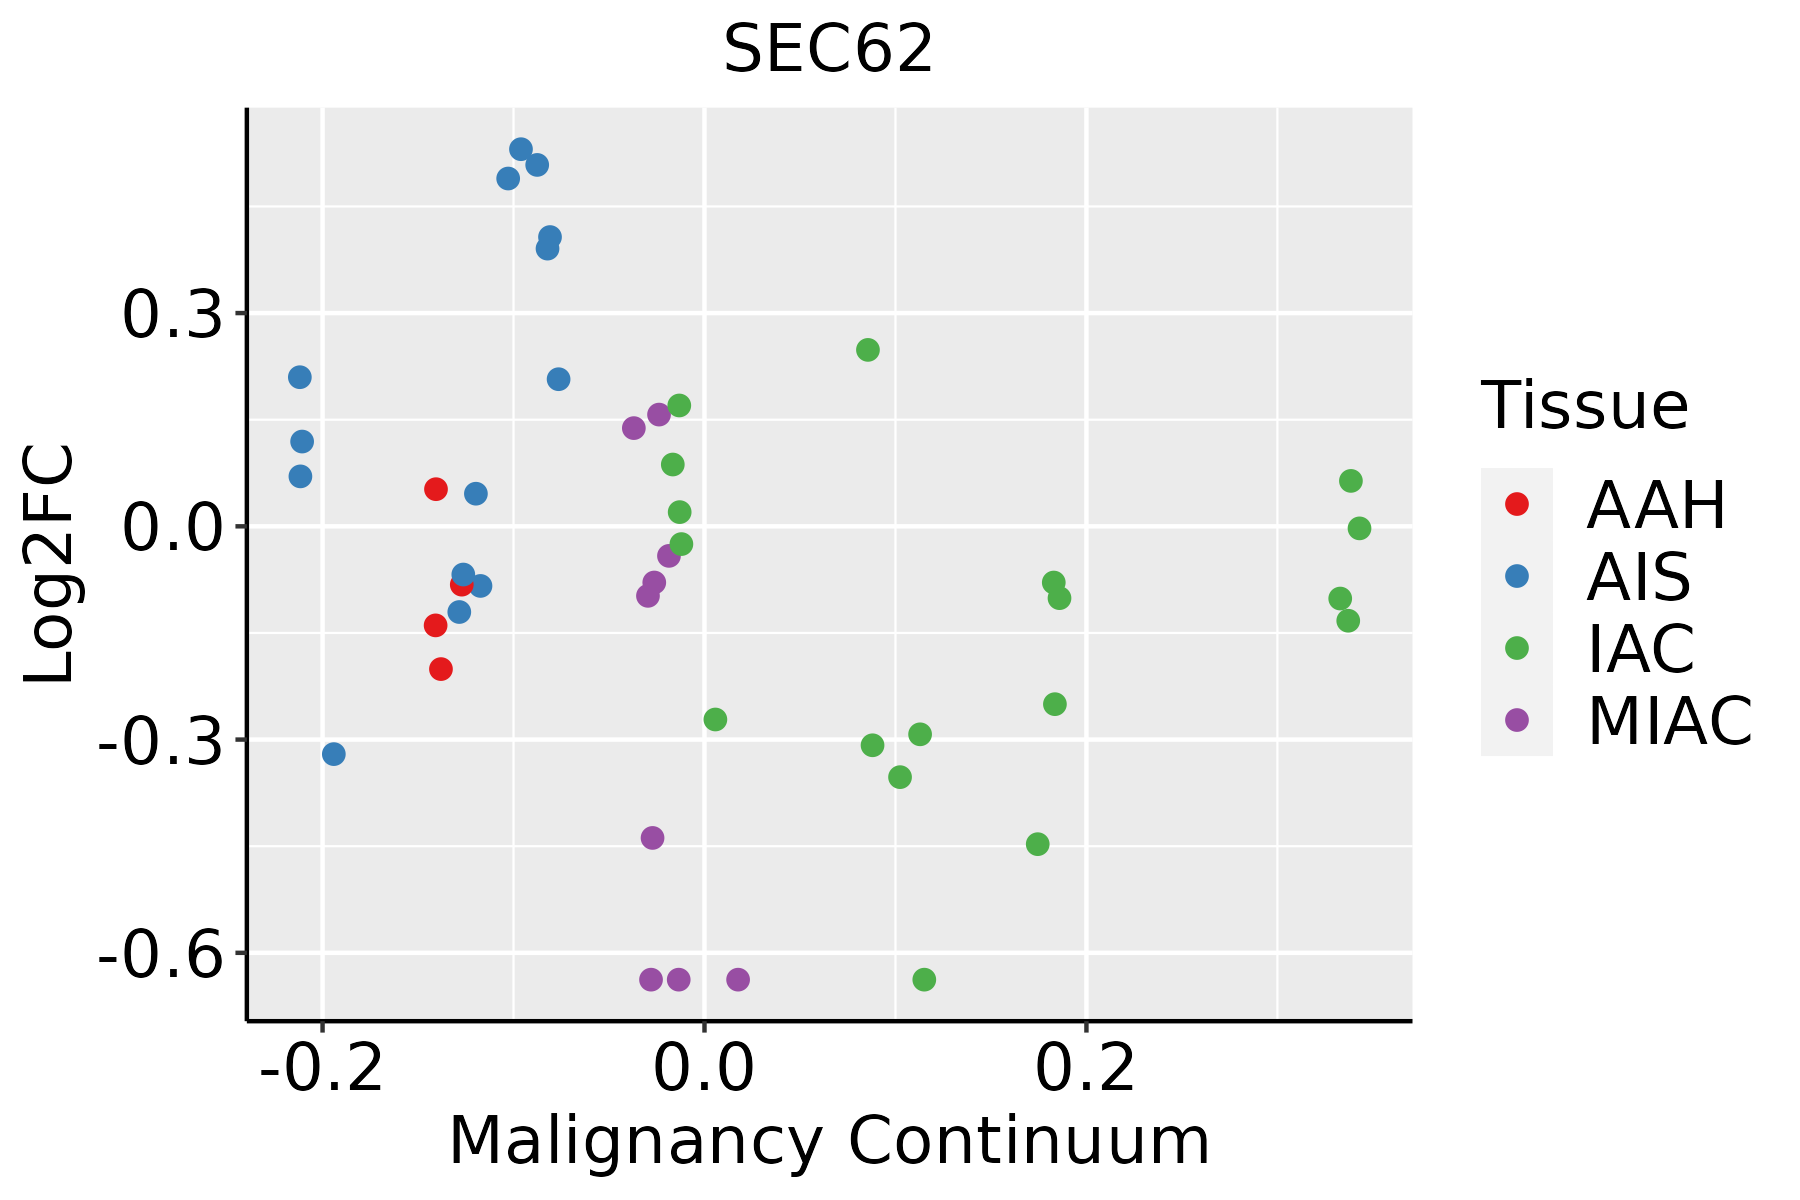 | AAH: Atypical adenomatous hyperplasia |
| AIS: Adenocarcinoma in situ |
| IAC: Invasive lung adenocarcinoma |
| MIA: Minimally invasive adenocarcinoma |
| Oral Cavity | 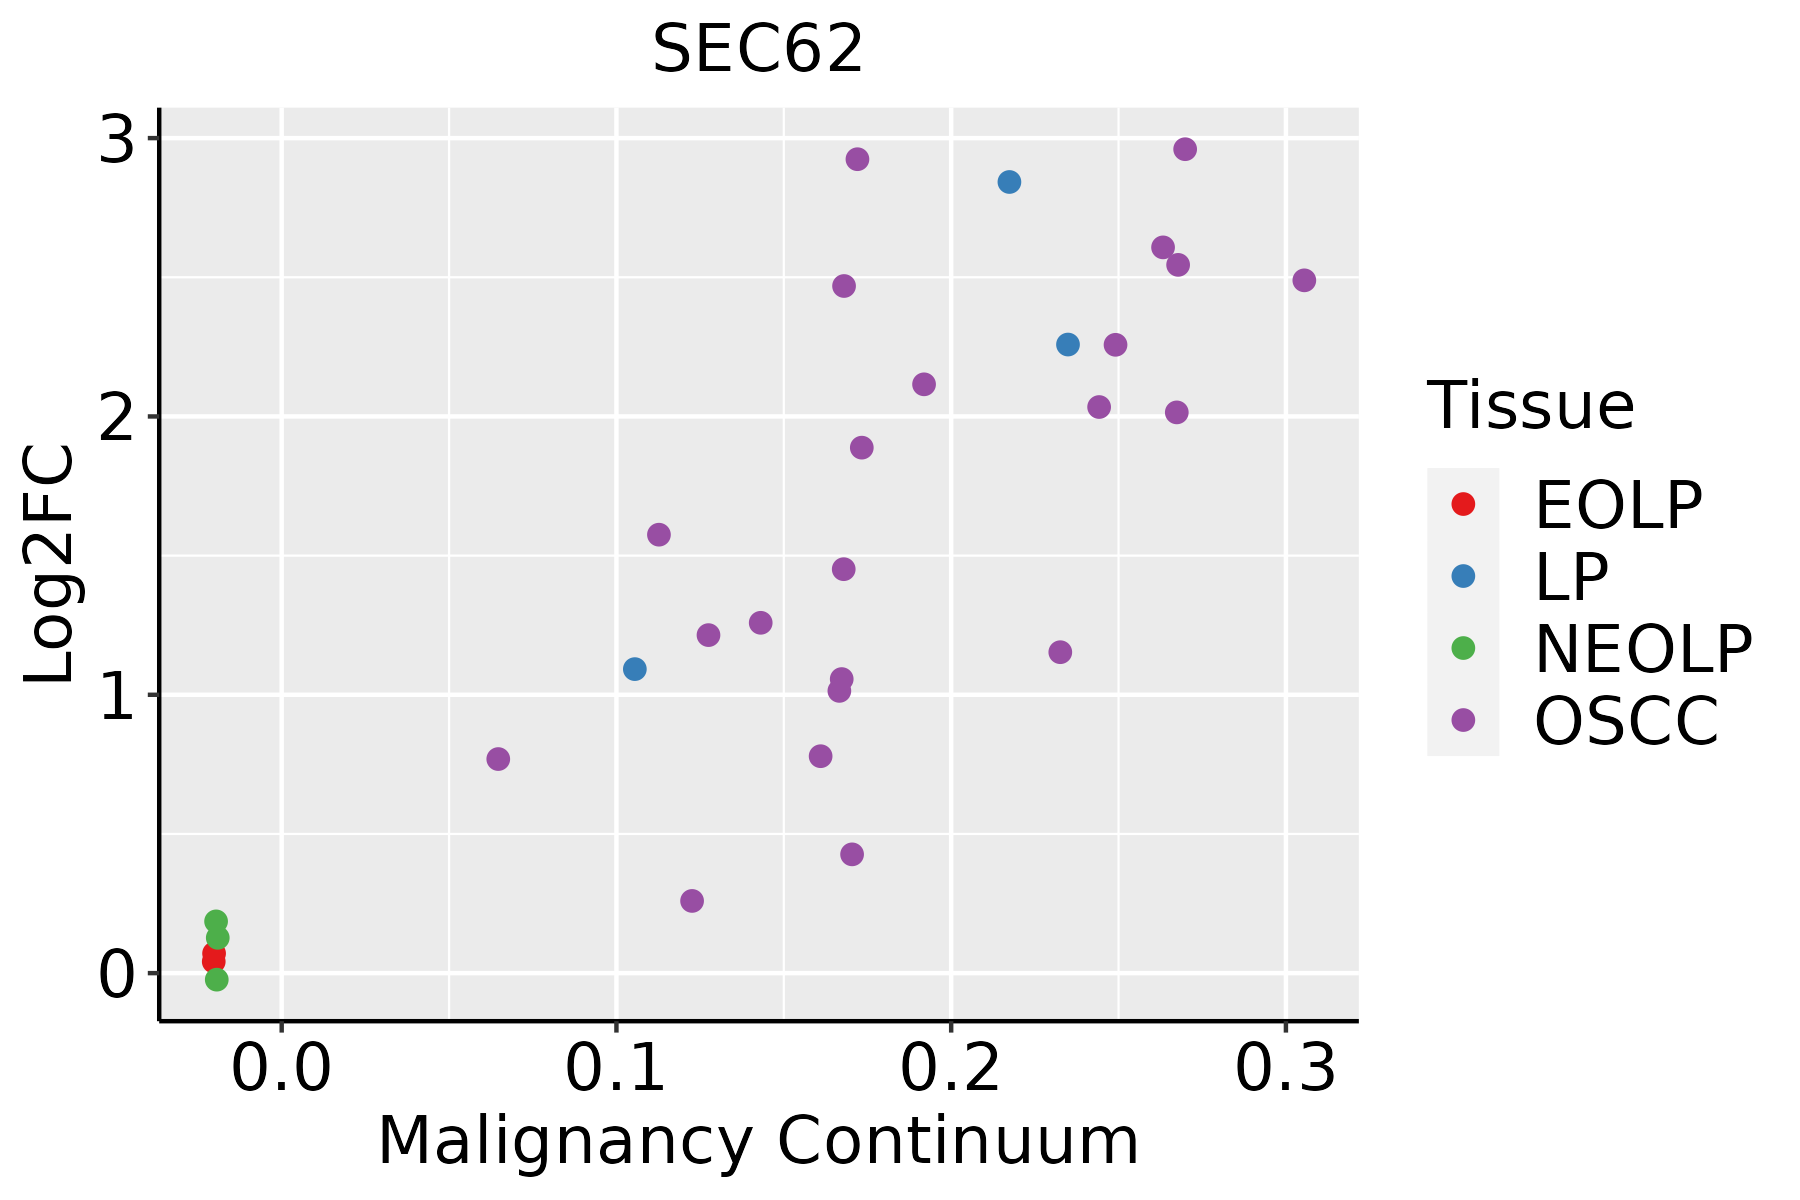 | EOLP: Erosive Oral lichen planus |
| LP: leukoplakia |
| NEOLP: Non-erosive oral lichen planus |
| OSCC: Oral squamous cell carcinoma |
| Prostate | 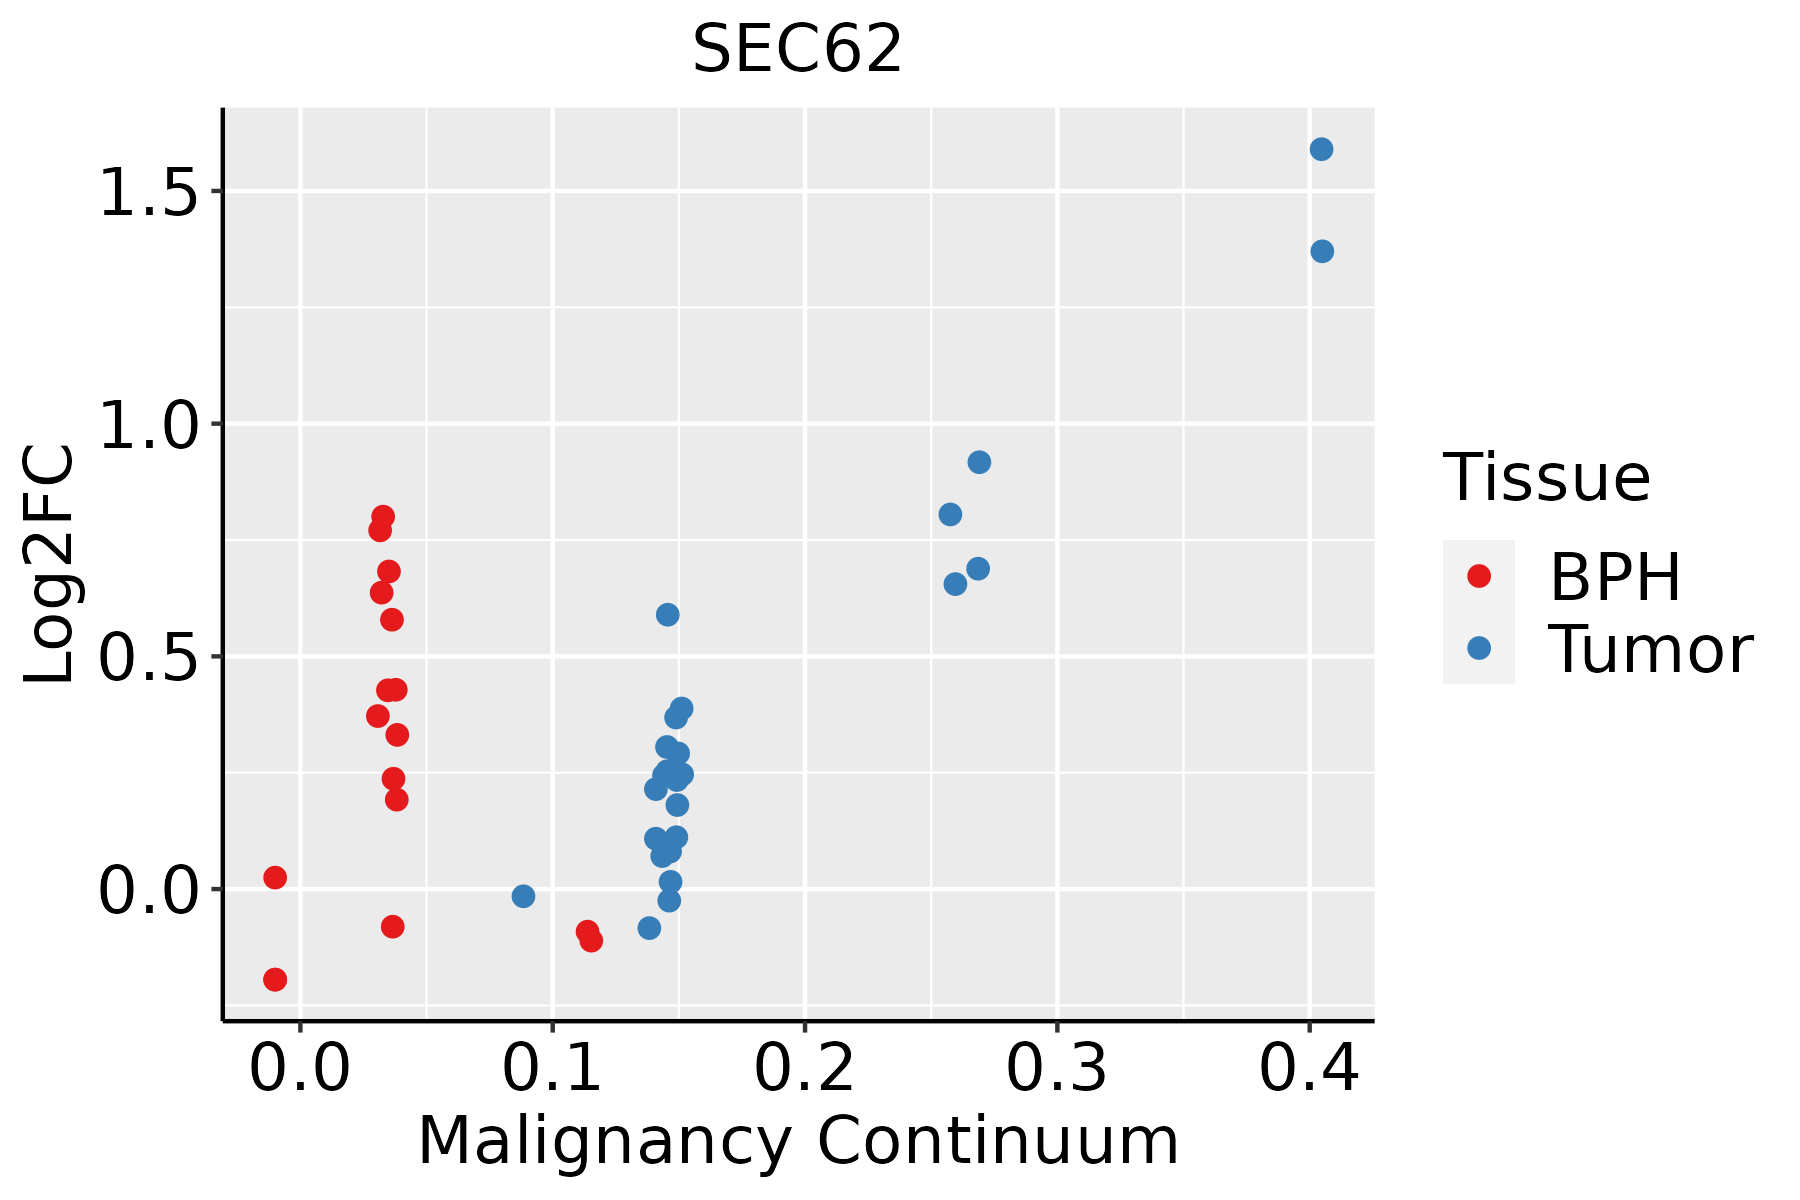 | BPH: Benign Prostatic Hyperplasia |
| Skin |  | AK: Actinic keratosis |
| cSCC: Cutaneous squamous cell carcinoma |
| SCCIS:squamous cell carcinoma in situ |
| Thyroid |  | ATC: Anaplastic thyroid cancer |
| HT: Hashimoto's thyroiditis |
| PTC: Papillary thyroid cancer |
| GO ID | Tissue | Disease Stage | Description | Gene Ratio | Bg Ratio | pvalue | p.adjust | Count |
| GO:00709725 | Breast | Precancer | protein localization to endoplasmic reticulum | 15/1080 | 74/18723 | 1.74e-05 | 4.17e-04 | 15 |
| GO:00066059 | Breast | Precancer | protein targeting | 33/1080 | 314/18723 | 6.50e-04 | 7.99e-03 | 33 |
| GO:00725948 | Breast | Precancer | establishment of protein localization to organelle | 41/1080 | 422/18723 | 7.75e-04 | 9.20e-03 | 41 |
| GO:00718064 | Breast | Precancer | protein transmembrane transport | 10/1080 | 59/18723 | 1.86e-03 | 1.81e-02 | 10 |
| GO:00066208 | Breast | Precancer | posttranslational protein targeting to endoplasmic reticulum membrane | 4/1080 | 12/18723 | 3.75e-03 | 3.04e-02 | 4 |
| GO:007097213 | Breast | IDC | protein localization to endoplasmic reticulum | 18/1434 | 74/18723 | 8.58e-06 | 2.47e-04 | 18 |
| GO:000660514 | Breast | IDC | protein targeting | 43/1434 | 314/18723 | 1.44e-04 | 2.53e-03 | 43 |
| GO:007259413 | Breast | IDC | establishment of protein localization to organelle | 51/1434 | 422/18723 | 7.94e-04 | 9.55e-03 | 51 |
| GO:007180612 | Breast | IDC | protein transmembrane transport | 12/1434 | 59/18723 | 1.49e-03 | 1.50e-02 | 12 |
| GO:007097222 | Breast | DCIS | protein localization to endoplasmic reticulum | 18/1390 | 74/18723 | 5.57e-06 | 1.60e-04 | 18 |
| GO:000660523 | Breast | DCIS | protein targeting | 43/1390 | 314/18723 | 7.17e-05 | 1.41e-03 | 43 |
| GO:007259423 | Breast | DCIS | establishment of protein localization to organelle | 51/1390 | 422/18723 | 3.91e-04 | 5.40e-03 | 51 |
| GO:007180621 | Breast | DCIS | protein transmembrane transport | 12/1390 | 59/18723 | 1.14e-03 | 1.22e-02 | 12 |
| GO:0072594 | Colorectum | AD | establishment of protein localization to organelle | 148/3918 | 422/18723 | 7.95e-12 | 1.04e-09 | 148 |
| GO:0090150 | Colorectum | AD | establishment of protein localization to membrane | 100/3918 | 260/18723 | 6.01e-11 | 6.33e-09 | 100 |
| GO:0006605 | Colorectum | AD | protein targeting | 105/3918 | 314/18723 | 1.39e-07 | 6.44e-06 | 105 |
| GO:0070972 | Colorectum | AD | protein localization to endoplasmic reticulum | 26/3918 | 74/18723 | 3.28e-03 | 2.40e-02 | 26 |
| GO:0006620 | Colorectum | AD | posttranslational protein targeting to endoplasmic reticulum membrane | 7/3918 | 12/18723 | 5.09e-03 | 3.38e-02 | 7 |
| GO:0071806 | Colorectum | AD | protein transmembrane transport | 21/3918 | 59/18723 | 6.58e-03 | 4.08e-02 | 21 |
| GO:00725942 | Colorectum | MSS | establishment of protein localization to organelle | 139/3467 | 422/18723 | 5.75e-13 | 1.12e-10 | 139 |
| Pathway ID | Tissue | Disease Stage | Description | Gene Ratio | Bg Ratio | pvalue | p.adjust | qvalue | Count |
| hsa0414118 | Breast | Precancer | Protein processing in endoplasmic reticulum | 33/684 | 174/8465 | 2.78e-06 | 3.83e-05 | 2.94e-05 | 33 |
| hsa030609 | Breast | Precancer | Protein export | 6/684 | 23/8465 | 8.34e-03 | 4.54e-02 | 3.48e-02 | 6 |
| hsa0414119 | Breast | Precancer | Protein processing in endoplasmic reticulum | 33/684 | 174/8465 | 2.78e-06 | 3.83e-05 | 2.94e-05 | 33 |
| hsa0306012 | Breast | Precancer | Protein export | 6/684 | 23/8465 | 8.34e-03 | 4.54e-02 | 3.48e-02 | 6 |
| hsa0414124 | Breast | IDC | Protein processing in endoplasmic reticulum | 36/867 | 174/8465 | 2.73e-05 | 2.86e-04 | 2.14e-04 | 36 |
| hsa0414134 | Breast | IDC | Protein processing in endoplasmic reticulum | 36/867 | 174/8465 | 2.73e-05 | 2.86e-04 | 2.14e-04 | 36 |
| hsa0414143 | Breast | DCIS | Protein processing in endoplasmic reticulum | 36/846 | 174/8465 | 1.60e-05 | 1.91e-04 | 1.41e-04 | 36 |
| hsa0414153 | Breast | DCIS | Protein processing in endoplasmic reticulum | 36/846 | 174/8465 | 1.60e-05 | 1.91e-04 | 1.41e-04 | 36 |
| hsa04141 | Colorectum | AD | Protein processing in endoplasmic reticulum | 80/2092 | 174/8465 | 5.96e-10 | 1.25e-08 | 7.96e-09 | 80 |
| hsa03060 | Colorectum | AD | Protein export | 14/2092 | 23/8465 | 2.43e-04 | 1.90e-03 | 1.21e-03 | 14 |
| hsa041411 | Colorectum | AD | Protein processing in endoplasmic reticulum | 80/2092 | 174/8465 | 5.96e-10 | 1.25e-08 | 7.96e-09 | 80 |
| hsa030601 | Colorectum | AD | Protein export | 14/2092 | 23/8465 | 2.43e-04 | 1.90e-03 | 1.21e-03 | 14 |
| hsa041414 | Colorectum | MSS | Protein processing in endoplasmic reticulum | 75/1875 | 174/8465 | 3.78e-10 | 8.44e-09 | 5.17e-09 | 75 |
| hsa030602 | Colorectum | MSS | Protein export | 15/1875 | 23/8465 | 1.13e-05 | 1.26e-04 | 7.71e-05 | 15 |
| hsa041415 | Colorectum | MSS | Protein processing in endoplasmic reticulum | 75/1875 | 174/8465 | 3.78e-10 | 8.44e-09 | 5.17e-09 | 75 |
| hsa030603 | Colorectum | MSS | Protein export | 15/1875 | 23/8465 | 1.13e-05 | 1.26e-04 | 7.71e-05 | 15 |
| hsa041418 | Colorectum | FAP | Protein processing in endoplasmic reticulum | 50/1404 | 174/8465 | 3.64e-05 | 3.68e-04 | 2.24e-04 | 50 |
| hsa030606 | Colorectum | FAP | Protein export | 10/1404 | 23/8465 | 2.17e-03 | 1.05e-02 | 6.39e-03 | 10 |
| hsa041419 | Colorectum | FAP | Protein processing in endoplasmic reticulum | 50/1404 | 174/8465 | 3.64e-05 | 3.68e-04 | 2.24e-04 | 50 |
| hsa030607 | Colorectum | FAP | Protein export | 10/1404 | 23/8465 | 2.17e-03 | 1.05e-02 | 6.39e-03 | 10 |
| Hugo Symbol | Variant Class | Variant Classification | dbSNP RS | HGVSc | HGVSp | HGVSp Short | SWISSPROT | BIOTYPE | SIFT | PolyPhen | Tumor Sample Barcode | Tissue | Histology | Sex | Age | Stage | Therapy Types | Drugs | Outcome |
| SEC62 | SNV | Missense_Mutation | novel | c.402N>C | p.Lys134Asn | p.K134N | Q99442 | protein_coding | tolerated(0.08) | possibly_damaging(0.481) | TCGA-3C-AALI-01 | Breast | breast invasive carcinoma | Female | <65 | I/II | Unspecific | Poly E | Complete Response |
| SEC62 | SNV | Missense_Mutation | rs866931174 | c.364N>A | p.Asp122Asn | p.D122N | Q99442 | protein_coding | tolerated(0.26) | benign(0.028) | TCGA-AC-A3QQ-01 | Breast | breast invasive carcinoma | Female | <65 | I/II | Unknown | Unknown | SD |
| SEC62 | SNV | Missense_Mutation | | c.73N>A | p.Ala25Thr | p.A25T | Q99442 | protein_coding | deleterious(0) | probably_damaging(0.984) | TCGA-AC-A62V-01 | Breast | breast invasive carcinoma | Male | <65 | III/IV | Targeted Molecular therapy | denosumab | PD |
| SEC62 | SNV | Missense_Mutation | novel | c.632C>A | p.Thr211Asn | p.T211N | Q99442 | protein_coding | deleterious(0.01) | possibly_damaging(0.632) | TCGA-BH-A0BG-01 | Breast | breast invasive carcinoma | Female | >=65 | I/II | Unknown | Unknown | SD |
| SEC62 | SNV | Missense_Mutation | | c.7N>A | p.Glu3Lys | p.E3K | Q99442 | protein_coding | deleterious(0.01) | benign(0) | TCGA-BH-A18V-01 | Breast | breast invasive carcinoma | Female | <65 | I/II | Unknown | Unknown | SD |
| SEC62 | insertion | In_Frame_Ins | novel | c.953_954insTTTGTGGAGTAAGTGCCTTACAAAGGCAAAAGGGCCTAG | p.Lys318delinsAsnLeuTrpSerLysCysLeuThrLysAlaLysGlyProArg | p.K318delinsNLWSKCLTKAKGPR | Q99442 | protein_coding | | | TCGA-A2-A0EO-01 | Breast | breast invasive carcinoma | Female | <65 | I/II | Hormone Therapy | tamoxiphen | SD |
| SEC62 | insertion | Frame_Shift_Ins | novel | c.362_363insG | p.Asp122ArgfsTer2 | p.D122Rfs*2 | Q99442 | protein_coding | | | TCGA-AC-A3QQ-01 | Breast | breast invasive carcinoma | Female | <65 | I/II | Unknown | Unknown | SD |
| SEC62 | insertion | Frame_Shift_Ins | novel | c.1046_1047insGTATTTGTTAATAAAAAGCTGGGAAAAC | p.Asp350TyrfsTer11 | p.D350Yfs*11 | Q99442 | protein_coding | | | TCGA-BH-A0H0-01 | Breast | breast invasive carcinoma | Female | >=65 | I/II | Hormone Therapy | arimidex | SD |
| SEC62 | SNV | Missense_Mutation | | c.7G>A | p.Glu3Lys | p.E3K | Q99442 | protein_coding | deleterious(0.01) | benign(0) | TCGA-VS-A9V5-01 | Cervix | cervical & endocervical cancer | Female | <65 | I/II | Chemotherapy | carboplatin | PD |
| SEC62 | SNV | Missense_Mutation | novel | c.728N>C | p.Val243Ala | p.V243A | Q99442 | protein_coding | deleterious(0.05) | benign(0.262) | TCGA-AZ-4315-01 | Colorectum | colon adenocarcinoma | Male | <65 | I/II | Unknown | Unknown | SD |


