
|
|||||
|
 | |
| |
| |
| |
| |
| |
|
Gene: SEC61B |
Gene summary for SEC61B |
| Gene information | Species | Human | Gene symbol | SEC61B | Gene ID | 10952 |
| Gene name | SEC61 translocon subunit beta | |
| Gene Alias | SEC61B | |
| Cytomap | 9q22.33 | |
| Gene Type | protein-coding | GO ID | GO:0006508 | UniProtAcc | P60468 |
Top |
Malignant transformation analysis |
| Identification of the aberrant gene expression in precancerous and cancerous lesions by comparing the gene expression of stem-like cells in diseased tissues with normal stem cells |
| Entrez ID | Symbol | Replicates | Species | Organ | Tissue | Adj P-value | Log2FC | Malignancy |
| 10952 | SEC61B | GSM4909281 | Human | Breast | IDC | 3.85e-09 | 3.00e-01 | 0.21 |
| 10952 | SEC61B | GSM4909285 | Human | Breast | IDC | 2.98e-86 | 6.99e-01 | 0.21 |
| 10952 | SEC61B | GSM4909286 | Human | Breast | IDC | 7.29e-12 | -2.98e-01 | 0.1081 |
| 10952 | SEC61B | GSM4909287 | Human | Breast | IDC | 1.62e-03 | 7.57e-02 | 0.2057 |
| 10952 | SEC61B | GSM4909288 | Human | Breast | IDC | 1.67e-07 | -6.62e-02 | 0.0988 |
| 10952 | SEC61B | GSM4909290 | Human | Breast | IDC | 4.77e-10 | 3.40e-01 | 0.2096 |
| 10952 | SEC61B | GSM4909293 | Human | Breast | IDC | 2.68e-02 | -1.48e-01 | 0.1581 |
| 10952 | SEC61B | GSM4909294 | Human | Breast | IDC | 1.47e-11 | -1.76e-01 | 0.2022 |
| 10952 | SEC61B | GSM4909296 | Human | Breast | IDC | 2.44e-22 | 1.16e-01 | 0.1524 |
| 10952 | SEC61B | GSM4909297 | Human | Breast | IDC | 7.25e-34 | -5.02e-01 | 0.1517 |
| 10952 | SEC61B | GSM4909301 | Human | Breast | IDC | 2.80e-18 | 2.68e-01 | 0.1577 |
| 10952 | SEC61B | GSM4909302 | Human | Breast | IDC | 4.18e-03 | -1.37e-01 | 0.1545 |
| 10952 | SEC61B | GSM4909309 | Human | Breast | IDC | 2.53e-04 | -1.72e-01 | 0.0483 |
| 10952 | SEC61B | GSM4909311 | Human | Breast | IDC | 2.54e-60 | -4.10e-01 | 0.1534 |
| 10952 | SEC61B | GSM4909312 | Human | Breast | IDC | 1.73e-15 | -8.81e-02 | 0.1552 |
| 10952 | SEC61B | GSM4909313 | Human | Breast | IDC | 1.97e-08 | -2.35e-01 | 0.0391 |
| 10952 | SEC61B | GSM4909315 | Human | Breast | IDC | 8.55e-18 | 2.70e-01 | 0.21 |
| 10952 | SEC61B | GSM4909316 | Human | Breast | IDC | 2.60e-11 | 2.98e-01 | 0.21 |
| 10952 | SEC61B | GSM4909318 | Human | Breast | IDC | 1.15e-02 | 1.01e-01 | 0.2031 |
| 10952 | SEC61B | GSM4909319 | Human | Breast | IDC | 7.93e-71 | -8.37e-01 | 0.1563 |
| Page: 1 2 3 4 5 6 7 8 9 10 11 12 13 14 15 |
| Tissue | Expression Dynamics | Abbreviation |
| Breast | 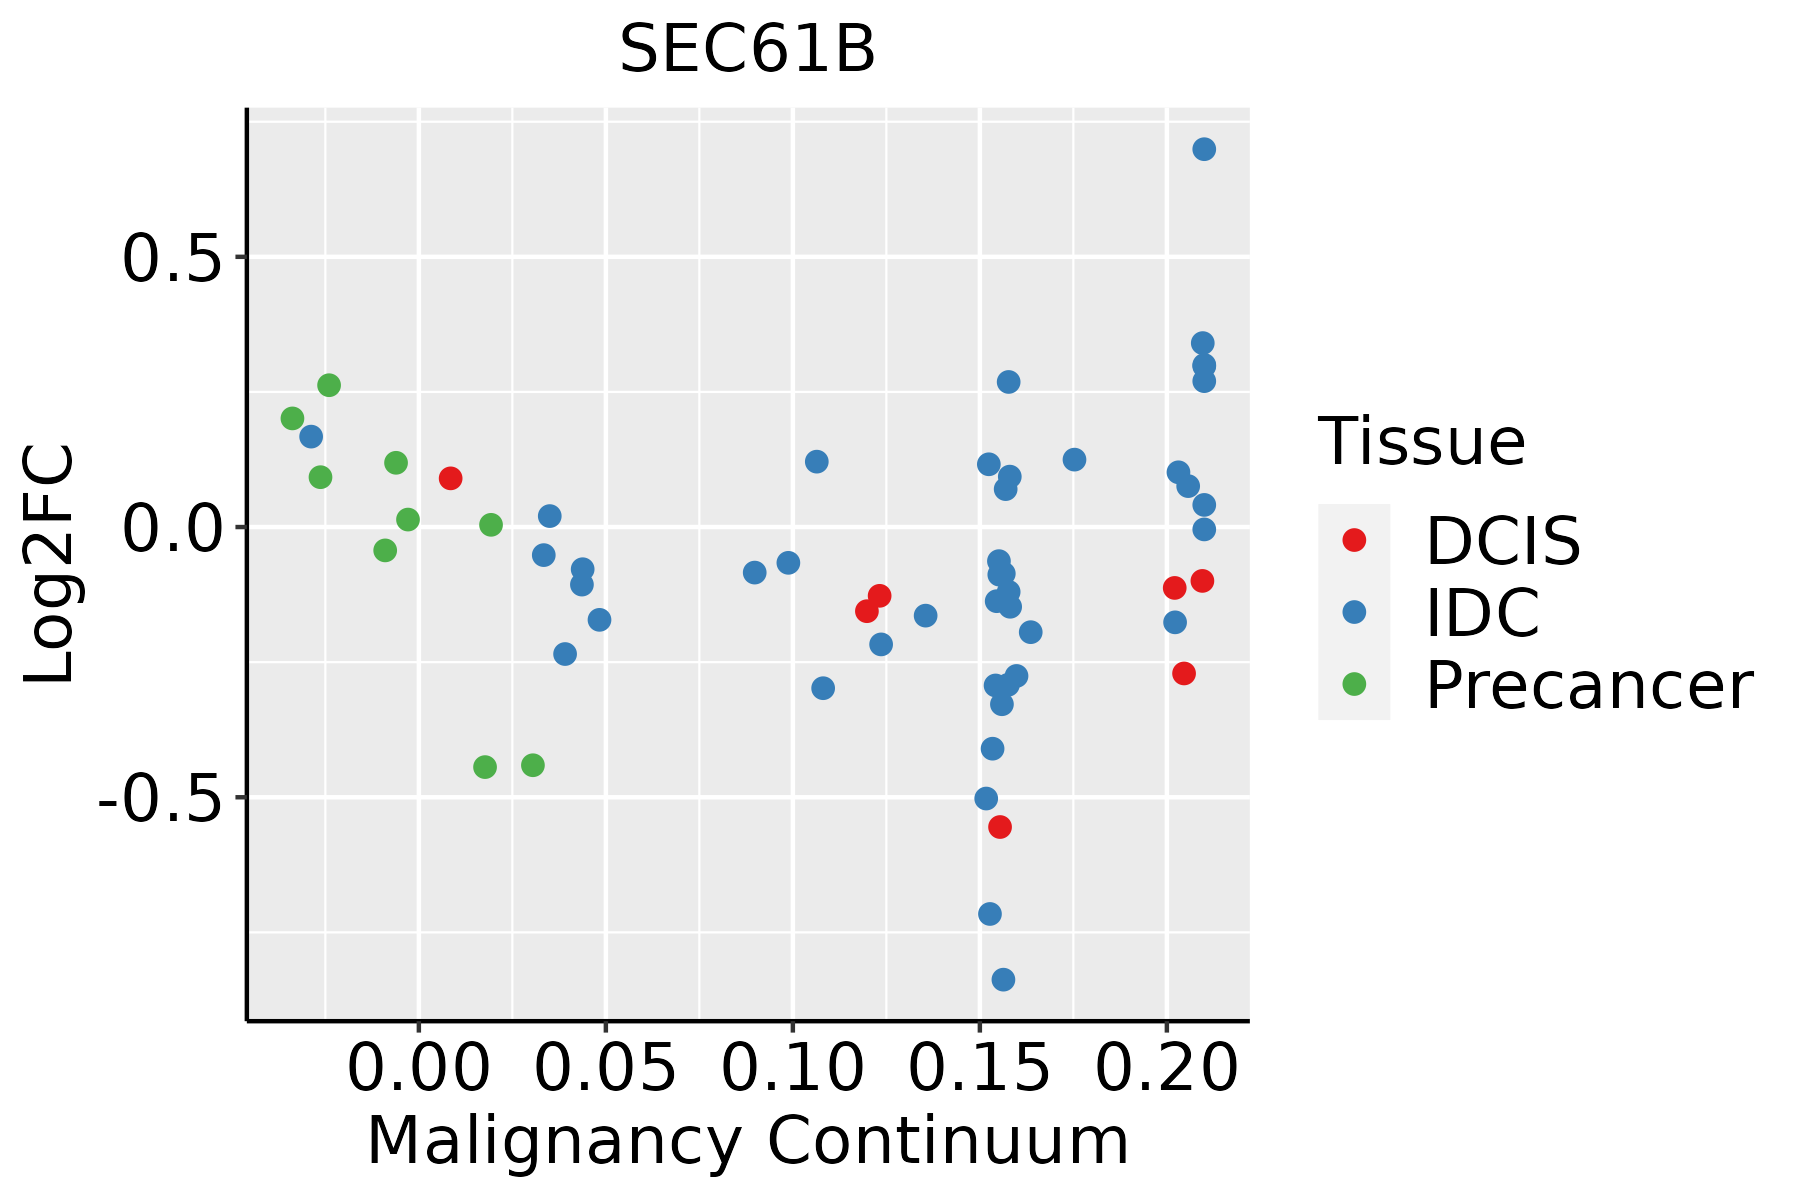 | IDC: Invasive ductal carcinoma |
| DCIS: Ductal carcinoma in situ | ||
| Precancer(BRCA1-mut): Precancerous lesion from BRCA1 mutation carriers | ||
| Cervix | 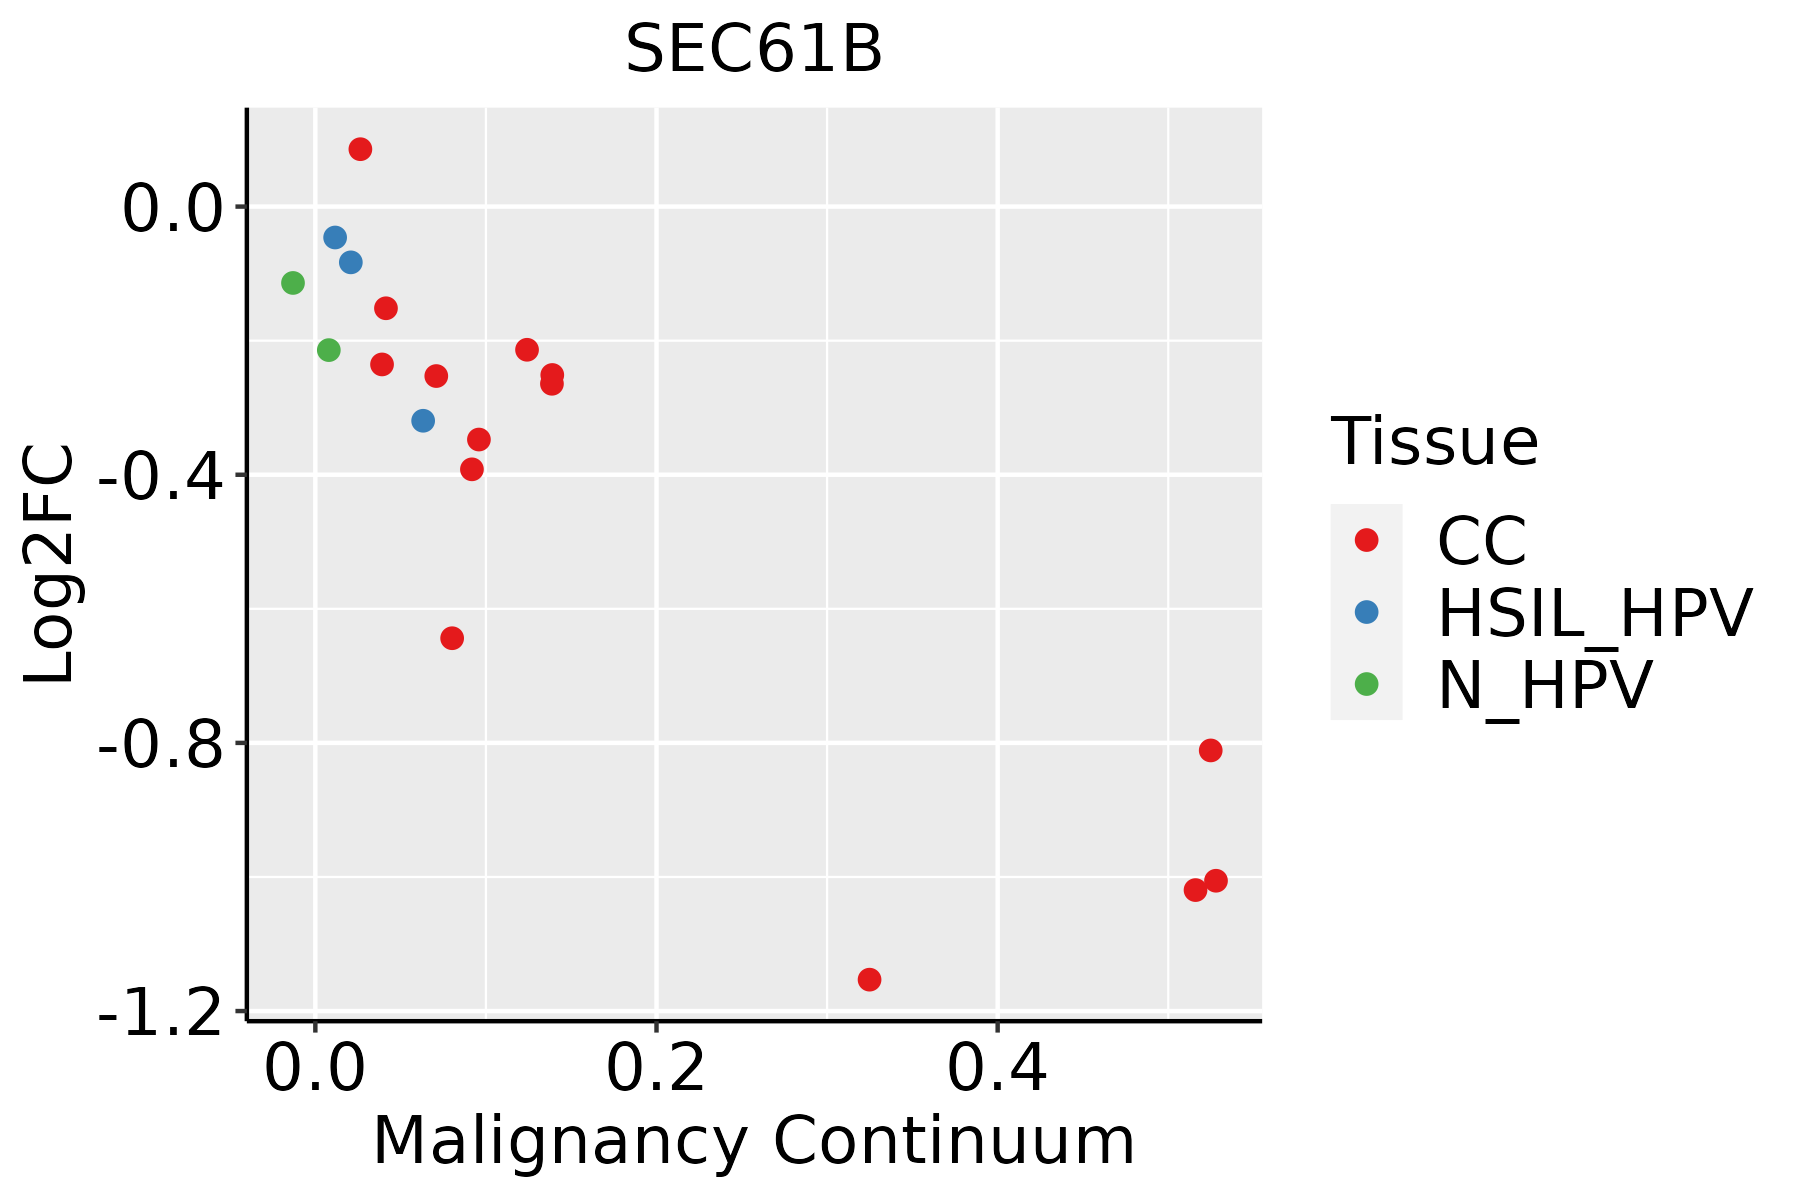 | CC: Cervix cancer |
| HSIL_HPV: HPV-infected high-grade squamous intraepithelial lesions | ||
| N_HPV: HPV-infected normal cervix | ||
| Colorectum (GSE201348) |  | FAP: Familial adenomatous polyposis |
| CRC: Colorectal cancer | ||
| Colorectum (HTA11) |  | AD: Adenomas |
| SER: Sessile serrated lesions | ||
| MSI-H: Microsatellite-high colorectal cancer | ||
| MSS: Microsatellite stable colorectal cancer | ||
| Endometrium | 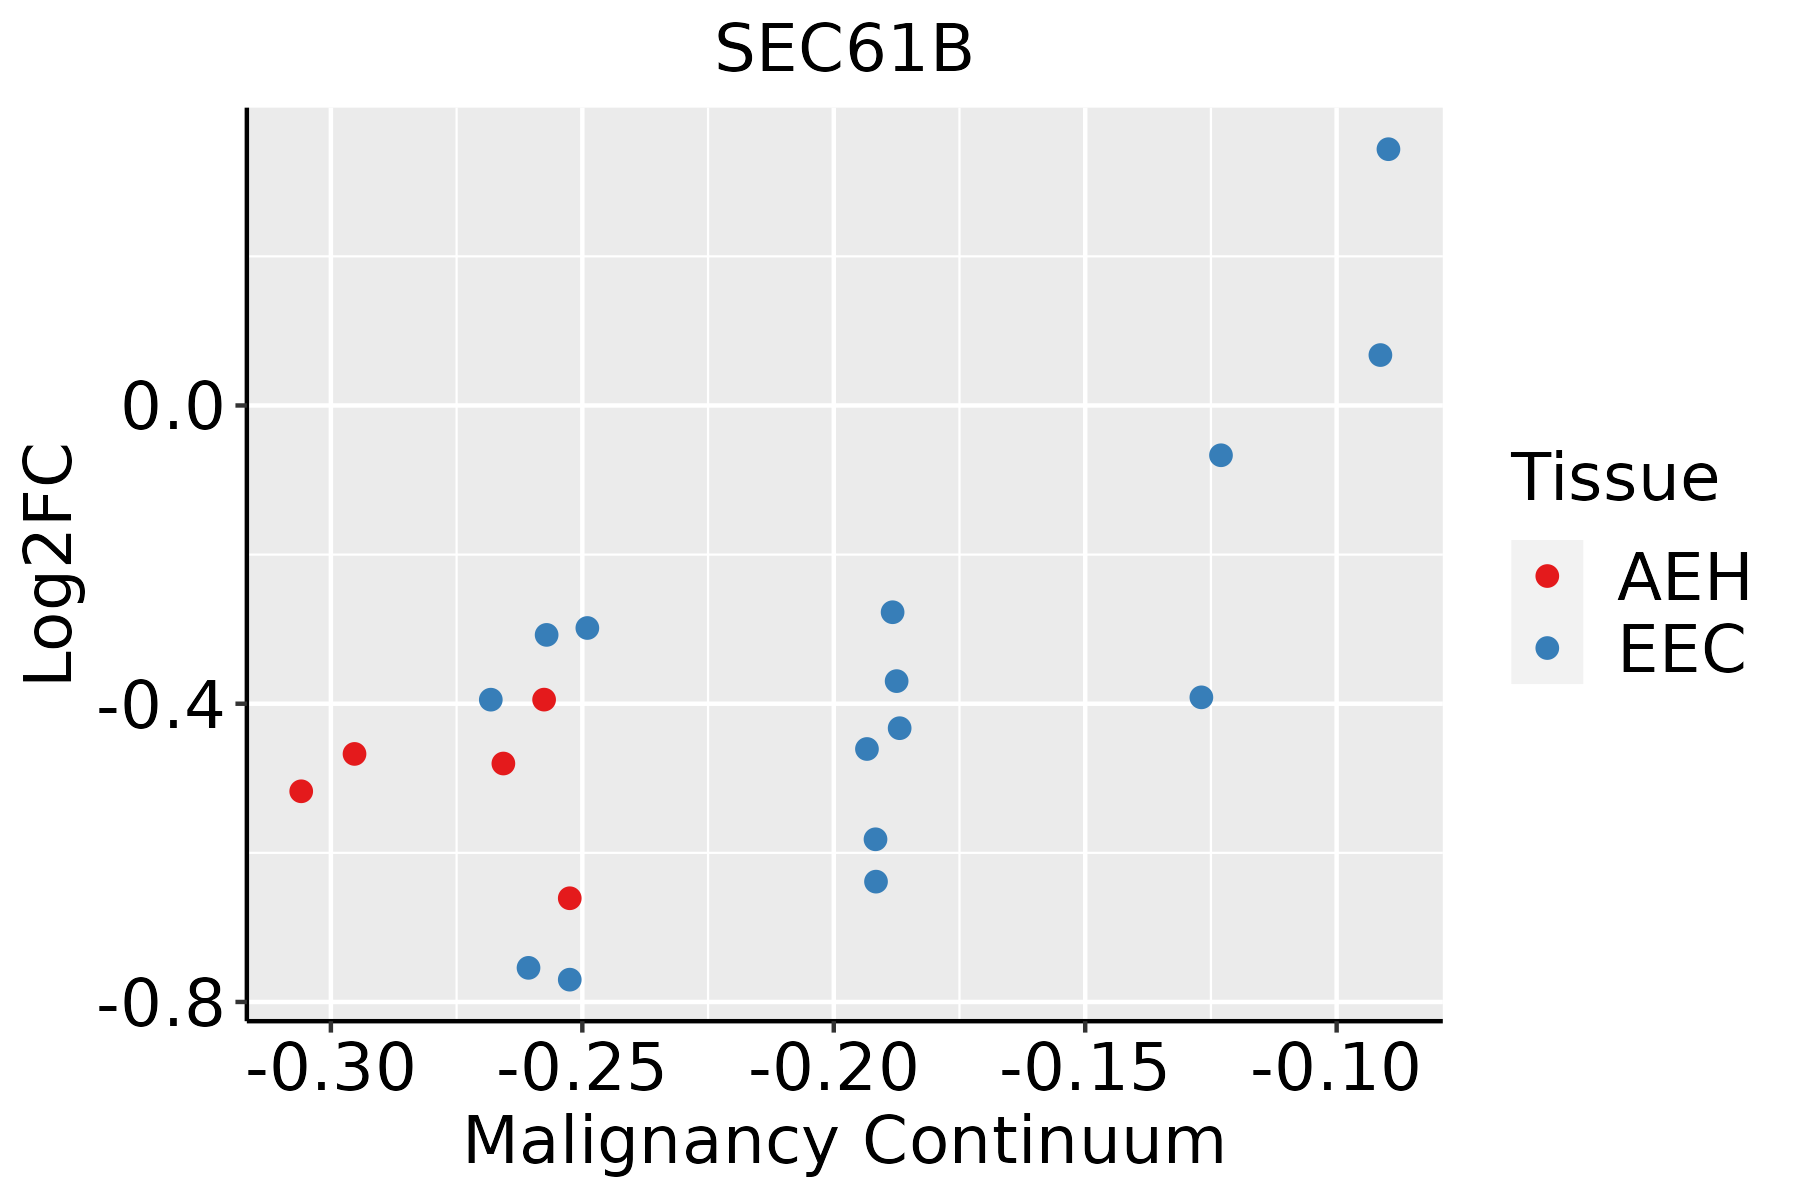 | AEH: Atypical endometrial hyperplasia |
| EEC: Endometrioid Cancer | ||
| Esophagus | 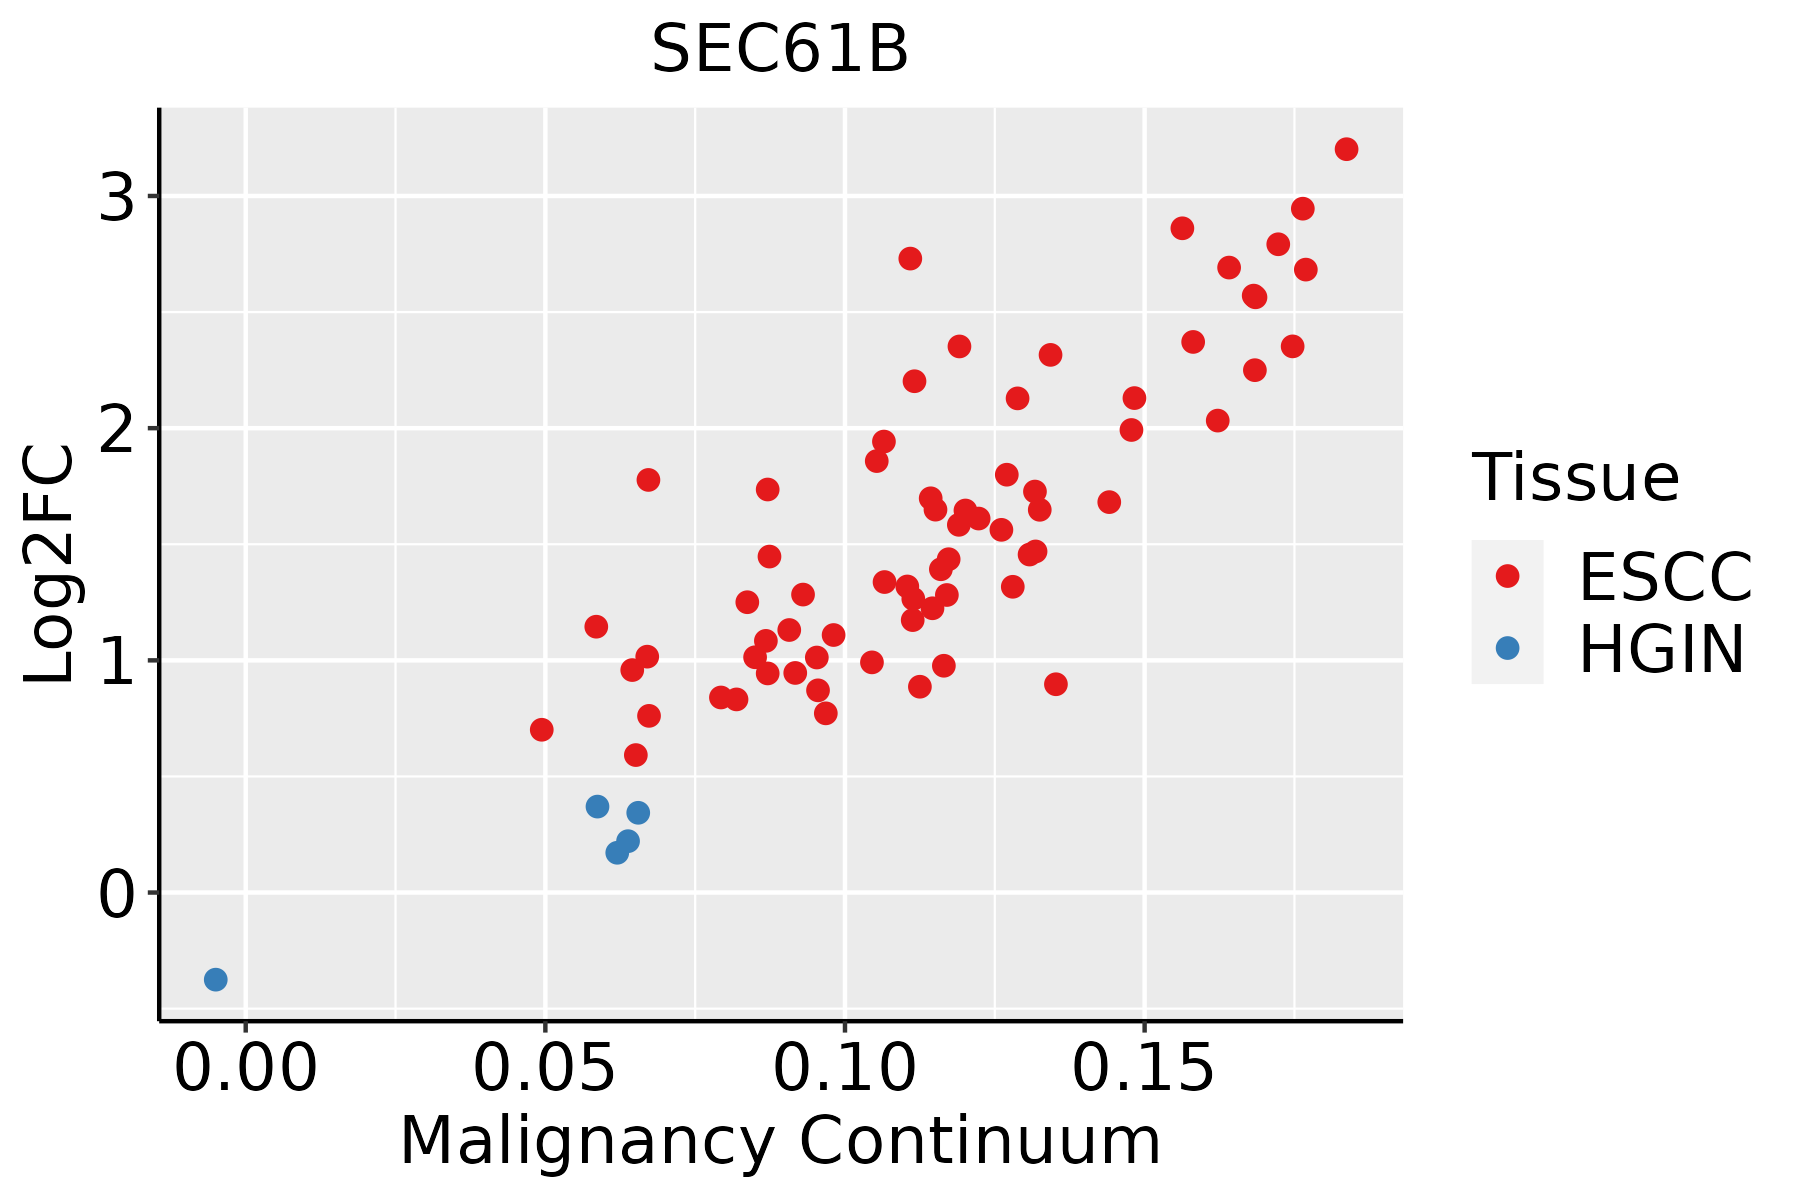 | ESCC: Esophageal squamous cell carcinoma |
| HGIN: High-grade intraepithelial neoplasias | ||
| LGIN: Low-grade intraepithelial neoplasias | ||
| Liver | 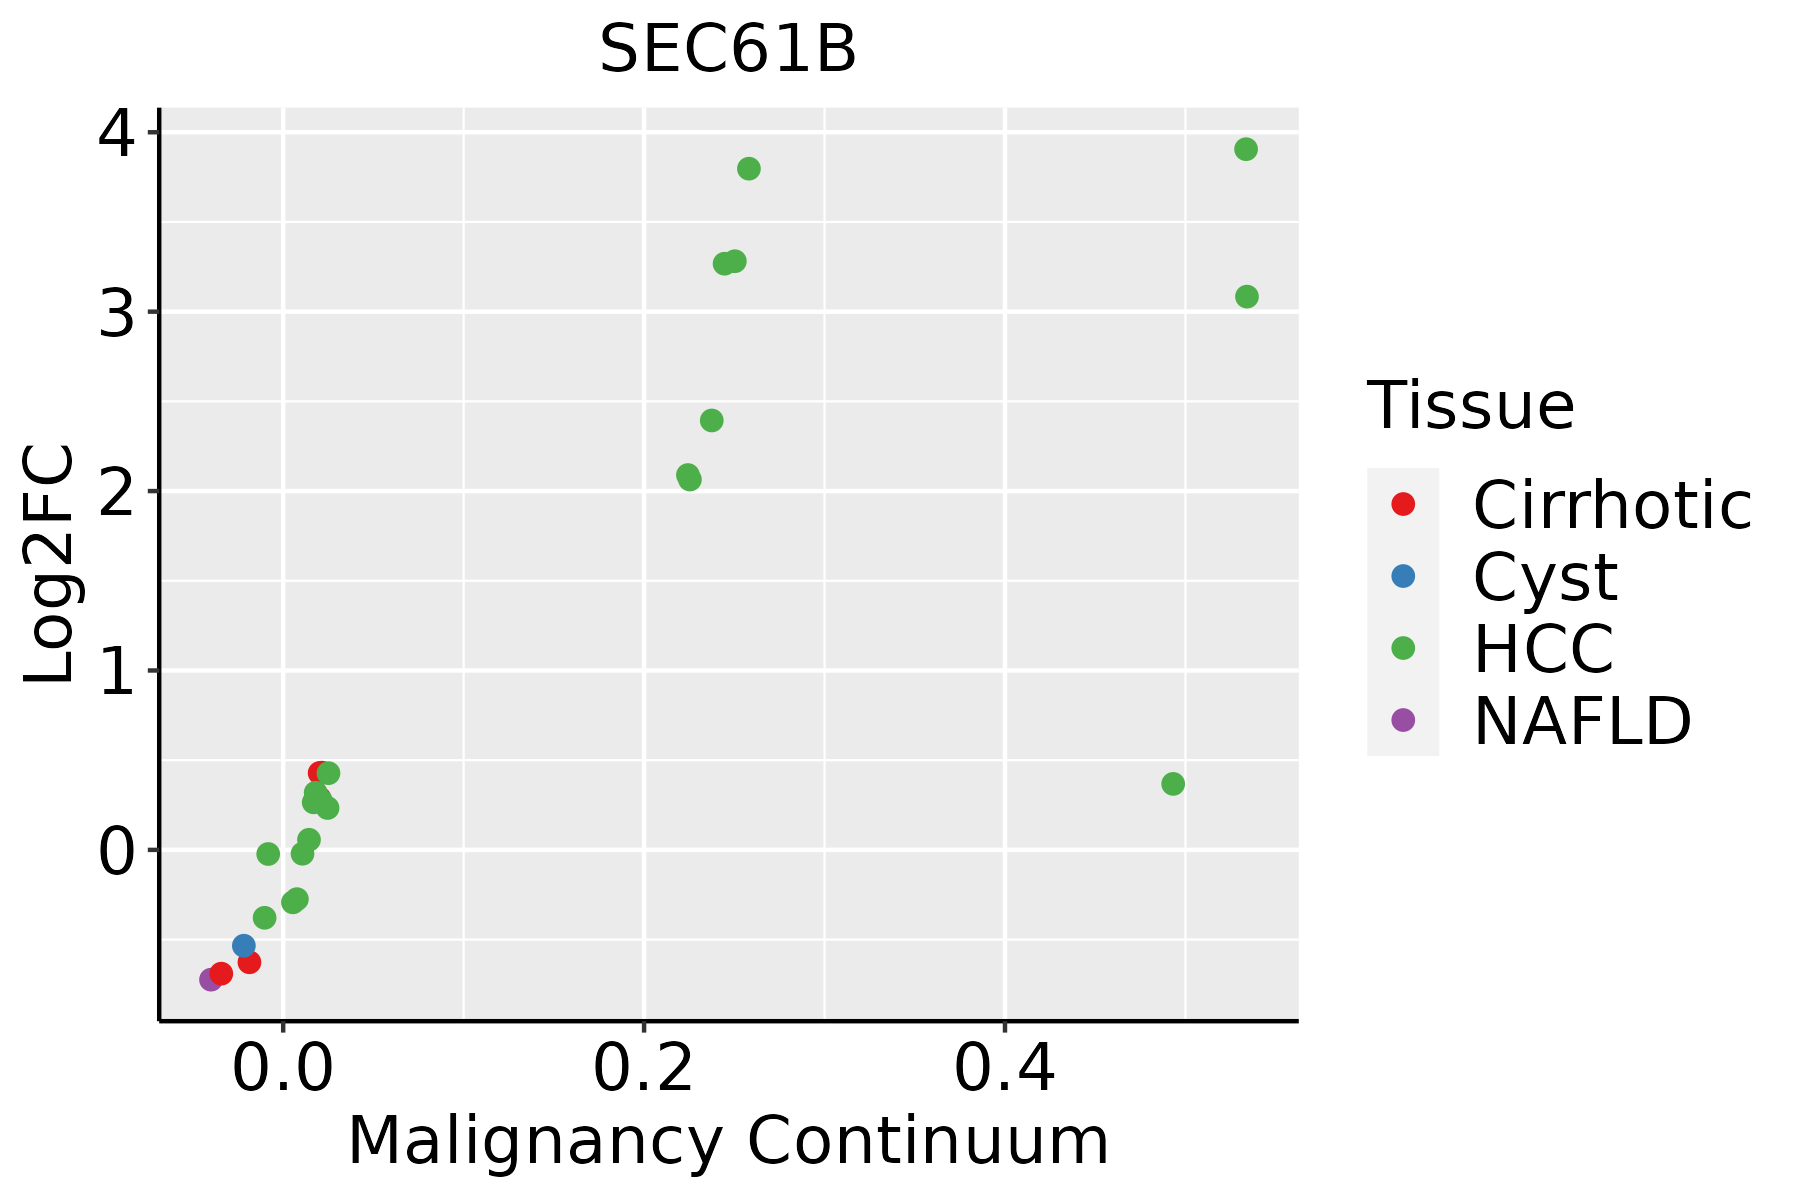 | HCC: Hepatocellular carcinoma |
| NAFLD: Non-alcoholic fatty liver disease | ||
| Oral Cavity |  | EOLP: Erosive Oral lichen planus |
| LP: leukoplakia | ||
| NEOLP: Non-erosive oral lichen planus | ||
| OSCC: Oral squamous cell carcinoma | ||
| Prostate | 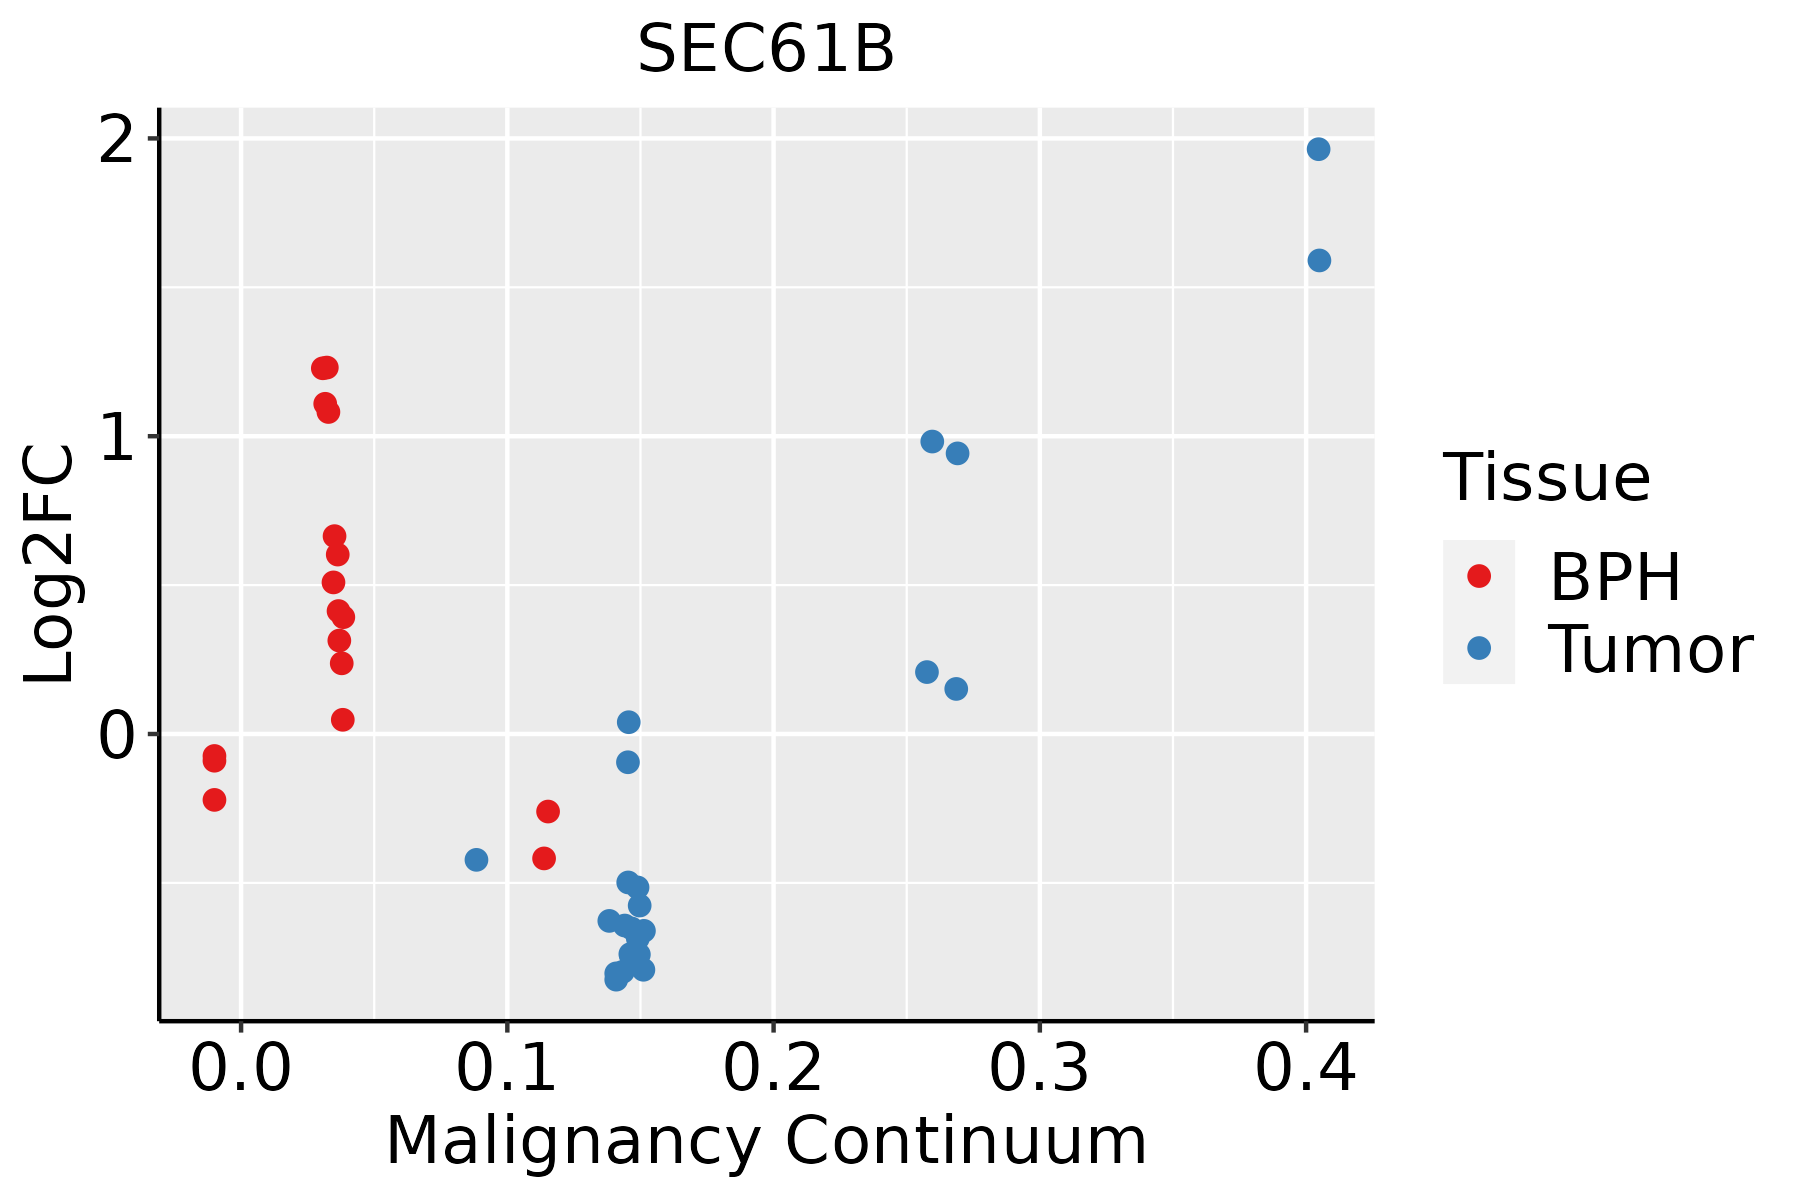 | BPH: Benign Prostatic Hyperplasia |
| Skin | 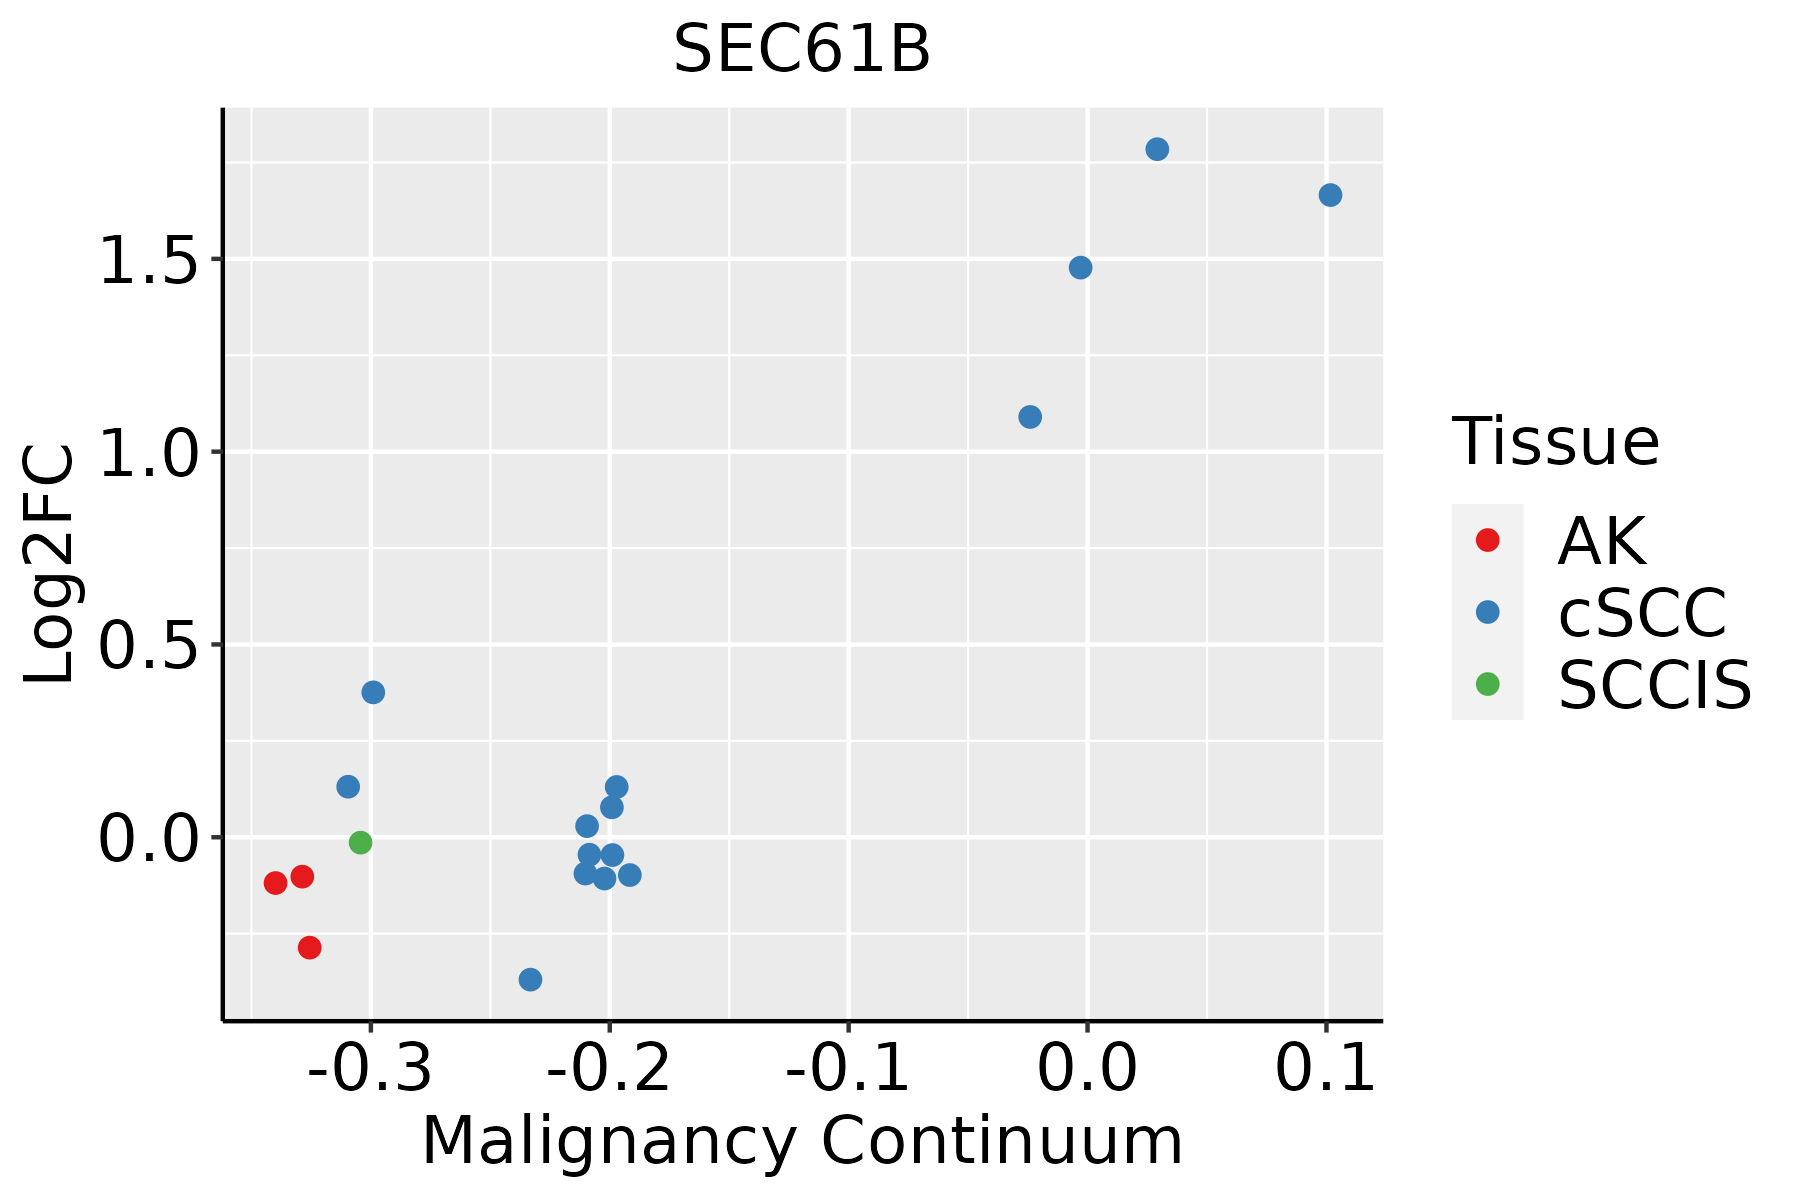 | AK: Actinic keratosis |
| cSCC: Cutaneous squamous cell carcinoma | ||
| SCCIS:squamous cell carcinoma in situ | ||
| Thyroid |  | ATC: Anaplastic thyroid cancer |
| HT: Hashimoto's thyroiditis | ||
| PTC: Papillary thyroid cancer |
| ∗log2FC in expression of this searched gene in stem-like cells from each diseased tissue sample relative to stem-like cells in normal samples in each tissue plotted against the malignancy continuum. Samples are colored based on if they are from different disease stage. |
Top |
Malignant transformation related pathway analysis |
| Find out the enriched GO biological processes and KEGG pathways involved in transition from healthy to precancer to cancer |
| Tissue | Disease Stage | Enriched GO biological Processes |
| Colorectum | AD |  |
| Colorectum | SER |  |
| Colorectum | MSS |  |
| Colorectum | MSI-H |  |
| Colorectum | FAP |  |
| ∗Top 15 enriched GO BP terms are showed in the bar plot of each disease state in each tissue. Each row represents a significant GO biological process which is colored according to the -log10(p.adjust). |
| Page: 1 2 3 4 5 6 7 8 9 |
| GO ID | Tissue | Disease Stage | Description | Gene Ratio | Bg Ratio | pvalue | p.adjust | Count |
| GO:00349769 | Breast | Precancer | response to endoplasmic reticulum stress | 38/1080 | 256/18723 | 7.89e-08 | 4.60e-06 | 38 |
| GO:00104989 | Breast | Precancer | proteasomal protein catabolic process | 58/1080 | 490/18723 | 1.54e-07 | 8.05e-06 | 58 |
| GO:00709725 | Breast | Precancer | protein localization to endoplasmic reticulum | 15/1080 | 74/18723 | 1.74e-05 | 4.17e-04 | 15 |
| GO:00431619 | Breast | Precancer | proteasome-mediated ubiquitin-dependent protein catabolic process | 42/1080 | 412/18723 | 2.49e-04 | 3.72e-03 | 42 |
| GO:00066059 | Breast | Precancer | protein targeting | 33/1080 | 314/18723 | 6.50e-04 | 7.99e-03 | 33 |
| GO:00725948 | Breast | Precancer | establishment of protein localization to organelle | 41/1080 | 422/18723 | 7.75e-04 | 9.20e-03 | 41 |
| GO:00718064 | Breast | Precancer | protein transmembrane transport | 10/1080 | 59/18723 | 1.86e-03 | 1.81e-02 | 10 |
| GO:00066208 | Breast | Precancer | posttranslational protein targeting to endoplasmic reticulum membrane | 4/1080 | 12/18723 | 3.75e-03 | 3.04e-02 | 4 |
| GO:001049814 | Breast | IDC | proteasomal protein catabolic process | 75/1434 | 490/18723 | 5.59e-09 | 4.41e-07 | 75 |
| GO:003497614 | Breast | IDC | response to endoplasmic reticulum stress | 43/1434 | 256/18723 | 8.42e-07 | 3.82e-05 | 43 |
| GO:007097213 | Breast | IDC | protein localization to endoplasmic reticulum | 18/1434 | 74/18723 | 8.58e-06 | 2.47e-04 | 18 |
| GO:004316114 | Breast | IDC | proteasome-mediated ubiquitin-dependent protein catabolic process | 57/1434 | 412/18723 | 9.55e-06 | 2.68e-04 | 57 |
| GO:000660514 | Breast | IDC | protein targeting | 43/1434 | 314/18723 | 1.44e-04 | 2.53e-03 | 43 |
| GO:007259413 | Breast | IDC | establishment of protein localization to organelle | 51/1434 | 422/18723 | 7.94e-04 | 9.55e-03 | 51 |
| GO:007180612 | Breast | IDC | protein transmembrane transport | 12/1434 | 59/18723 | 1.49e-03 | 1.50e-02 | 12 |
| GO:001049824 | Breast | DCIS | proteasomal protein catabolic process | 75/1390 | 490/18723 | 1.44e-09 | 1.40e-07 | 75 |
| GO:003497622 | Breast | DCIS | response to endoplasmic reticulum stress | 43/1390 | 256/18723 | 3.65e-07 | 1.71e-05 | 43 |
| GO:004316124 | Breast | DCIS | proteasome-mediated ubiquitin-dependent protein catabolic process | 57/1390 | 412/18723 | 3.76e-06 | 1.16e-04 | 57 |
| GO:007097222 | Breast | DCIS | protein localization to endoplasmic reticulum | 18/1390 | 74/18723 | 5.57e-06 | 1.60e-04 | 18 |
| GO:000660523 | Breast | DCIS | protein targeting | 43/1390 | 314/18723 | 7.17e-05 | 1.41e-03 | 43 |
| Page: 1 2 3 4 5 6 7 8 9 10 11 12 13 14 15 16 17 18 |
| Pathway ID | Tissue | Disease Stage | Description | Gene Ratio | Bg Ratio | pvalue | p.adjust | qvalue | Count |
| hsa0414118 | Breast | Precancer | Protein processing in endoplasmic reticulum | 33/684 | 174/8465 | 2.78e-06 | 3.83e-05 | 2.94e-05 | 33 |
| hsa0511014 | Breast | Precancer | Vibrio cholerae infection | 14/684 | 50/8465 | 2.67e-05 | 2.64e-04 | 2.02e-04 | 14 |
| hsa0414518 | Breast | Precancer | Phagosome | 27/684 | 152/8465 | 7.37e-05 | 6.85e-04 | 5.25e-04 | 27 |
| hsa030609 | Breast | Precancer | Protein export | 6/684 | 23/8465 | 8.34e-03 | 4.54e-02 | 3.48e-02 | 6 |
| hsa0414119 | Breast | Precancer | Protein processing in endoplasmic reticulum | 33/684 | 174/8465 | 2.78e-06 | 3.83e-05 | 2.94e-05 | 33 |
| hsa0511015 | Breast | Precancer | Vibrio cholerae infection | 14/684 | 50/8465 | 2.67e-05 | 2.64e-04 | 2.02e-04 | 14 |
| hsa0414519 | Breast | Precancer | Phagosome | 27/684 | 152/8465 | 7.37e-05 | 6.85e-04 | 5.25e-04 | 27 |
| hsa0306012 | Breast | Precancer | Protein export | 6/684 | 23/8465 | 8.34e-03 | 4.54e-02 | 3.48e-02 | 6 |
| hsa0511022 | Breast | IDC | Vibrio cholerae infection | 17/867 | 50/8465 | 4.82e-06 | 6.82e-05 | 5.10e-05 | 17 |
| hsa0414522 | Breast | IDC | Phagosome | 34/867 | 152/8465 | 8.00e-06 | 9.99e-05 | 7.48e-05 | 34 |
| hsa0414124 | Breast | IDC | Protein processing in endoplasmic reticulum | 36/867 | 174/8465 | 2.73e-05 | 2.86e-04 | 2.14e-04 | 36 |
| hsa0511032 | Breast | IDC | Vibrio cholerae infection | 17/867 | 50/8465 | 4.82e-06 | 6.82e-05 | 5.10e-05 | 17 |
| hsa0414532 | Breast | IDC | Phagosome | 34/867 | 152/8465 | 8.00e-06 | 9.99e-05 | 7.48e-05 | 34 |
| hsa0414134 | Breast | IDC | Protein processing in endoplasmic reticulum | 36/867 | 174/8465 | 2.73e-05 | 2.86e-04 | 2.14e-04 | 36 |
| hsa0414541 | Breast | DCIS | Phagosome | 35/846 | 152/8465 | 1.67e-06 | 2.45e-05 | 1.81e-05 | 35 |
| hsa0511041 | Breast | DCIS | Vibrio cholerae infection | 17/846 | 50/8465 | 3.45e-06 | 4.45e-05 | 3.28e-05 | 17 |
| hsa0414143 | Breast | DCIS | Protein processing in endoplasmic reticulum | 36/846 | 174/8465 | 1.60e-05 | 1.91e-04 | 1.41e-04 | 36 |
| hsa0414551 | Breast | DCIS | Phagosome | 35/846 | 152/8465 | 1.67e-06 | 2.45e-05 | 1.81e-05 | 35 |
| hsa0511051 | Breast | DCIS | Vibrio cholerae infection | 17/846 | 50/8465 | 3.45e-06 | 4.45e-05 | 3.28e-05 | 17 |
| hsa0414153 | Breast | DCIS | Protein processing in endoplasmic reticulum | 36/846 | 174/8465 | 1.60e-05 | 1.91e-04 | 1.41e-04 | 36 |
| Page: 1 2 3 4 5 6 7 8 |
Top |
Cell-cell communication analysis |
| Identification of potential cell-cell interactions between two cell types and their ligand-receptor pairs for different disease states |
| Ligand | Receptor | LRpair | Pathway | Tissue | Disease Stage |
| Page: 1 |
Top |
Single-cell gene regulatory network inference analysis |
| Find out the significant the regulons (TFs) and the target genes of each regulon across cell types for different disease states |
| TF | Cell Type | Tissue | Disease Stage | Target Gene | RSS | Regulon Activity |
| ∗The dot plots of a searched regulon are shown for all cell subpopulations in each disease state of each tissue based on the regulon specific score inferred using pySCENIC and by calculating the average expression. |
| Page: 1 |
Top |
Somatic mutation of malignant transformation related genes |
| Annotation of somatic variants for genes involved in malignant transformation |
| Hugo Symbol | Variant Class | Variant Classification | dbSNP RS | HGVSc | HGVSp | HGVSp Short | SWISSPROT | BIOTYPE | SIFT | PolyPhen | Tumor Sample Barcode | Tissue | Histology | Sex | Age | Stage | Therapy Types | Drugs | Outcome |
| SEC61B | SNV | Missense_Mutation | rs776348686 | c.284N>A | p.Arg95His | p.R95H | P60468 | protein_coding | deleterious(0.04) | probably_damaging(0.964) | TCGA-AA-3710-01 | Colorectum | colon adenocarcinoma | Female | >=65 | I/II | Unknown | Unknown | SD |
| SEC61B | SNV | Missense_Mutation | c.23G>A | p.Gly8Asp | p.G8D | P60468 | protein_coding | tolerated(0.13) | benign(0.003) | TCGA-AA-3984-01 | Colorectum | colon adenocarcinoma | Female | <65 | I/II | Unknown | Unknown | SD | |
| SEC61B | SNV | Missense_Mutation | rs746398079 | c.244N>A | p.Ala82Thr | p.A82T | P60468 | protein_coding | deleterious(0.05) | probably_damaging(0.989) | TCGA-AZ-4315-01 | Colorectum | colon adenocarcinoma | Male | <65 | I/II | Unknown | Unknown | SD |
| SEC61B | deletion | Frame_Shift_Del | c.162delG | p.Met55CysfsTer22 | p.M55Cfs*22 | P60468 | protein_coding | TCGA-AZ-6598-01 | Colorectum | colon adenocarcinoma | Female | >=65 | I/II | Unknown | Unknown | SD | |||
| SEC61B | SNV | Missense_Mutation | rs746398079 | c.244N>A | p.Ala82Thr | p.A82T | P60468 | protein_coding | deleterious(0.05) | probably_damaging(0.989) | TCGA-A5-A0G1-01 | Endometrium | uterine corpus endometrioid carcinoma | Female | >=65 | I/II | Unknown | Unknown | SD |
| SEC61B | SNV | Missense_Mutation | rs746398079 | c.244N>A | p.Ala82Thr | p.A82T | P60468 | protein_coding | deleterious(0.05) | probably_damaging(0.989) | TCGA-A5-A0GG-01 | Endometrium | uterine corpus endometrioid carcinoma | Female | >=65 | I/II | Unknown | Unknown | SD |
| SEC61B | SNV | Missense_Mutation | novel | c.170N>A | p.Arg57Gln | p.R57Q | P60468 | protein_coding | deleterious(0.02) | probably_damaging(0.968) | TCGA-A5-A1OF-01 | Endometrium | uterine corpus endometrioid carcinoma | Female | <65 | I/II | Unknown | Unknown | SD |
| SEC61B | SNV | Missense_Mutation | novel | c.67N>A | p.Ala23Thr | p.A23T | P60468 | protein_coding | tolerated(0.07) | benign(0.003) | TCGA-A5-A2K5-01 | Endometrium | uterine corpus endometrioid carcinoma | Female | >=65 | I/II | Unknown | Unknown | SD |
| SEC61B | SNV | Missense_Mutation | novel | c.267N>G | p.Ile89Met | p.I89M | P60468 | protein_coding | deleterious(0.02) | probably_damaging(0.98) | TCGA-A5-A2K5-01 | Endometrium | uterine corpus endometrioid carcinoma | Female | >=65 | I/II | Unknown | Unknown | SD |
| SEC61B | SNV | Missense_Mutation | rs746398079 | c.244N>A | p.Ala82Thr | p.A82T | P60468 | protein_coding | deleterious(0.05) | probably_damaging(0.989) | TCGA-AJ-A8CV-01 | Endometrium | uterine corpus endometrioid carcinoma | Female | <65 | I/II | Unknown | Unknown | SD |
| Page: 1 2 |
Top |
Related drugs of malignant transformation related genes |
| Identification of chemicals and drugs interact with genes involved in malignant transfromation |
| (DGIdb 4.0) |
| Entrez ID | Symbol | Category | Interaction Types | Drug Claim Name | Drug Name | PMIDs |
| Page: 1 |

Copyright 2023-Present -The University of Texas Health Science Center at Houston |