
|
|||||
|
 | |
| |
| |
| |
| |
| |
|
Gene: SEC31A |
Gene summary for SEC31A |
| Gene information | Species | Human | Gene symbol | SEC31A | Gene ID | 22872 |
| Gene name | SEC31 homolog A, COPII coat complex component | |
| Gene Alias | ABP125 | |
| Cytomap | 4q21.22 | |
| Gene Type | protein-coding | GO ID | GO:0006810 | UniProtAcc | O94979 |
Top |
Malignant transformation analysis |
| Identification of the aberrant gene expression in precancerous and cancerous lesions by comparing the gene expression of stem-like cells in diseased tissues with normal stem cells |
| Entrez ID | Symbol | Replicates | Species | Organ | Tissue | Adj P-value | Log2FC | Malignancy |
| 22872 | SEC31A | CA_HPV_1 | Human | Cervix | CC | 2.54e-04 | -1.01e-01 | 0.0264 |
| 22872 | SEC31A | CA_HPV_3 | Human | Cervix | CC | 1.96e-03 | -7.36e-02 | 0.0414 |
| 22872 | SEC31A | CCI_1 | Human | Cervix | CC | 7.04e-05 | 6.31e-01 | 0.528 |
| 22872 | SEC31A | CCI_3 | Human | Cervix | CC | 3.68e-03 | 4.88e-01 | 0.516 |
| 22872 | SEC31A | L1 | Human | Cervix | CC | 2.58e-02 | -7.70e-02 | 0.0802 |
| 22872 | SEC31A | HTA11_3410_2000001011 | Human | Colorectum | AD | 3.99e-11 | -5.02e-01 | 0.0155 |
| 22872 | SEC31A | HTA11_347_2000001011 | Human | Colorectum | AD | 2.05e-09 | 5.01e-01 | -0.1954 |
| 22872 | SEC31A | HTA11_866_3004761011 | Human | Colorectum | AD | 1.84e-04 | -4.33e-01 | 0.096 |
| 22872 | SEC31A | HTA11_7696_3000711011 | Human | Colorectum | AD | 2.39e-10 | -3.18e-01 | 0.0674 |
| 22872 | SEC31A | HTA11_99999970781_79442 | Human | Colorectum | MSS | 1.28e-07 | -2.85e-01 | 0.294 |
| 22872 | SEC31A | HTA11_99999965062_69753 | Human | Colorectum | MSI-H | 1.20e-02 | 7.74e-01 | 0.3487 |
| 22872 | SEC31A | HTA11_99999974143_84620 | Human | Colorectum | MSS | 3.28e-15 | -4.01e-01 | 0.3005 |
| 22872 | SEC31A | F007 | Human | Colorectum | FAP | 2.46e-03 | -2.49e-01 | 0.1176 |
| 22872 | SEC31A | A001-C-207 | Human | Colorectum | FAP | 1.13e-05 | -3.54e-01 | 0.1278 |
| 22872 | SEC31A | A015-C-203 | Human | Colorectum | FAP | 7.83e-29 | -3.72e-01 | -0.1294 |
| 22872 | SEC31A | A015-C-204 | Human | Colorectum | FAP | 4.03e-09 | -4.64e-01 | -0.0228 |
| 22872 | SEC31A | A014-C-040 | Human | Colorectum | FAP | 3.94e-05 | -4.82e-01 | -0.1184 |
| 22872 | SEC31A | A002-C-201 | Human | Colorectum | FAP | 3.24e-17 | -3.63e-01 | 0.0324 |
| 22872 | SEC31A | A002-C-203 | Human | Colorectum | FAP | 1.97e-07 | -2.39e-01 | 0.2786 |
| 22872 | SEC31A | A001-C-119 | Human | Colorectum | FAP | 5.07e-04 | -1.71e-01 | -0.1557 |
| Page: 1 2 3 4 5 6 7 8 9 10 11 |
| Tissue | Expression Dynamics | Abbreviation |
| Cervix | 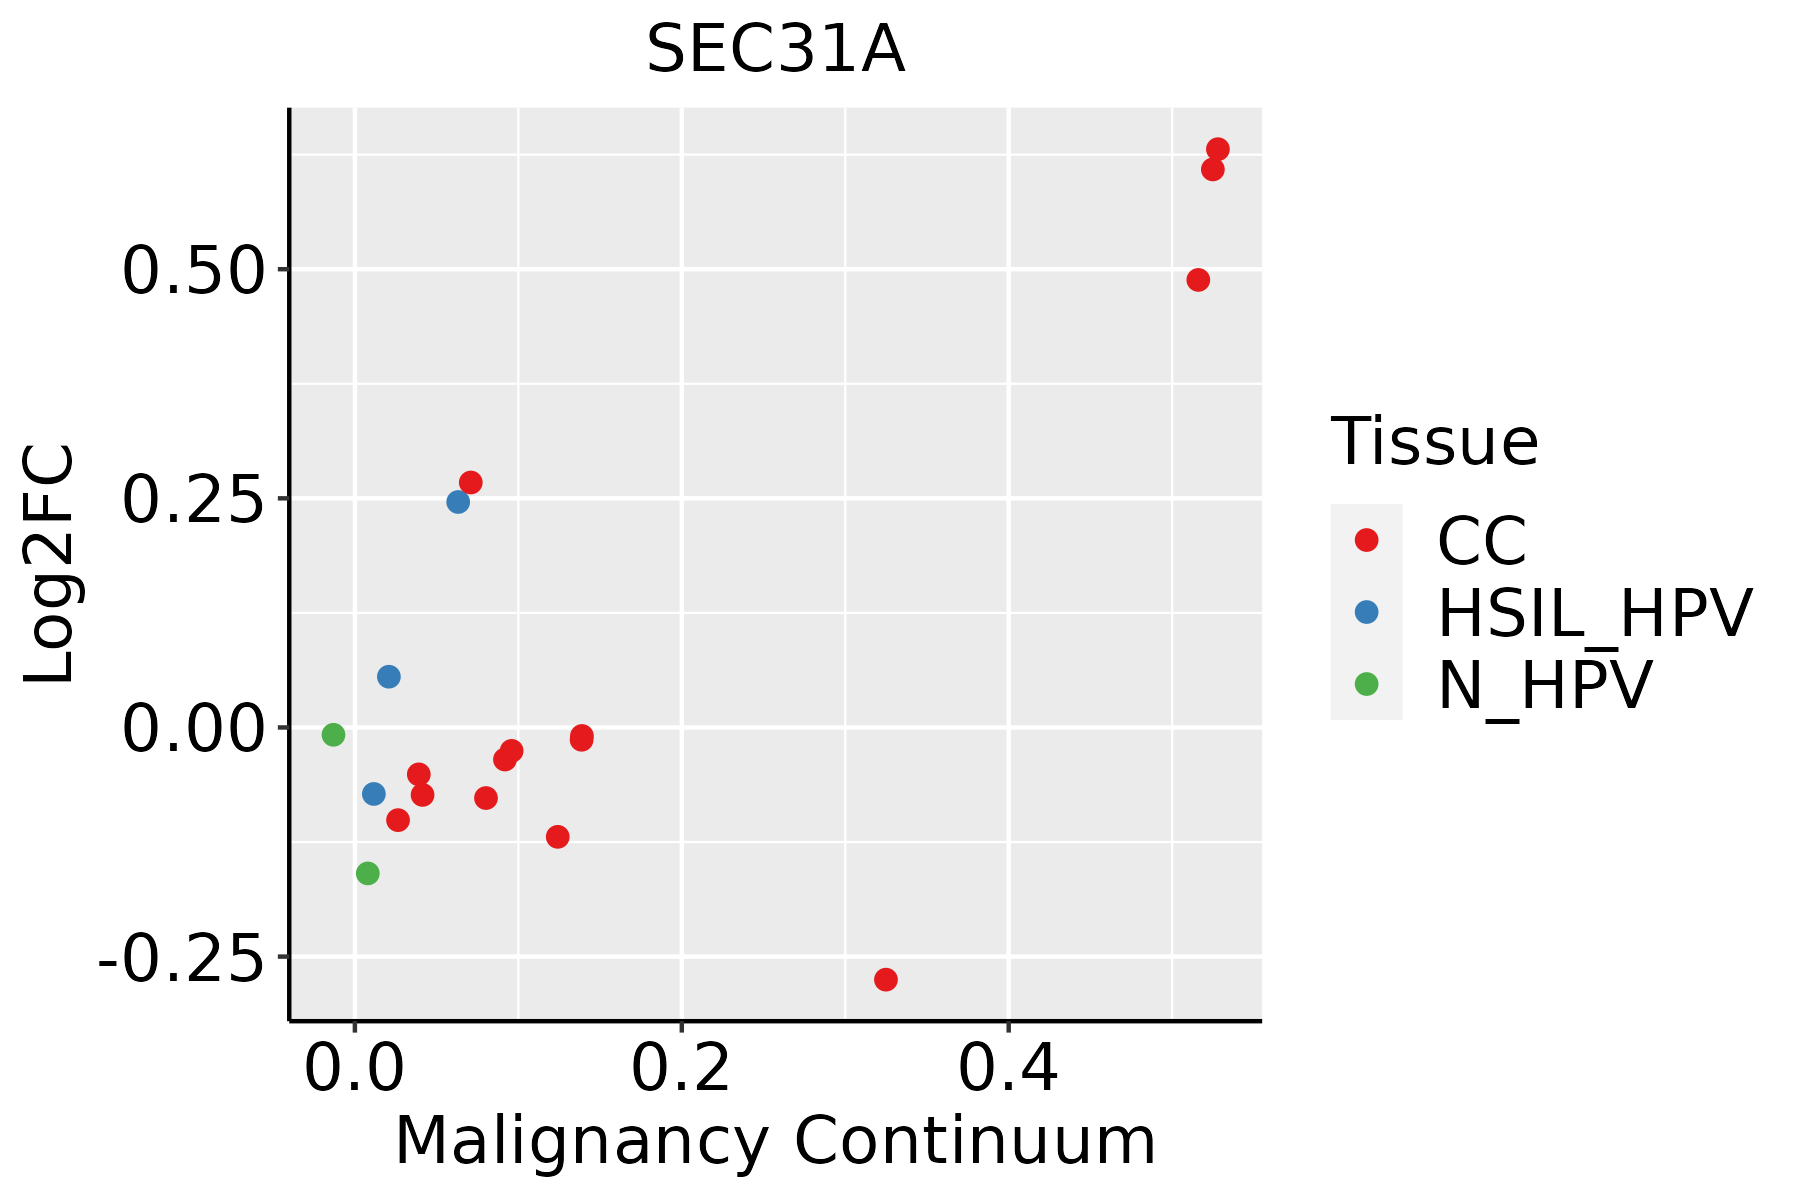 | CC: Cervix cancer |
| HSIL_HPV: HPV-infected high-grade squamous intraepithelial lesions | ||
| N_HPV: HPV-infected normal cervix | ||
| Colorectum (GSE201348) |  | FAP: Familial adenomatous polyposis |
| CRC: Colorectal cancer | ||
| Colorectum (HTA11) |  | AD: Adenomas |
| SER: Sessile serrated lesions | ||
| MSI-H: Microsatellite-high colorectal cancer | ||
| MSS: Microsatellite stable colorectal cancer | ||
| Esophagus |  | ESCC: Esophageal squamous cell carcinoma |
| HGIN: High-grade intraepithelial neoplasias | ||
| LGIN: Low-grade intraepithelial neoplasias | ||
| Liver | 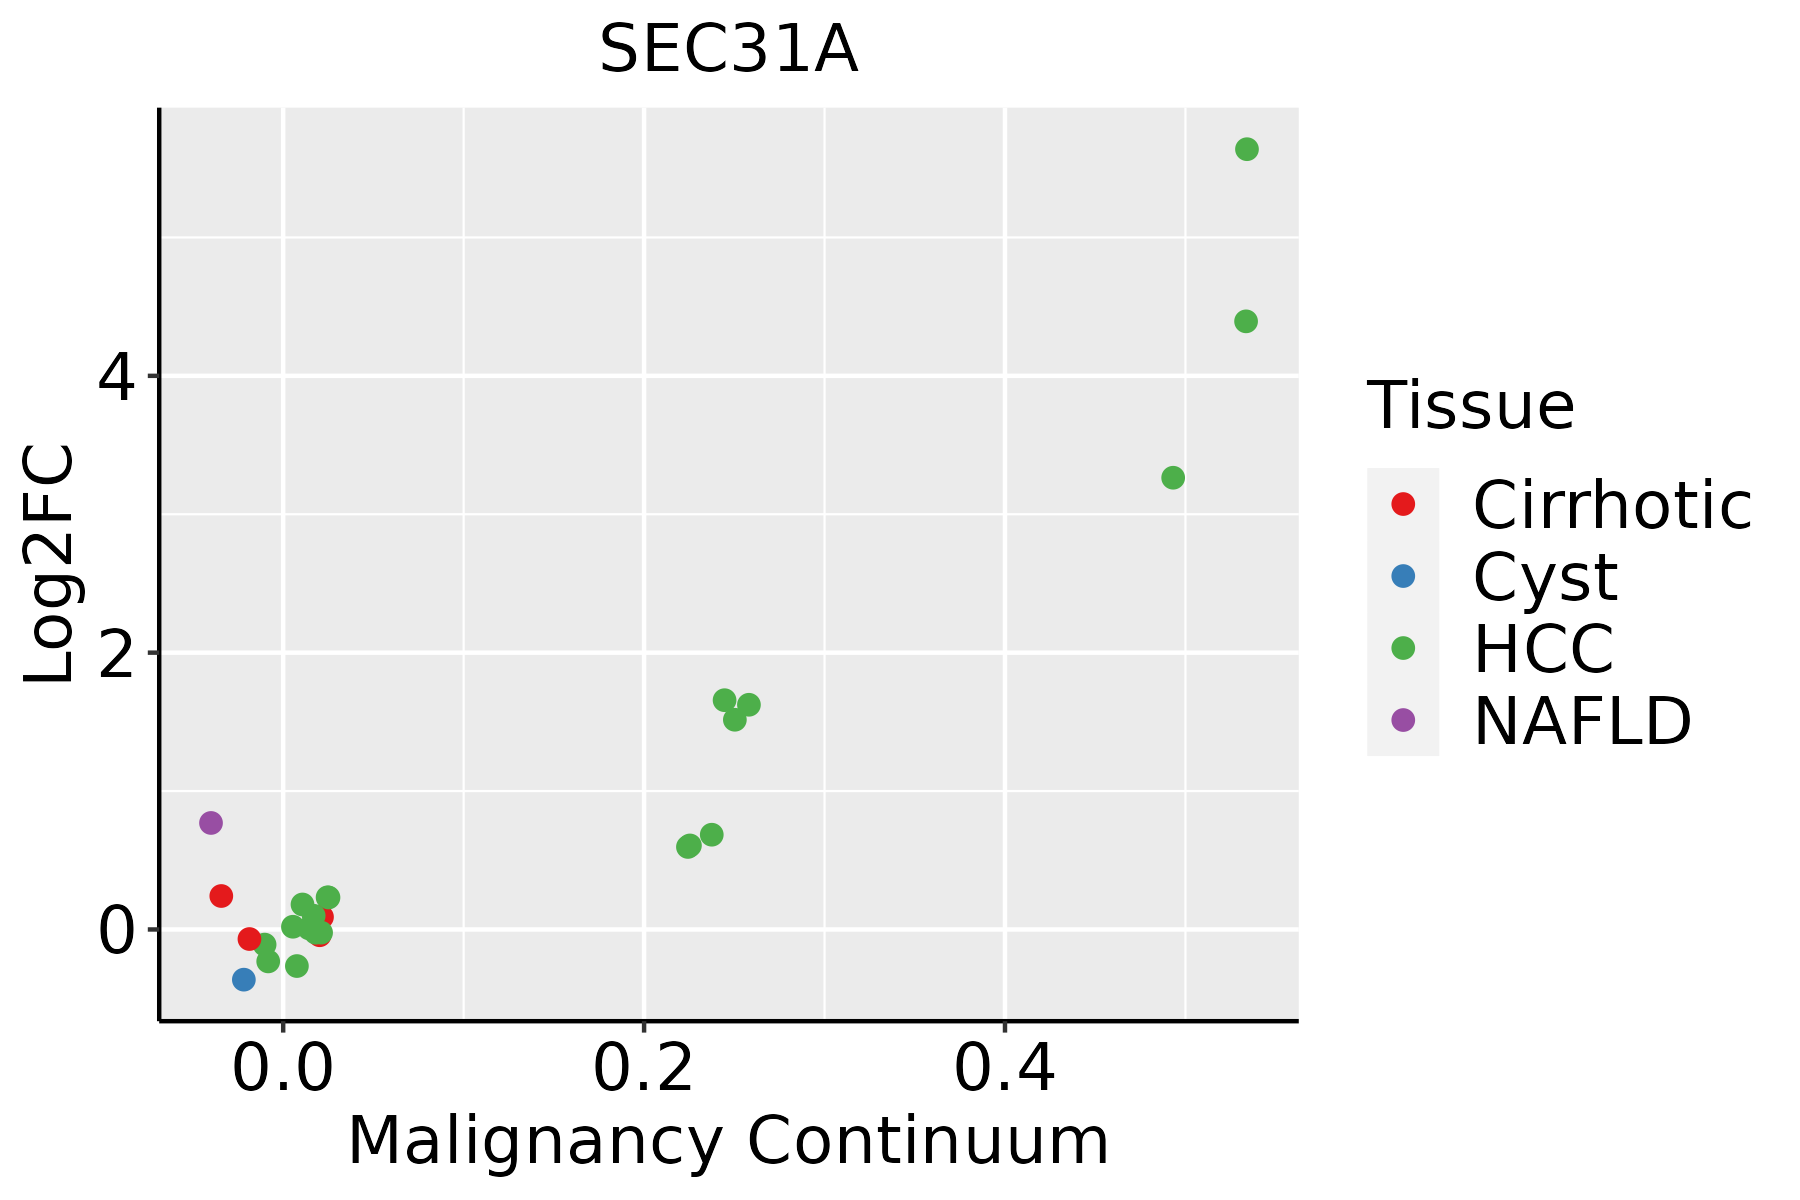 | HCC: Hepatocellular carcinoma |
| NAFLD: Non-alcoholic fatty liver disease | ||
| Lung | 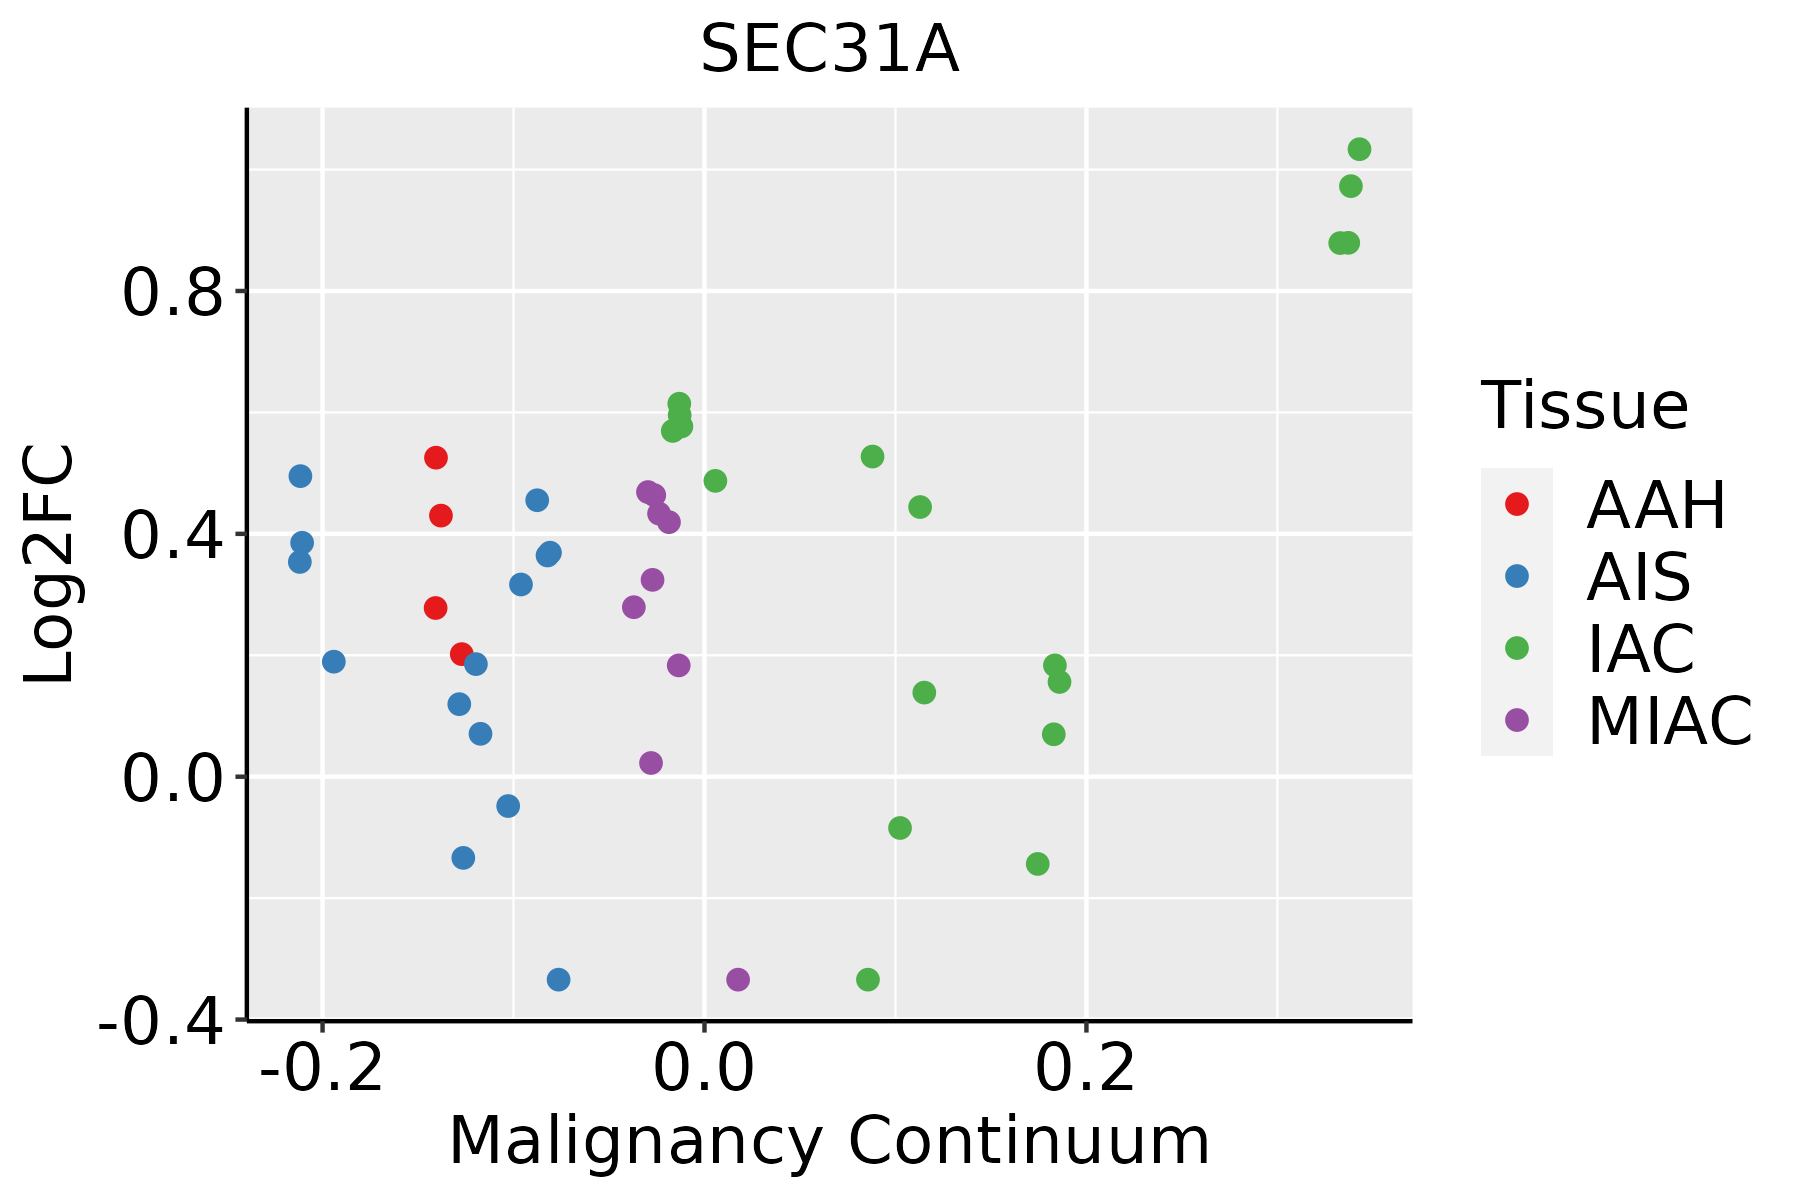 | AAH: Atypical adenomatous hyperplasia |
| AIS: Adenocarcinoma in situ | ||
| IAC: Invasive lung adenocarcinoma | ||
| MIA: Minimally invasive adenocarcinoma | ||
| Oral Cavity | 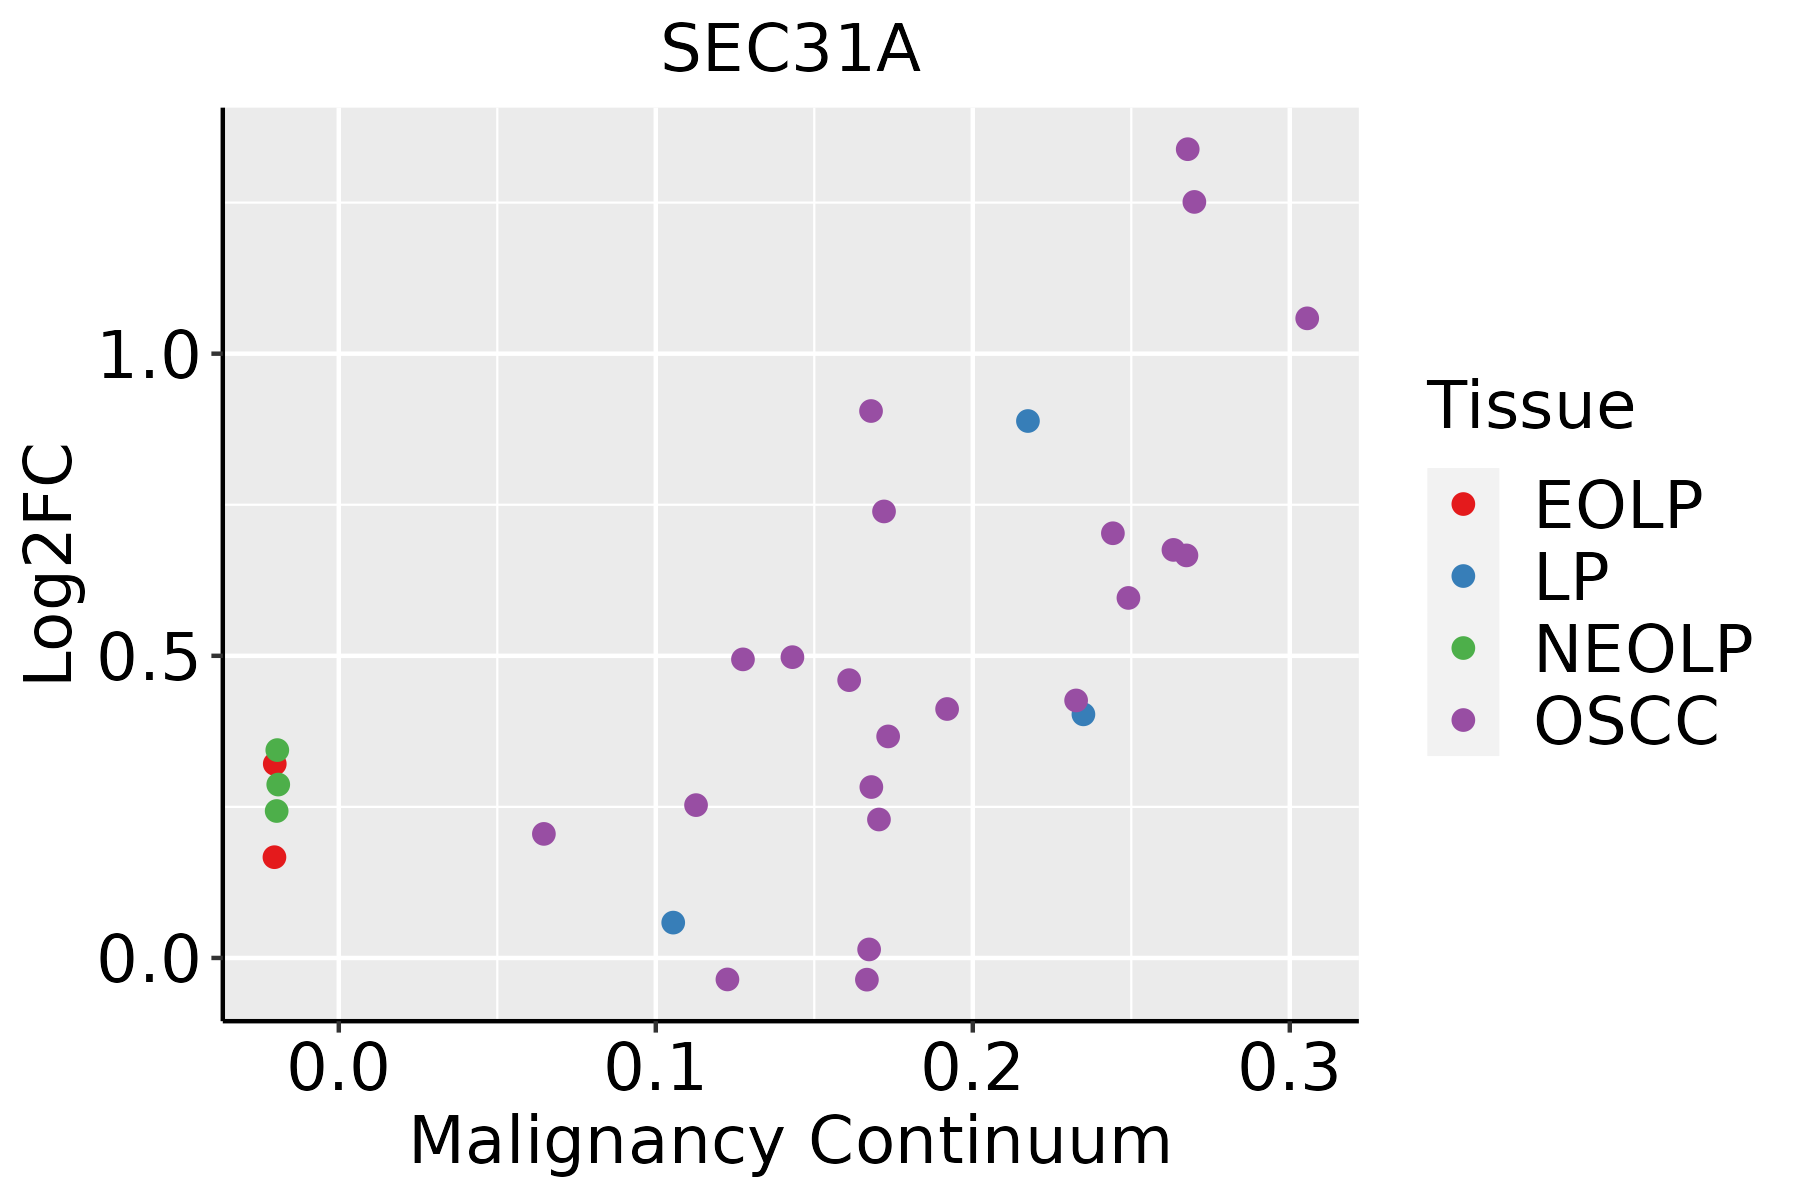 | EOLP: Erosive Oral lichen planus |
| LP: leukoplakia | ||
| NEOLP: Non-erosive oral lichen planus | ||
| OSCC: Oral squamous cell carcinoma | ||
| Prostate | 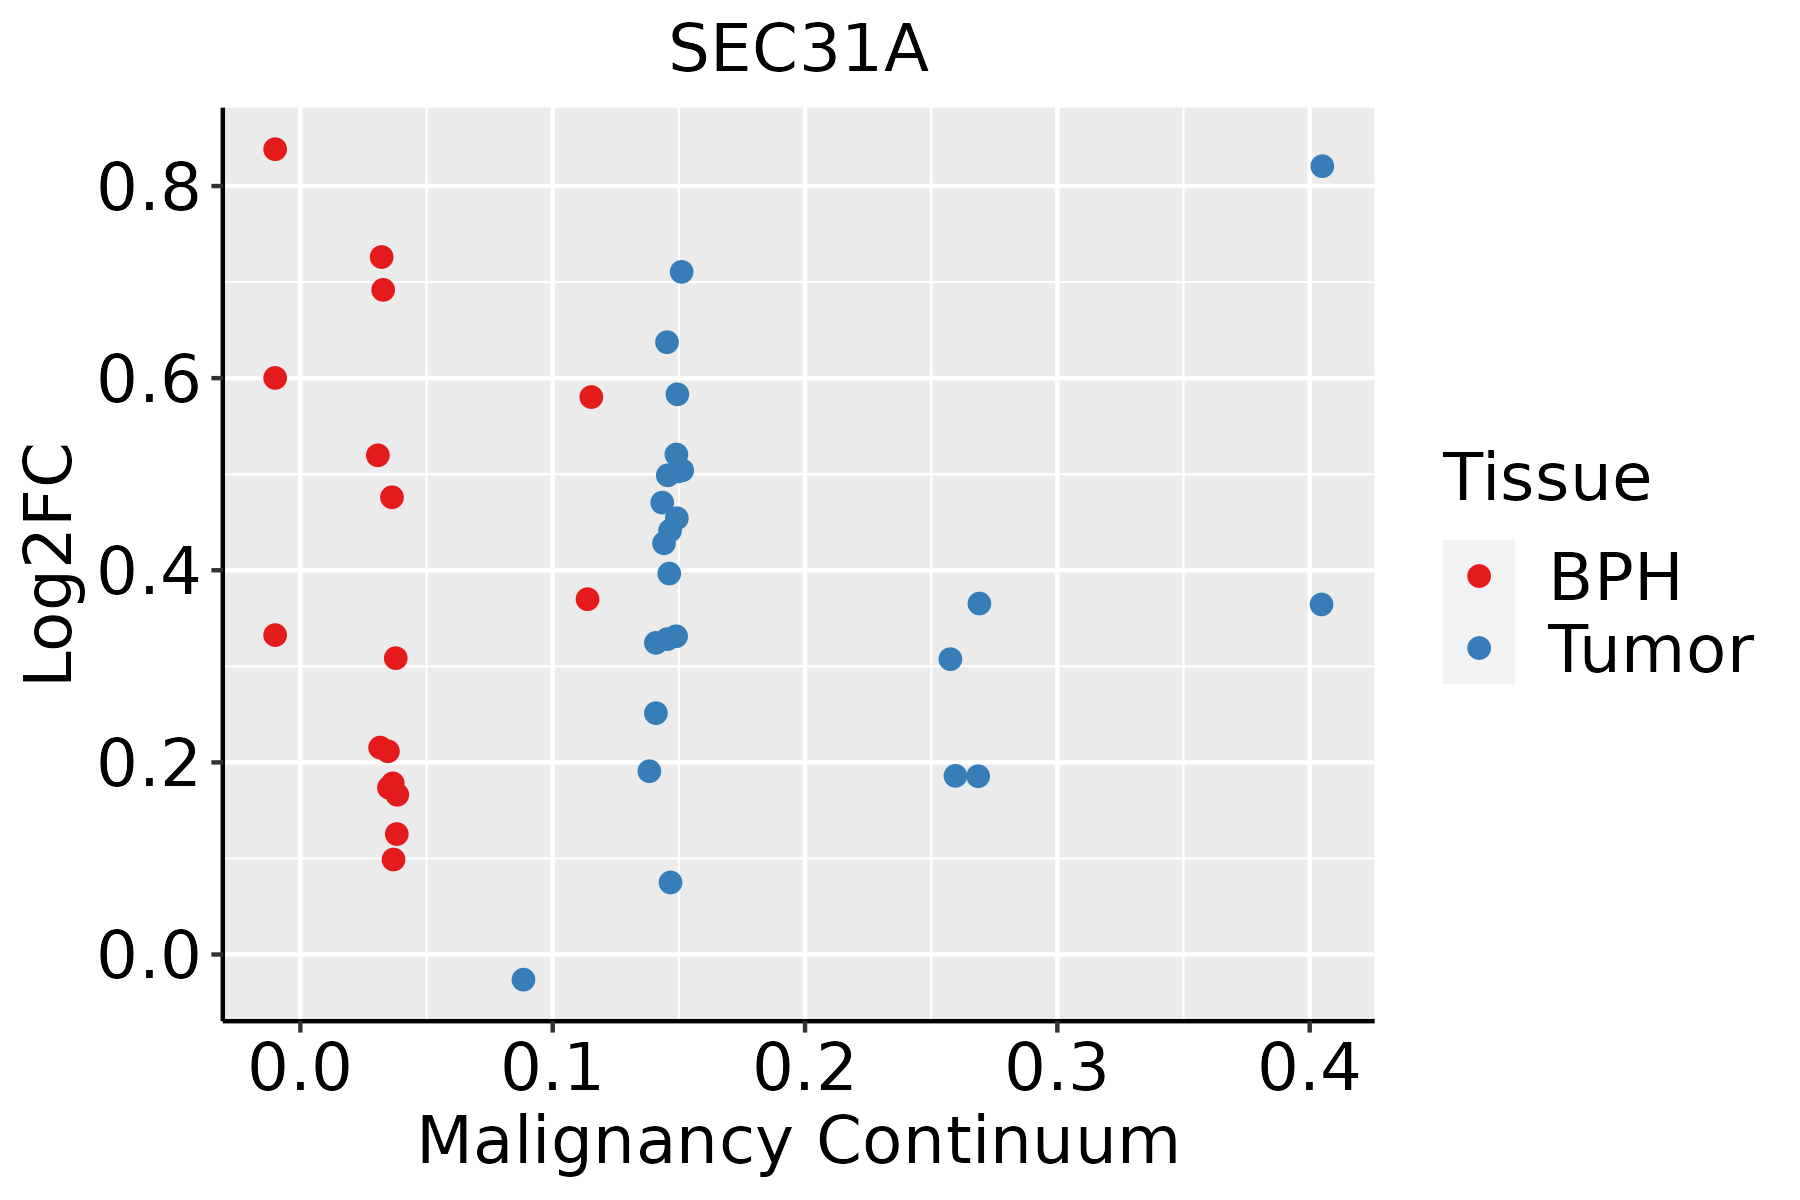 | BPH: Benign Prostatic Hyperplasia |
| Skin |  | AK: Actinic keratosis |
| cSCC: Cutaneous squamous cell carcinoma | ||
| SCCIS:squamous cell carcinoma in situ | ||
| Thyroid | 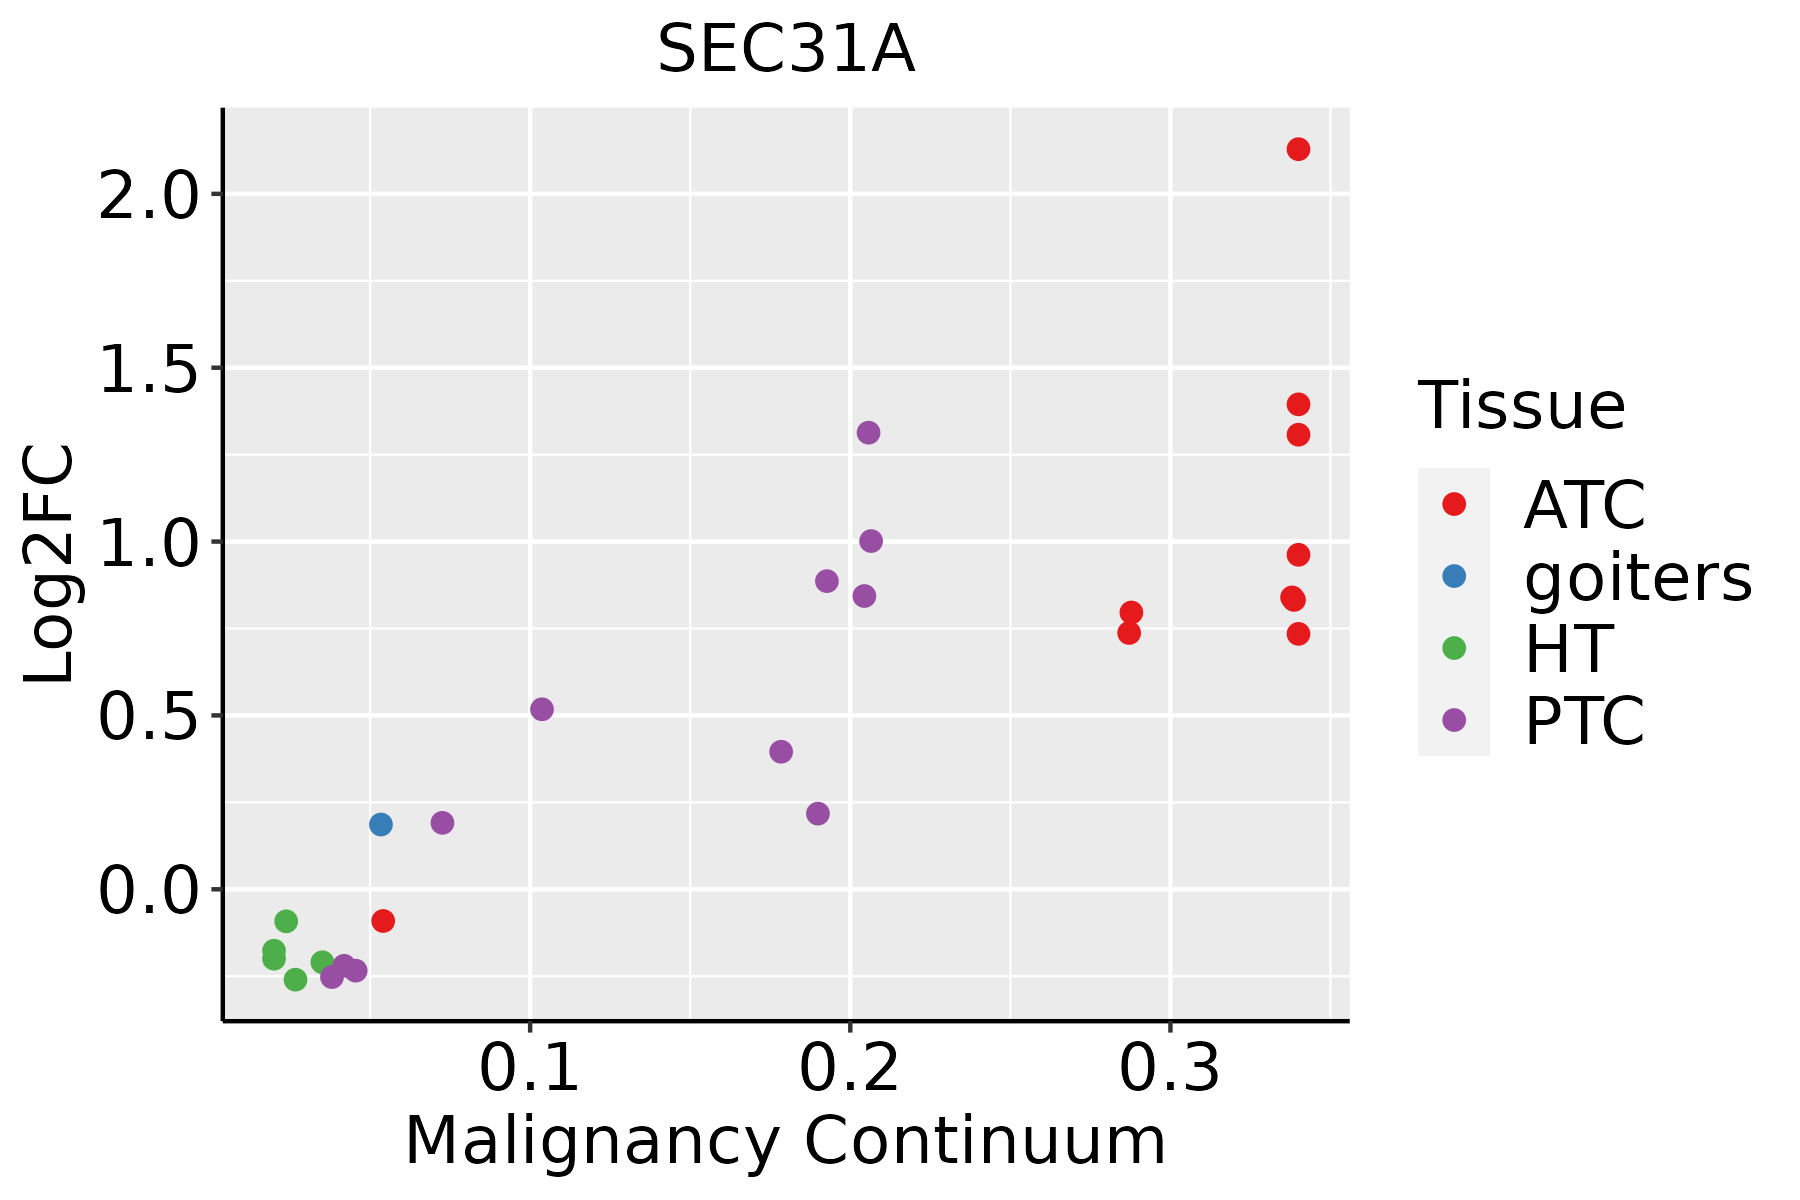 | ATC: Anaplastic thyroid cancer |
| HT: Hashimoto's thyroiditis | ||
| PTC: Papillary thyroid cancer |
| ∗log2FC in expression of this searched gene in stem-like cells from each diseased tissue sample relative to stem-like cells in normal samples in each tissue plotted against the malignancy continuum. Samples are colored based on if they are from different disease stage. |
Top |
Malignant transformation related pathway analysis |
| Find out the enriched GO biological processes and KEGG pathways involved in transition from healthy to precancer to cancer |
| Tissue | Disease Stage | Enriched GO biological Processes |
| Colorectum | AD |  |
| Colorectum | SER |  |
| Colorectum | MSS |  |
| Colorectum | MSI-H |  |
| Colorectum | FAP |  |
| ∗Top 15 enriched GO BP terms are showed in the bar plot of each disease state in each tissue. Each row represents a significant GO biological process which is colored according to the -log10(p.adjust). |
| Page: 1 2 3 4 5 6 7 8 9 |
| GO ID | Tissue | Disease Stage | Description | Gene Ratio | Bg Ratio | pvalue | p.adjust | Count |
| GO:000690010 | Cervix | CC | vesicle budding from membrane | 20/2311 | 61/18723 | 2.50e-05 | 4.28e-04 | 20 |
| GO:00481938 | Cervix | CC | Golgi vesicle transport | 58/2311 | 296/18723 | 2.24e-04 | 2.54e-03 | 58 |
| GO:001003810 | Cervix | CC | response to metal ion | 67/2311 | 373/18723 | 9.67e-04 | 8.10e-03 | 67 |
| GO:00515926 | Cervix | CC | response to calcium ion | 31/2311 | 149/18723 | 2.31e-03 | 1.65e-02 | 31 |
| GO:00160506 | Cervix | CC | vesicle organization | 54/2311 | 300/18723 | 2.71e-03 | 1.85e-02 | 54 |
| GO:0048193 | Colorectum | AD | Golgi vesicle transport | 109/3918 | 296/18723 | 1.80e-10 | 1.68e-08 | 109 |
| GO:0006900 | Colorectum | AD | vesicle budding from membrane | 32/3918 | 61/18723 | 5.38e-08 | 2.81e-06 | 32 |
| GO:0016050 | Colorectum | AD | vesicle organization | 101/3918 | 300/18723 | 1.65e-07 | 7.17e-06 | 101 |
| GO:0010038 | Colorectum | AD | response to metal ion | 106/3918 | 373/18723 | 3.22e-04 | 3.83e-03 | 106 |
| GO:0006888 | Colorectum | AD | endoplasmic reticulum to Golgi vesicle-mediated transport | 44/3918 | 130/18723 | 4.13e-04 | 4.68e-03 | 44 |
| GO:0007029 | Colorectum | AD | endoplasmic reticulum organization | 31/3918 | 87/18723 | 1.08e-03 | 1.00e-02 | 31 |
| GO:00481932 | Colorectum | MSS | Golgi vesicle transport | 101/3467 | 296/18723 | 9.09e-11 | 9.77e-09 | 101 |
| GO:00069002 | Colorectum | MSS | vesicle budding from membrane | 31/3467 | 61/18723 | 1.17e-08 | 7.06e-07 | 31 |
| GO:00160502 | Colorectum | MSS | vesicle organization | 93/3467 | 300/18723 | 1.04e-07 | 4.97e-06 | 93 |
| GO:00068882 | Colorectum | MSS | endoplasmic reticulum to Golgi vesicle-mediated transport | 44/3467 | 130/18723 | 2.17e-05 | 4.60e-04 | 44 |
| GO:0090114 | Colorectum | MSS | COPII-coated vesicle budding | 12/3467 | 29/18723 | 3.60e-03 | 2.66e-02 | 12 |
| GO:00100382 | Colorectum | MSS | response to metal ion | 90/3467 | 373/18723 | 3.76e-03 | 2.76e-02 | 90 |
| GO:0035459 | Colorectum | MSS | vesicle cargo loading | 11/3467 | 27/18723 | 6.03e-03 | 4.04e-02 | 11 |
| GO:00068883 | Colorectum | MSI-H | endoplasmic reticulum to Golgi vesicle-mediated transport | 22/1319 | 130/18723 | 1.05e-04 | 3.24e-03 | 22 |
| GO:00481933 | Colorectum | MSI-H | Golgi vesicle transport | 39/1319 | 296/18723 | 1.17e-04 | 3.51e-03 | 39 |
| Page: 1 2 3 4 5 6 7 8 |
| Pathway ID | Tissue | Disease Stage | Description | Gene Ratio | Bg Ratio | pvalue | p.adjust | qvalue | Count |
| hsa0414120 | Cervix | CC | Protein processing in endoplasmic reticulum | 55/1267 | 174/8465 | 1.74e-08 | 2.68e-07 | 1.58e-07 | 55 |
| hsa04141110 | Cervix | CC | Protein processing in endoplasmic reticulum | 55/1267 | 174/8465 | 1.74e-08 | 2.68e-07 | 1.58e-07 | 55 |
| hsa04141 | Colorectum | AD | Protein processing in endoplasmic reticulum | 80/2092 | 174/8465 | 5.96e-10 | 1.25e-08 | 7.96e-09 | 80 |
| hsa041411 | Colorectum | AD | Protein processing in endoplasmic reticulum | 80/2092 | 174/8465 | 5.96e-10 | 1.25e-08 | 7.96e-09 | 80 |
| hsa041414 | Colorectum | MSS | Protein processing in endoplasmic reticulum | 75/1875 | 174/8465 | 3.78e-10 | 8.44e-09 | 5.17e-09 | 75 |
| hsa041415 | Colorectum | MSS | Protein processing in endoplasmic reticulum | 75/1875 | 174/8465 | 3.78e-10 | 8.44e-09 | 5.17e-09 | 75 |
| hsa041416 | Colorectum | MSI-H | Protein processing in endoplasmic reticulum | 46/797 | 174/8465 | 4.53e-11 | 9.78e-10 | 8.19e-10 | 46 |
| hsa041417 | Colorectum | MSI-H | Protein processing in endoplasmic reticulum | 46/797 | 174/8465 | 4.53e-11 | 9.78e-10 | 8.19e-10 | 46 |
| hsa041418 | Colorectum | FAP | Protein processing in endoplasmic reticulum | 50/1404 | 174/8465 | 3.64e-05 | 3.68e-04 | 2.24e-04 | 50 |
| hsa041419 | Colorectum | FAP | Protein processing in endoplasmic reticulum | 50/1404 | 174/8465 | 3.64e-05 | 3.68e-04 | 2.24e-04 | 50 |
| hsa04141211 | Esophagus | ESCC | Protein processing in endoplasmic reticulum | 147/4205 | 174/8465 | 3.29e-22 | 1.10e-19 | 5.64e-20 | 147 |
| hsa04141310 | Esophagus | ESCC | Protein processing in endoplasmic reticulum | 147/4205 | 174/8465 | 3.29e-22 | 1.10e-19 | 5.64e-20 | 147 |
| hsa0414114 | Liver | Cirrhotic | Protein processing in endoplasmic reticulum | 114/2530 | 174/8465 | 1.16e-22 | 9.67e-21 | 5.96e-21 | 114 |
| hsa0414115 | Liver | Cirrhotic | Protein processing in endoplasmic reticulum | 114/2530 | 174/8465 | 1.16e-22 | 9.67e-21 | 5.96e-21 | 114 |
| hsa0414122 | Liver | HCC | Protein processing in endoplasmic reticulum | 146/4020 | 174/8465 | 7.34e-24 | 2.46e-21 | 1.37e-21 | 146 |
| hsa0414132 | Liver | HCC | Protein processing in endoplasmic reticulum | 146/4020 | 174/8465 | 7.34e-24 | 2.46e-21 | 1.37e-21 | 146 |
| hsa0414116 | Lung | IAC | Protein processing in endoplasmic reticulum | 37/1053 | 174/8465 | 6.53e-04 | 5.73e-03 | 3.81e-03 | 37 |
| hsa0414117 | Lung | IAC | Protein processing in endoplasmic reticulum | 37/1053 | 174/8465 | 6.53e-04 | 5.73e-03 | 3.81e-03 | 37 |
| hsa0414123 | Lung | AIS | Protein processing in endoplasmic reticulum | 35/961 | 174/8465 | 4.88e-04 | 4.39e-03 | 2.81e-03 | 35 |
| hsa0414133 | Lung | AIS | Protein processing in endoplasmic reticulum | 35/961 | 174/8465 | 4.88e-04 | 4.39e-03 | 2.81e-03 | 35 |
| Page: 1 2 |
Top |
Cell-cell communication analysis |
| Identification of potential cell-cell interactions between two cell types and their ligand-receptor pairs for different disease states |
| Ligand | Receptor | LRpair | Pathway | Tissue | Disease Stage |
| Page: 1 |
Top |
Single-cell gene regulatory network inference analysis |
| Find out the significant the regulons (TFs) and the target genes of each regulon across cell types for different disease states |
| TF | Cell Type | Tissue | Disease Stage | Target Gene | RSS | Regulon Activity |
| ∗The dot plots of a searched regulon are shown for all cell subpopulations in each disease state of each tissue based on the regulon specific score inferred using pySCENIC and by calculating the average expression. |
| Page: 1 |
Top |
Somatic mutation of malignant transformation related genes |
| Annotation of somatic variants for genes involved in malignant transformation |
| Hugo Symbol | Variant Class | Variant Classification | dbSNP RS | HGVSc | HGVSp | HGVSp Short | SWISSPROT | BIOTYPE | SIFT | PolyPhen | Tumor Sample Barcode | Tissue | Histology | Sex | Age | Stage | Therapy Types | Drugs | Outcome |
| SEC31A | SNV | Missense_Mutation | novel | c.1301C>A | p.Thr434Lys | p.T434K | O94979 | protein_coding | deleterious(0) | probably_damaging(0.969) | TCGA-A2-A0EV-01 | Breast | breast invasive carcinoma | Female | >=65 | I/II | Unknown | Unknown | SD |
| SEC31A | SNV | Missense_Mutation | c.740G>T | p.Arg247Leu | p.R247L | O94979 | protein_coding | deleterious(0) | possibly_damaging(0.895) | TCGA-A8-A07U-01 | Breast | breast invasive carcinoma | Female | >=65 | III/IV | Chemotherapy | 5-fluorouracil | SD | |
| SEC31A | SNV | Missense_Mutation | c.1596C>A | p.Ser532Arg | p.S532R | O94979 | protein_coding | tolerated(0.4) | benign(0.006) | TCGA-A8-A08L-01 | Breast | breast invasive carcinoma | Female | >=65 | III/IV | Unknown | Unknown | SD | |
| SEC31A | SNV | Missense_Mutation | c.130G>C | p.Glu44Gln | p.E44Q | O94979 | protein_coding | deleterious(0.02) | probably_damaging(0.964) | TCGA-AN-A0FL-01 | Breast | breast invasive carcinoma | Female | <65 | I/II | Unknown | Unknown | SD | |
| SEC31A | SNV | Missense_Mutation | novel | c.3134C>T | p.Pro1045Leu | p.P1045L | O94979 | protein_coding | deleterious(0) | benign(0.231) | TCGA-AR-A0U0-01 | Breast | breast invasive carcinoma | Female | >=65 | I/II | Unknown | Unknown | SD |
| SEC31A | SNV | Missense_Mutation | c.554N>T | p.Ala185Val | p.A185V | O94979 | protein_coding | deleterious(0) | probably_damaging(0.994) | TCGA-BH-A0AZ-01 | Breast | breast invasive carcinoma | Female | <65 | III/IV | Chemotherapy | doxorubicin | CR | |
| SEC31A | SNV | Missense_Mutation | c.740N>T | p.Arg247Leu | p.R247L | O94979 | protein_coding | deleterious(0) | possibly_damaging(0.895) | TCGA-BH-A0B4-01 | Breast | breast invasive carcinoma | Male | >=65 | III/IV | Hormone Therapy | tamoxiphen | SD | |
| SEC31A | SNV | Missense_Mutation | novel | c.1663N>T | p.Pro555Ser | p.P555S | O94979 | protein_coding | deleterious(0.03) | benign(0) | TCGA-Z7-A8R6-01 | Breast | breast invasive carcinoma | Female | <65 | I/II | Chemotherapy | taxol | CR |
| SEC31A | deletion | In_Frame_Del | novel | c.2228_2230delGAG | p.Gly743del | p.G743del | O94979 | protein_coding | TCGA-A7-A6VX-01 | Breast | breast invasive carcinoma | Female | >=65 | I/II | Chemotherapy | docetaxel | CR | ||
| SEC31A | insertion | Nonsense_Mutation | novel | c.3413_3414insTTCTGATAAATGTGTTTTTTAAAACCTC | p.Gln1138HisfsTer8 | p.Q1138Hfs*8 | O94979 | protein_coding | TCGA-AN-A0G0-01 | Breast | breast invasive carcinoma | Female | <65 | I/II | Unknown | Unknown | SD |
| Page: 1 2 3 4 5 6 7 8 9 10 11 12 13 |
Top |
Related drugs of malignant transformation related genes |
| Identification of chemicals and drugs interact with genes involved in malignant transfromation |
| (DGIdb 4.0) |
| Entrez ID | Symbol | Category | Interaction Types | Drug Claim Name | Drug Name | PMIDs |
| Page: 1 |

Copyright 2023-Present -The University of Texas Health Science Center at Houston |