| Tissue | Expression Dynamics | Abbreviation |
| Esophagus |  | ESCC: Esophageal squamous cell carcinoma |
| HGIN: High-grade intraepithelial neoplasias |
| LGIN: Low-grade intraepithelial neoplasias |
| Liver |  | HCC: Hepatocellular carcinoma |
| NAFLD: Non-alcoholic fatty liver disease |
| Lung |  | AAH: Atypical adenomatous hyperplasia |
| AIS: Adenocarcinoma in situ |
| IAC: Invasive lung adenocarcinoma |
| MIA: Minimally invasive adenocarcinoma |
| Oral Cavity | 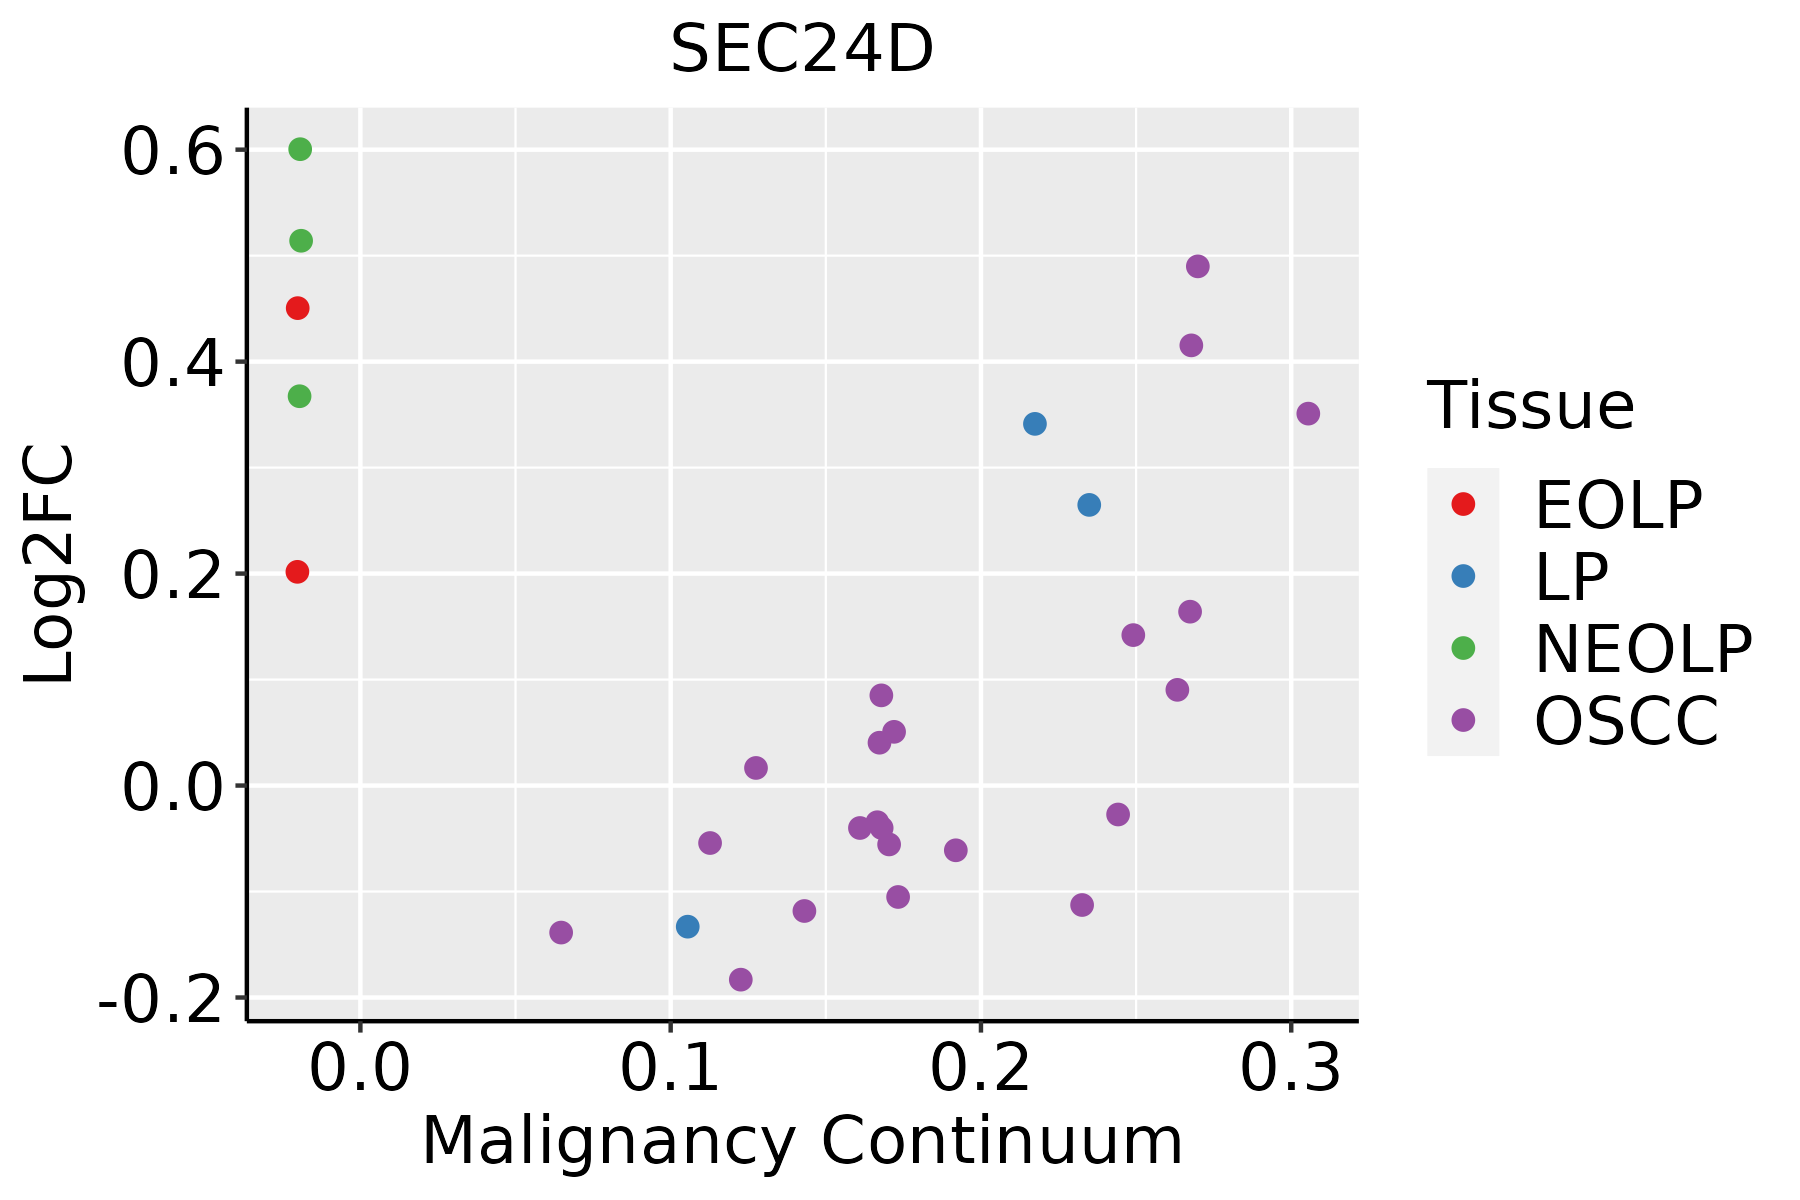 | EOLP: Erosive Oral lichen planus |
| LP: leukoplakia |
| NEOLP: Non-erosive oral lichen planus |
| OSCC: Oral squamous cell carcinoma |
| Prostate | 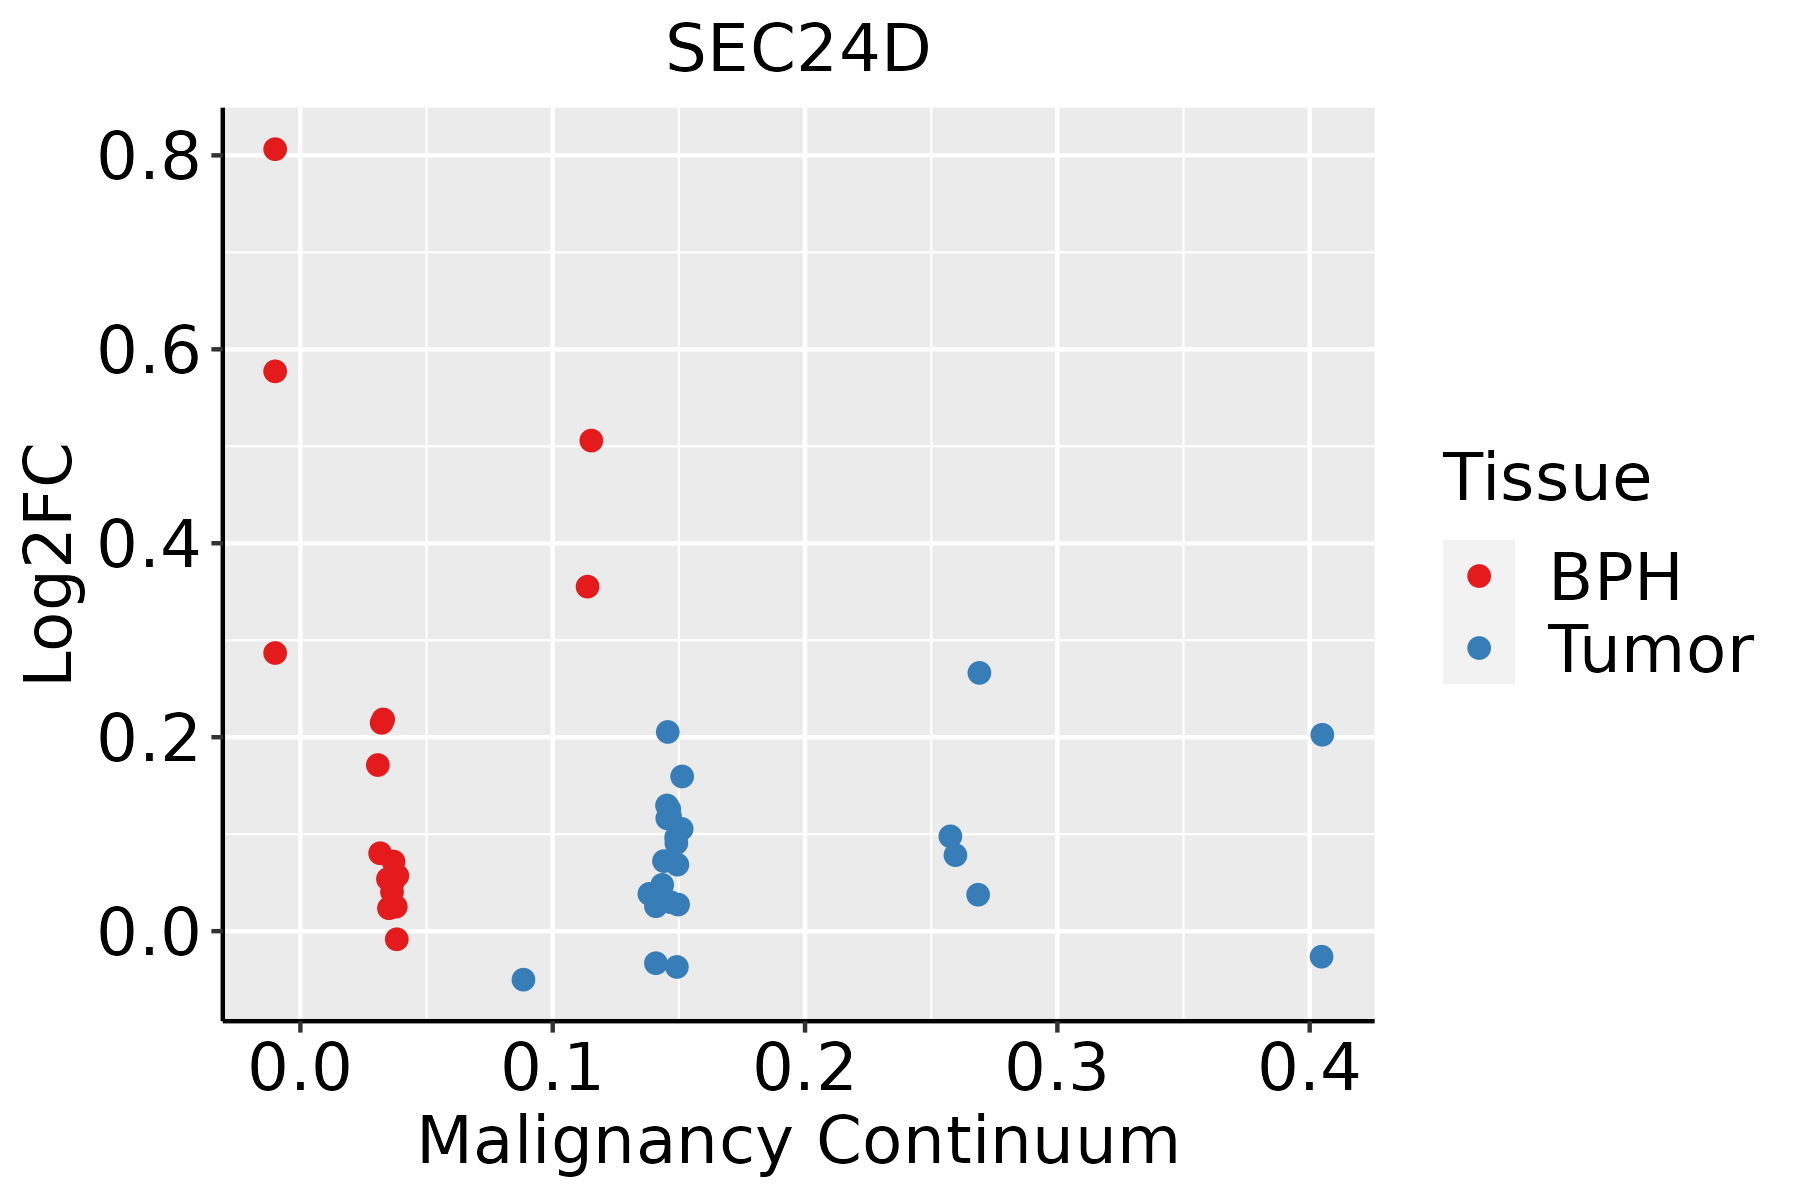 | BPH: Benign Prostatic Hyperplasia |
| Thyroid | 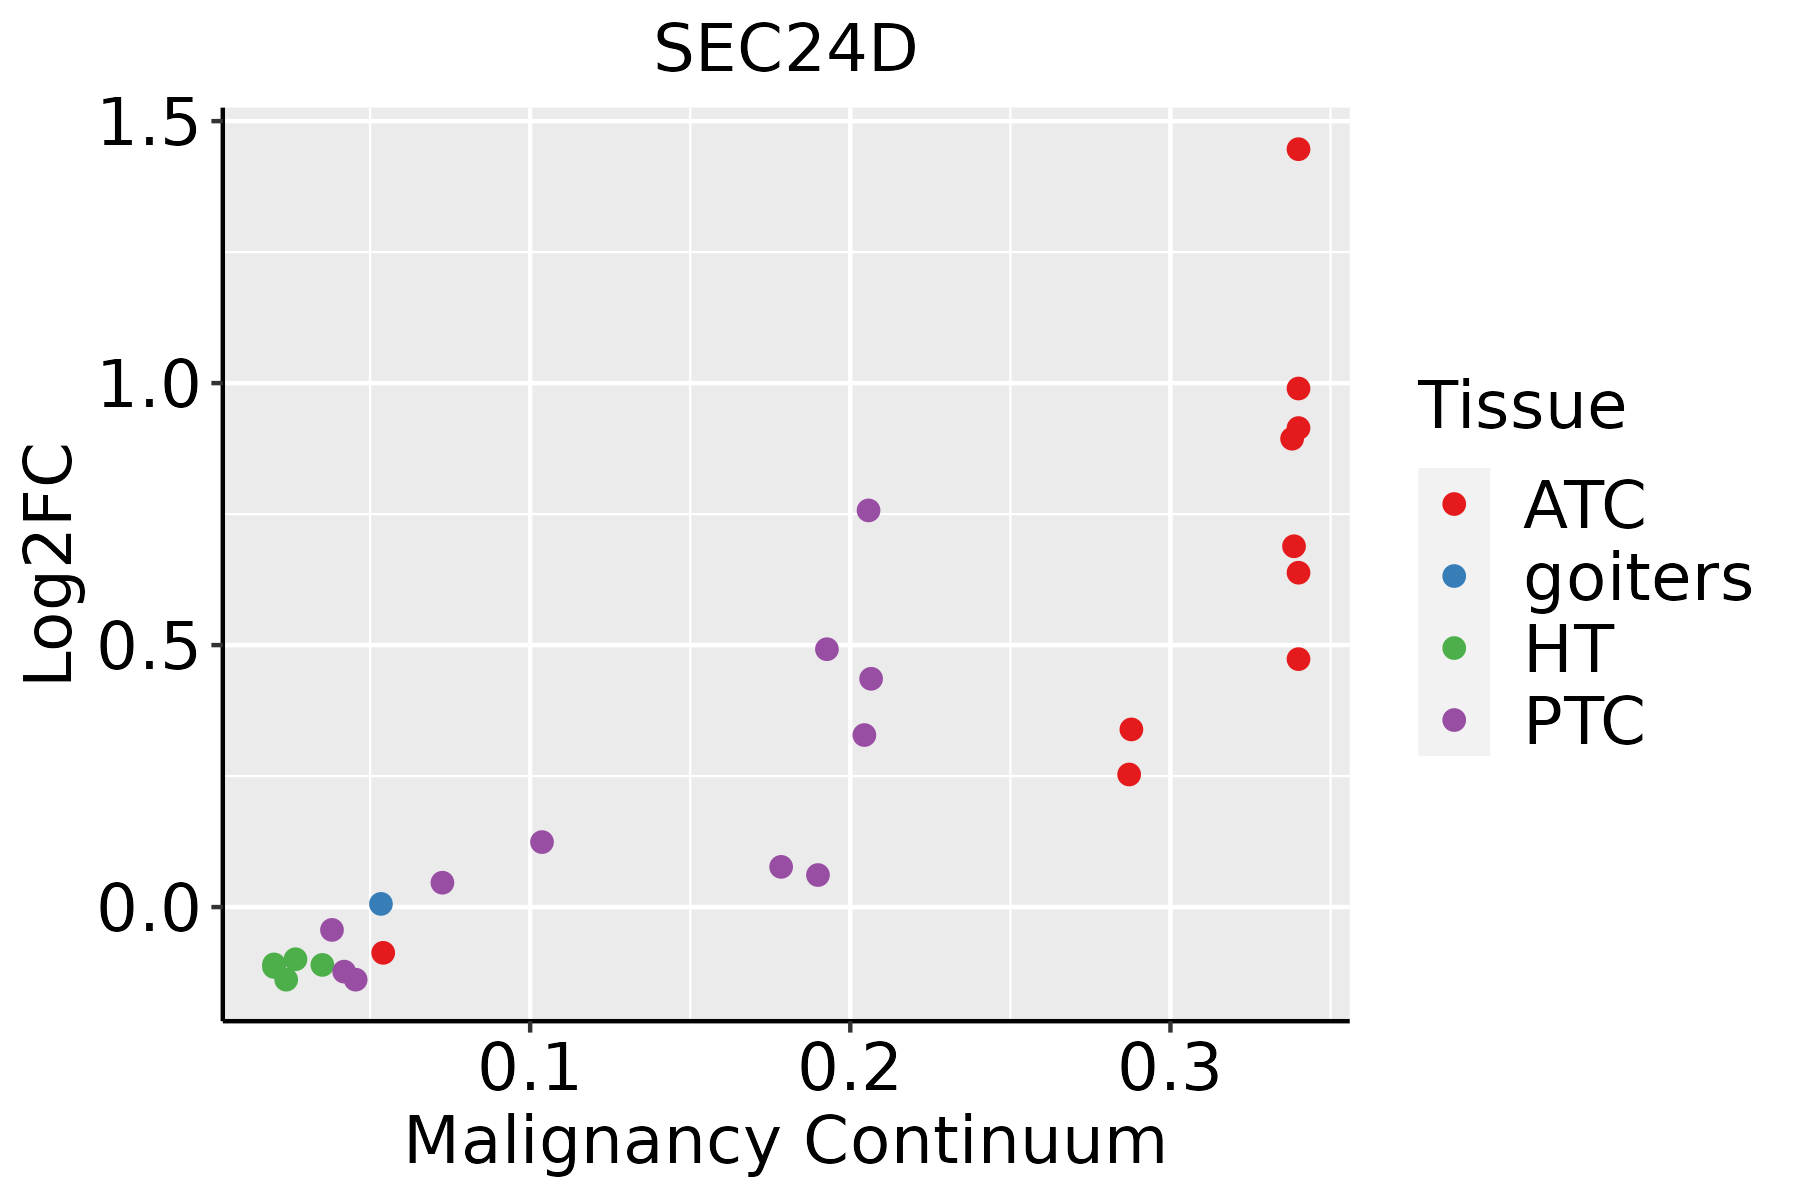 | ATC: Anaplastic thyroid cancer |
| HT: Hashimoto's thyroiditis |
| PTC: Papillary thyroid cancer |
| GO ID | Tissue | Disease Stage | Description | Gene Ratio | Bg Ratio | pvalue | p.adjust | Count |
| GO:004819317 | Esophagus | HGIN | Golgi vesicle transport | 83/2587 | 296/18723 | 8.59e-11 | 8.89e-09 | 83 |
| GO:00068889 | Esophagus | HGIN | endoplasmic reticulum to Golgi vesicle-mediated transport | 40/2587 | 130/18723 | 4.67e-07 | 2.07e-05 | 40 |
| GO:000690020 | Esophagus | HGIN | vesicle budding from membrane | 23/2587 | 61/18723 | 2.85e-06 | 9.93e-05 | 23 |
| GO:000170118 | Esophagus | HGIN | in utero embryonic development | 77/2587 | 367/18723 | 9.56e-05 | 2.05e-03 | 77 |
| GO:00160509 | Esophagus | HGIN | vesicle organization | 65/2587 | 300/18723 | 1.24e-04 | 2.54e-03 | 65 |
| GO:00901146 | Esophagus | HGIN | COPII-coated vesicle budding | 11/2587 | 29/18723 | 1.08e-03 | 1.32e-02 | 11 |
| GO:004819318 | Esophagus | ESCC | Golgi vesicle transport | 231/8552 | 296/18723 | 1.82e-30 | 9.63e-28 | 231 |
| GO:001605014 | Esophagus | ESCC | vesicle organization | 211/8552 | 300/18723 | 2.85e-18 | 2.87e-16 | 211 |
| GO:000170119 | Esophagus | ESCC | in utero embryonic development | 243/8552 | 367/18723 | 1.00e-15 | 6.86e-14 | 243 |
| GO:000688815 | Esophagus | ESCC | endoplasmic reticulum to Golgi vesicle-mediated transport | 102/8552 | 130/18723 | 1.73e-14 | 9.22e-13 | 102 |
| GO:0006900111 | Esophagus | ESCC | vesicle budding from membrane | 54/8552 | 61/18723 | 2.66e-12 | 1.07e-10 | 54 |
| GO:009011414 | Esophagus | ESCC | COPII-coated vesicle budding | 27/8552 | 29/18723 | 8.09e-08 | 1.39e-06 | 27 |
| GO:00901104 | Esophagus | ESCC | COPII-coated vesicle cargo loading | 14/8552 | 15/18723 | 1.47e-04 | 9.85e-04 | 14 |
| GO:00354595 | Esophagus | ESCC | vesicle cargo loading | 19/8552 | 27/18723 | 8.35e-03 | 2.95e-02 | 19 |
| GO:00481936 | Liver | NAFLD | Golgi vesicle transport | 66/1882 | 296/18723 | 3.66e-10 | 9.30e-08 | 66 |
| GO:00069007 | Liver | NAFLD | vesicle budding from membrane | 17/1882 | 61/18723 | 7.31e-05 | 1.52e-03 | 17 |
| GO:00354593 | Liver | NAFLD | vesicle cargo loading | 10/1882 | 27/18723 | 1.74e-04 | 3.08e-03 | 10 |
| GO:00160505 | Liver | NAFLD | vesicle organization | 50/1882 | 300/18723 | 2.42e-04 | 4.06e-03 | 50 |
| GO:0090110 | Liver | NAFLD | COPII-coated vesicle cargo loading | 7/1882 | 15/18723 | 3.18e-04 | 4.95e-03 | 7 |
| GO:00901143 | Liver | NAFLD | COPII-coated vesicle budding | 10/1882 | 29/18723 | 3.42e-04 | 5.22e-03 | 10 |
| Pathway ID | Tissue | Disease Stage | Description | Gene Ratio | Bg Ratio | pvalue | p.adjust | qvalue | Count |
| hsa0414139 | Esophagus | HGIN | Protein processing in endoplasmic reticulum | 67/1383 | 174/8465 | 1.06e-12 | 2.16e-11 | 1.72e-11 | 67 |
| hsa0513039 | Esophagus | HGIN | Pathogenic Escherichia coli infection | 54/1383 | 197/8465 | 4.91e-05 | 6.15e-04 | 4.89e-04 | 54 |
| hsa04141114 | Esophagus | HGIN | Protein processing in endoplasmic reticulum | 67/1383 | 174/8465 | 1.06e-12 | 2.16e-11 | 1.72e-11 | 67 |
| hsa05130115 | Esophagus | HGIN | Pathogenic Escherichia coli infection | 54/1383 | 197/8465 | 4.91e-05 | 6.15e-04 | 4.89e-04 | 54 |
| hsa04141211 | Esophagus | ESCC | Protein processing in endoplasmic reticulum | 147/4205 | 174/8465 | 3.29e-22 | 1.10e-19 | 5.64e-20 | 147 |
| hsa05130211 | Esophagus | ESCC | Pathogenic Escherichia coli infection | 142/4205 | 197/8465 | 8.21e-11 | 1.06e-09 | 5.42e-10 | 142 |
| hsa04141310 | Esophagus | ESCC | Protein processing in endoplasmic reticulum | 147/4205 | 174/8465 | 3.29e-22 | 1.10e-19 | 5.64e-20 | 147 |
| hsa05130310 | Esophagus | ESCC | Pathogenic Escherichia coli infection | 142/4205 | 197/8465 | 8.21e-11 | 1.06e-09 | 5.42e-10 | 142 |
| hsa0513014 | Liver | NAFLD | Pathogenic Escherichia coli infection | 45/1043 | 197/8465 | 2.31e-05 | 6.88e-04 | 5.54e-04 | 45 |
| hsa0513015 | Liver | NAFLD | Pathogenic Escherichia coli infection | 45/1043 | 197/8465 | 2.31e-05 | 6.88e-04 | 5.54e-04 | 45 |
| hsa0414122 | Liver | HCC | Protein processing in endoplasmic reticulum | 146/4020 | 174/8465 | 7.34e-24 | 2.46e-21 | 1.37e-21 | 146 |
| hsa0513042 | Liver | HCC | Pathogenic Escherichia coli infection | 129/4020 | 197/8465 | 2.02e-07 | 2.50e-06 | 1.39e-06 | 129 |
| hsa0414132 | Liver | HCC | Protein processing in endoplasmic reticulum | 146/4020 | 174/8465 | 7.34e-24 | 2.46e-21 | 1.37e-21 | 146 |
| hsa0513052 | Liver | HCC | Pathogenic Escherichia coli infection | 129/4020 | 197/8465 | 2.02e-07 | 2.50e-06 | 1.39e-06 | 129 |
| hsa0513016 | Lung | IAC | Pathogenic Escherichia coli infection | 45/1053 | 197/8465 | 2.93e-05 | 6.14e-04 | 4.08e-04 | 45 |
| hsa0414116 | Lung | IAC | Protein processing in endoplasmic reticulum | 37/1053 | 174/8465 | 6.53e-04 | 5.73e-03 | 3.81e-03 | 37 |
| hsa0513017 | Lung | IAC | Pathogenic Escherichia coli infection | 45/1053 | 197/8465 | 2.93e-05 | 6.14e-04 | 4.08e-04 | 45 |
| hsa0414117 | Lung | IAC | Protein processing in endoplasmic reticulum | 37/1053 | 174/8465 | 6.53e-04 | 5.73e-03 | 3.81e-03 | 37 |
| hsa0513023 | Lung | AIS | Pathogenic Escherichia coli infection | 42/961 | 197/8465 | 3.43e-05 | 5.62e-04 | 3.59e-04 | 42 |
| hsa0414123 | Lung | AIS | Protein processing in endoplasmic reticulum | 35/961 | 174/8465 | 4.88e-04 | 4.39e-03 | 2.81e-03 | 35 |
| Hugo Symbol | Variant Class | Variant Classification | dbSNP RS | HGVSc | HGVSp | HGVSp Short | SWISSPROT | BIOTYPE | SIFT | PolyPhen | Tumor Sample Barcode | Tissue | Histology | Sex | Age | Stage | Therapy Types | Drugs | Outcome |
| SEC24D | SNV | Missense_Mutation | | c.2642N>T | p.Ser881Phe | p.S881F | O94855 | protein_coding | deleterious(0) | probably_damaging(0.996) | TCGA-A2-A0CX-01 | Breast | breast invasive carcinoma | Female | <65 | I/II | Chemotherapy | adriamycin | SD |
| SEC24D | SNV | Missense_Mutation | novel | c.130N>A | p.Pro44Thr | p.P44T | O94855 | protein_coding | tolerated_low_confidence(0.12) | benign(0.007) | TCGA-AC-A8OR-01 | Breast | breast invasive carcinoma | Female | >=65 | I/II | Unknown | Unknown | SD |
| SEC24D | SNV | Missense_Mutation | rs151309585 | c.2143G>A | p.Asp715Asn | p.D715N | O94855 | protein_coding | deleterious(0) | probably_damaging(0.994) | TCGA-AN-A046-01 | Breast | breast invasive carcinoma | Female | >=65 | I/II | Unknown | Unknown | SD |
| SEC24D | SNV | Missense_Mutation | novel | c.1472N>G | p.Asn491Ser | p.N491S | O94855 | protein_coding | tolerated(0.17) | benign(0.25) | TCGA-AN-A0AJ-01 | Breast | breast invasive carcinoma | Female | >=65 | I/II | Unknown | Unknown | SD |
| SEC24D | SNV | Missense_Mutation | | c.1163N>C | p.Cys388Ser | p.C388S | O94855 | protein_coding | deleterious(0) | probably_damaging(1) | TCGA-AR-A0TP-01 | Breast | breast invasive carcinoma | Female | <65 | I/II | Chemotherapy | doxorubicin | SD |
| SEC24D | SNV | Missense_Mutation | novel | c.2881N>A | p.Glu961Lys | p.E961K | O94855 | protein_coding | tolerated(0.78) | benign(0.218) | TCGA-BH-A0B6-01 | Breast | breast invasive carcinoma | Female | <65 | I/II | Unknown | Unknown | SD |
| SEC24D | SNV | Missense_Mutation | | c.168N>A | p.Met56Ile | p.M56I | O94855 | protein_coding | tolerated_low_confidence(0.39) | benign(0) | TCGA-BH-A0HA-01 | Breast | breast invasive carcinoma | Female | <65 | I/II | Unknown | Unknown | SD |
| SEC24D | SNV | Missense_Mutation | | c.2203N>A | p.Asp735Asn | p.D735N | O94855 | protein_coding | deleterious(0) | probably_damaging(1) | TCGA-BH-A0HF-01 | Breast | breast invasive carcinoma | Female | >=65 | I/II | Hormone Therapy | arimidex | SD |
| SEC24D | SNV | Missense_Mutation | | c.1011N>G | p.Ile337Met | p.I337M | O94855 | protein_coding | deleterious(0) | possibly_damaging(0.579) | TCGA-BH-A1EY-01 | Breast | breast invasive carcinoma | Female | >=65 | I/II | Unknown | Unknown | PD |
| SEC24D | deletion | Frame_Shift_Del | novel | c.2932delN | p.Gln978AsnfsTer8 | p.Q978Nfs*8 | O94855 | protein_coding | | | TCGA-D8-A27V-01 | Breast | breast invasive carcinoma | Female | <65 | I/II | Hormone Therapy | tamoxiphen | SD |


