
|
|||||
|
 | |
| |
| |
| |
| |
| |
|
Gene: SEC23IP |
Gene summary for SEC23IP |
| Gene information | Species | Human | Gene symbol | SEC23IP | Gene ID | 11196 |
| Gene name | SEC23 interacting protein | |
| Gene Alias | MSTP053 | |
| Cytomap | 10q26.11-q26.12 | |
| Gene Type | protein-coding | GO ID | GO:0006810 | UniProtAcc | Q9Y6Y8 |
Top |
Malignant transformation analysis |
| Identification of the aberrant gene expression in precancerous and cancerous lesions by comparing the gene expression of stem-like cells in diseased tissues with normal stem cells |
| Entrez ID | Symbol | Replicates | Species | Organ | Tissue | Adj P-value | Log2FC | Malignancy |
| 11196 | SEC23IP | LZE4T | Human | Esophagus | ESCC | 9.74e-06 | 1.39e-01 | 0.0811 |
| 11196 | SEC23IP | LZE7T | Human | Esophagus | ESCC | 6.49e-04 | 1.86e-01 | 0.0667 |
| 11196 | SEC23IP | LZE20T | Human | Esophagus | ESCC | 2.36e-02 | 1.45e-01 | 0.0662 |
| 11196 | SEC23IP | LZE24T | Human | Esophagus | ESCC | 1.96e-13 | 4.65e-01 | 0.0596 |
| 11196 | SEC23IP | P2T-E | Human | Esophagus | ESCC | 3.57e-15 | 2.50e-01 | 0.1177 |
| 11196 | SEC23IP | P4T-E | Human | Esophagus | ESCC | 7.27e-21 | 4.12e-01 | 0.1323 |
| 11196 | SEC23IP | P5T-E | Human | Esophagus | ESCC | 4.26e-16 | 1.89e-01 | 0.1327 |
| 11196 | SEC23IP | P8T-E | Human | Esophagus | ESCC | 1.23e-21 | 3.51e-01 | 0.0889 |
| 11196 | SEC23IP | P9T-E | Human | Esophagus | ESCC | 3.83e-06 | 1.12e-01 | 0.1131 |
| 11196 | SEC23IP | P10T-E | Human | Esophagus | ESCC | 5.71e-19 | 1.19e-01 | 0.116 |
| 11196 | SEC23IP | P11T-E | Human | Esophagus | ESCC | 4.48e-10 | 5.33e-01 | 0.1426 |
| 11196 | SEC23IP | P12T-E | Human | Esophagus | ESCC | 8.87e-21 | 3.97e-01 | 0.1122 |
| 11196 | SEC23IP | P15T-E | Human | Esophagus | ESCC | 1.47e-17 | 3.66e-01 | 0.1149 |
| 11196 | SEC23IP | P16T-E | Human | Esophagus | ESCC | 9.47e-30 | 4.25e-01 | 0.1153 |
| 11196 | SEC23IP | P19T-E | Human | Esophagus | ESCC | 1.53e-02 | 2.51e-01 | 0.1662 |
| 11196 | SEC23IP | P20T-E | Human | Esophagus | ESCC | 7.45e-12 | 1.99e-01 | 0.1124 |
| 11196 | SEC23IP | P21T-E | Human | Esophagus | ESCC | 1.67e-19 | 2.38e-01 | 0.1617 |
| 11196 | SEC23IP | P22T-E | Human | Esophagus | ESCC | 8.56e-09 | 1.43e-01 | 0.1236 |
| 11196 | SEC23IP | P23T-E | Human | Esophagus | ESCC | 6.84e-12 | 3.37e-01 | 0.108 |
| 11196 | SEC23IP | P24T-E | Human | Esophagus | ESCC | 3.67e-16 | 3.59e-01 | 0.1287 |
| Page: 1 2 3 4 5 |
| Tissue | Expression Dynamics | Abbreviation |
| Esophagus | 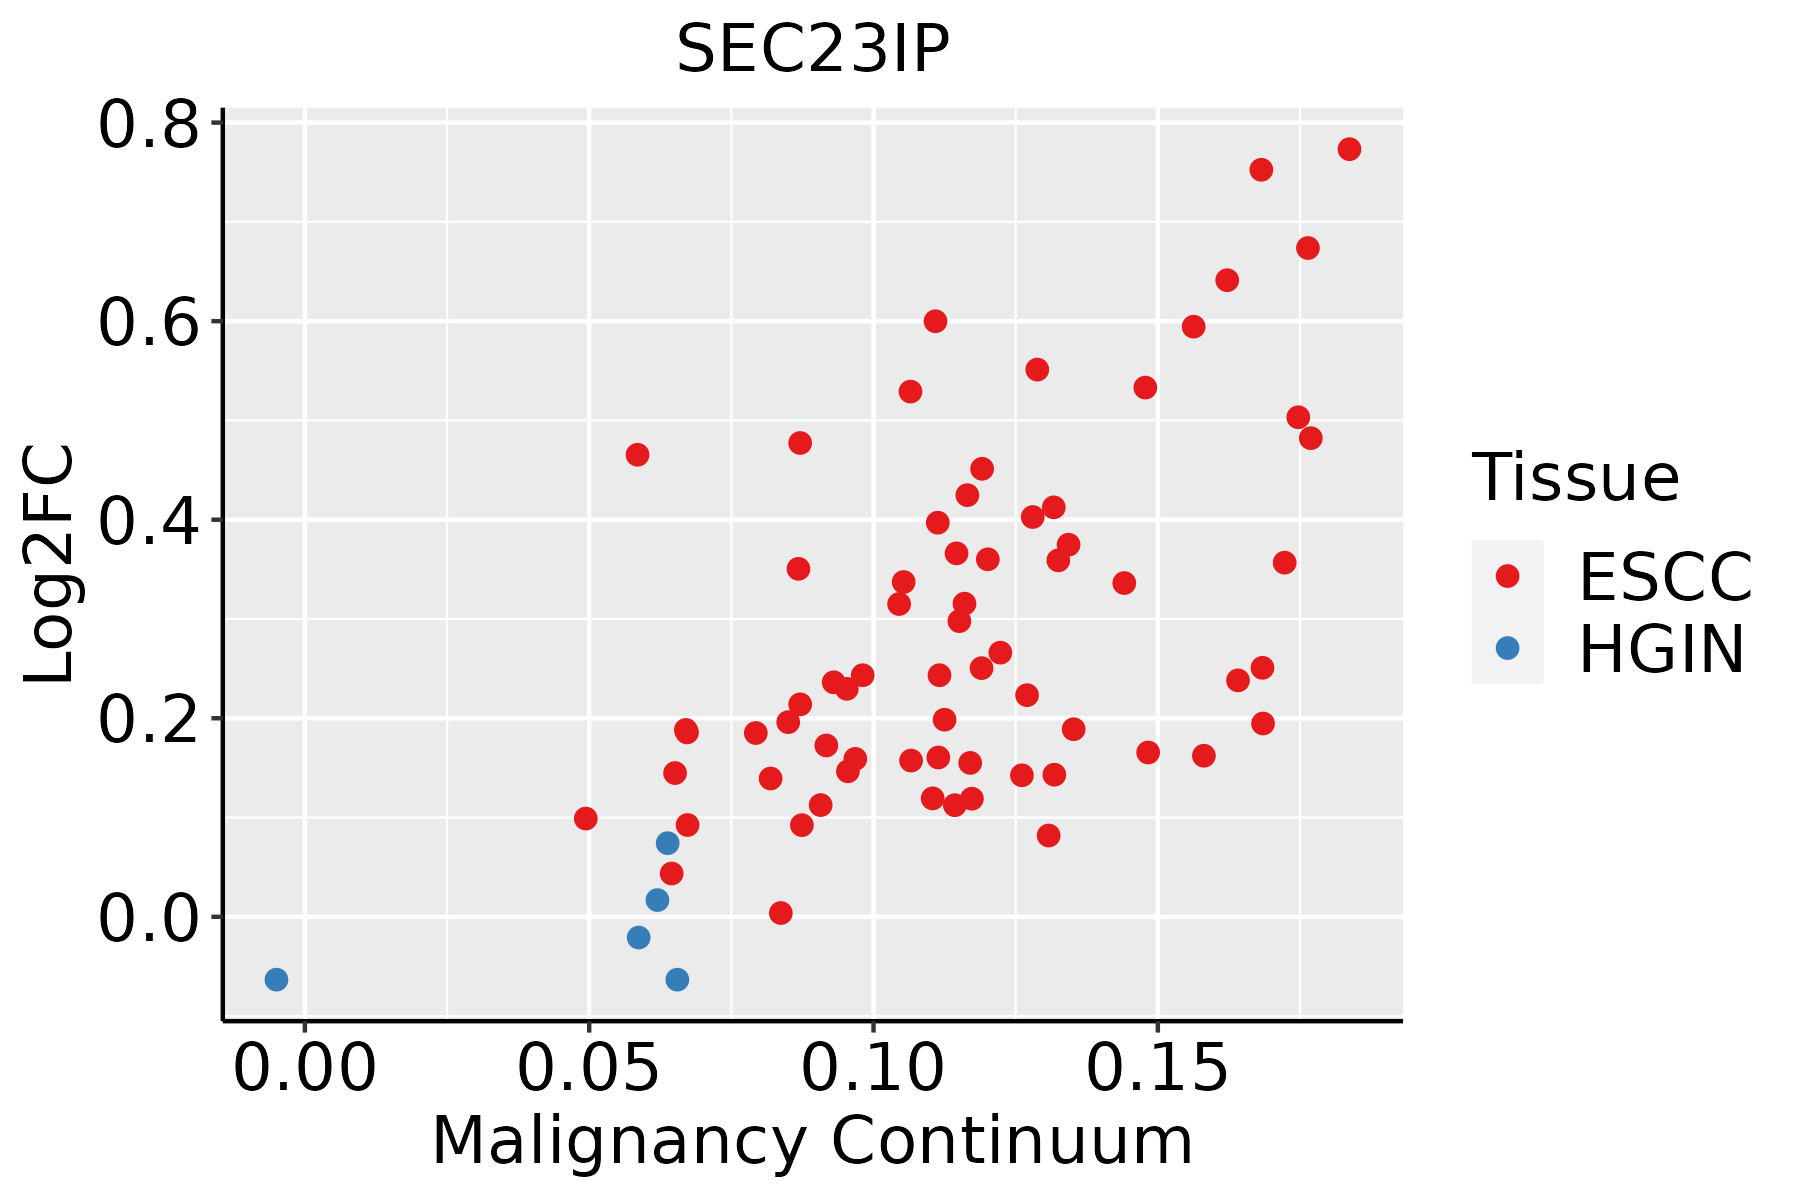 | ESCC: Esophageal squamous cell carcinoma |
| HGIN: High-grade intraepithelial neoplasias | ||
| LGIN: Low-grade intraepithelial neoplasias | ||
| Liver | 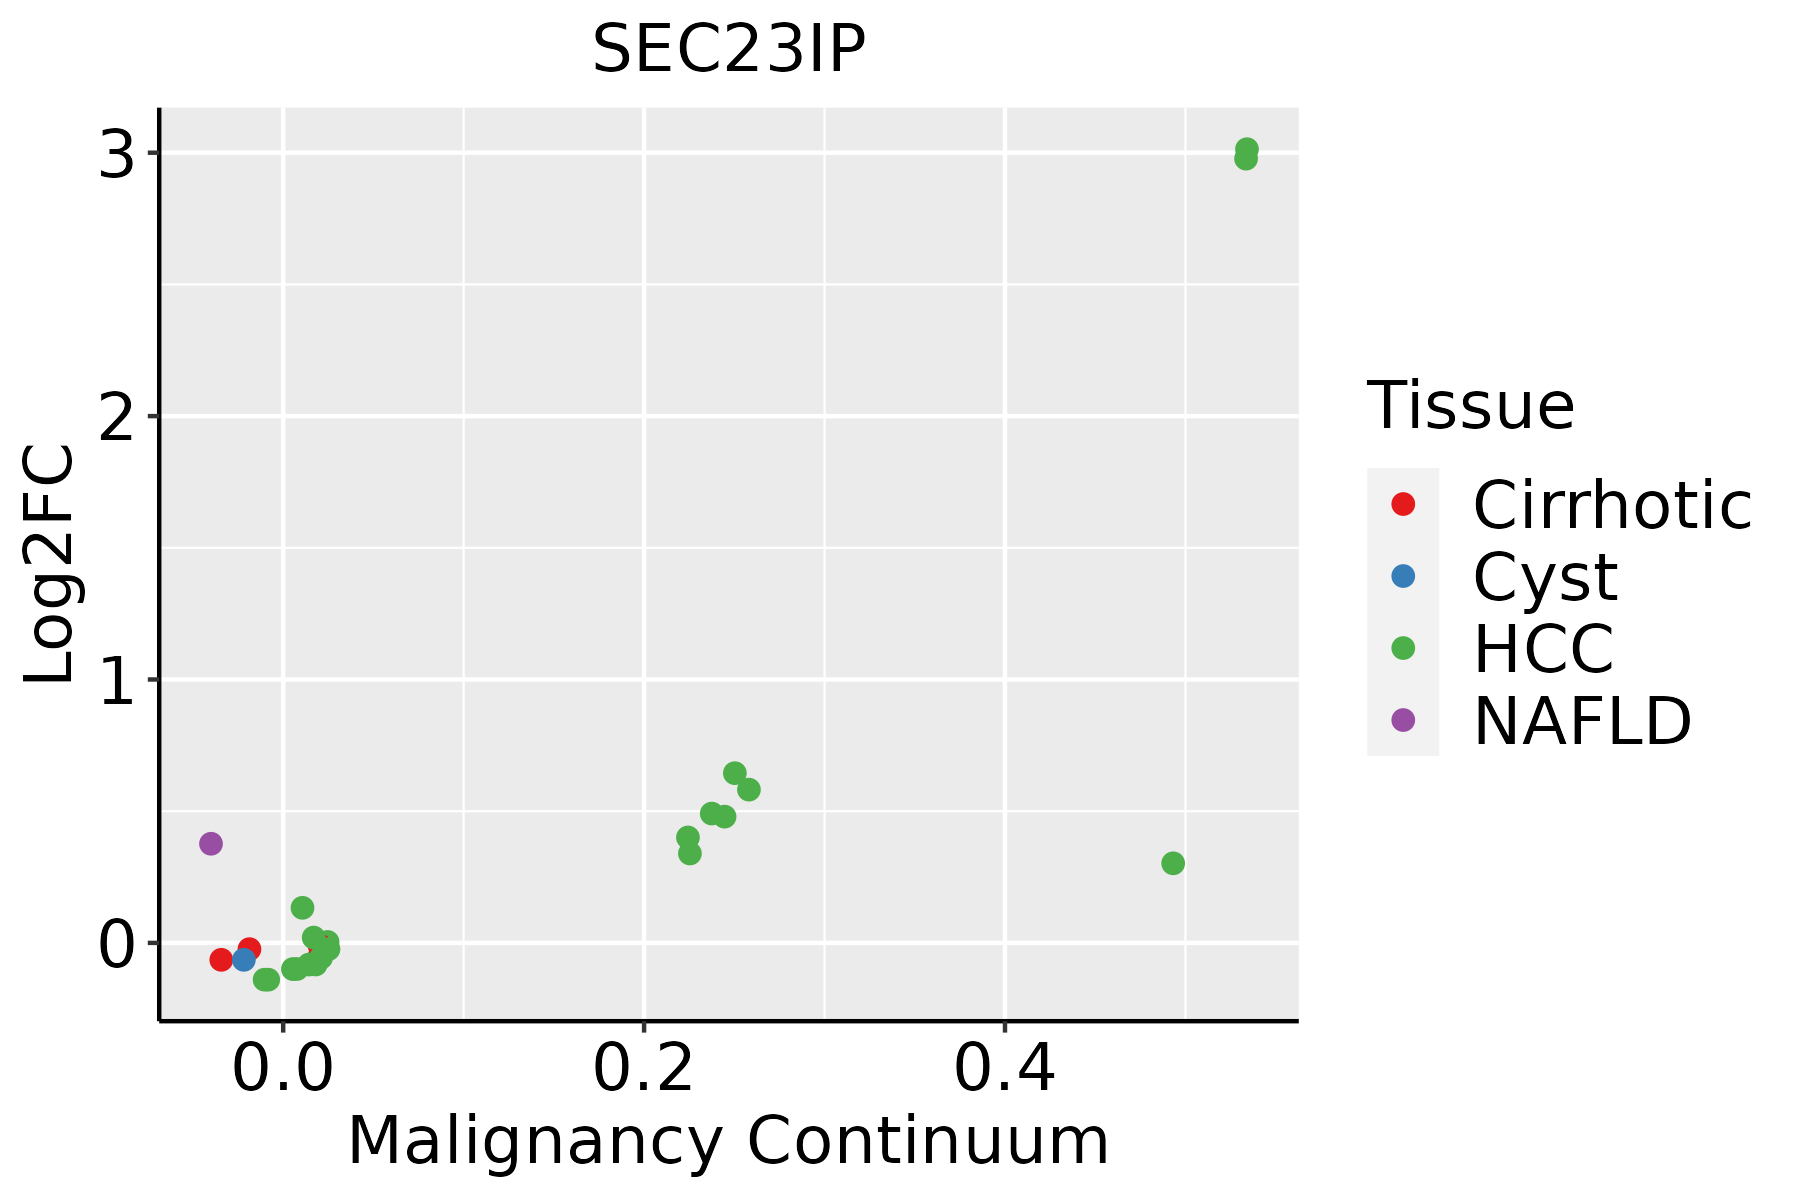 | HCC: Hepatocellular carcinoma |
| NAFLD: Non-alcoholic fatty liver disease | ||
| Oral Cavity | 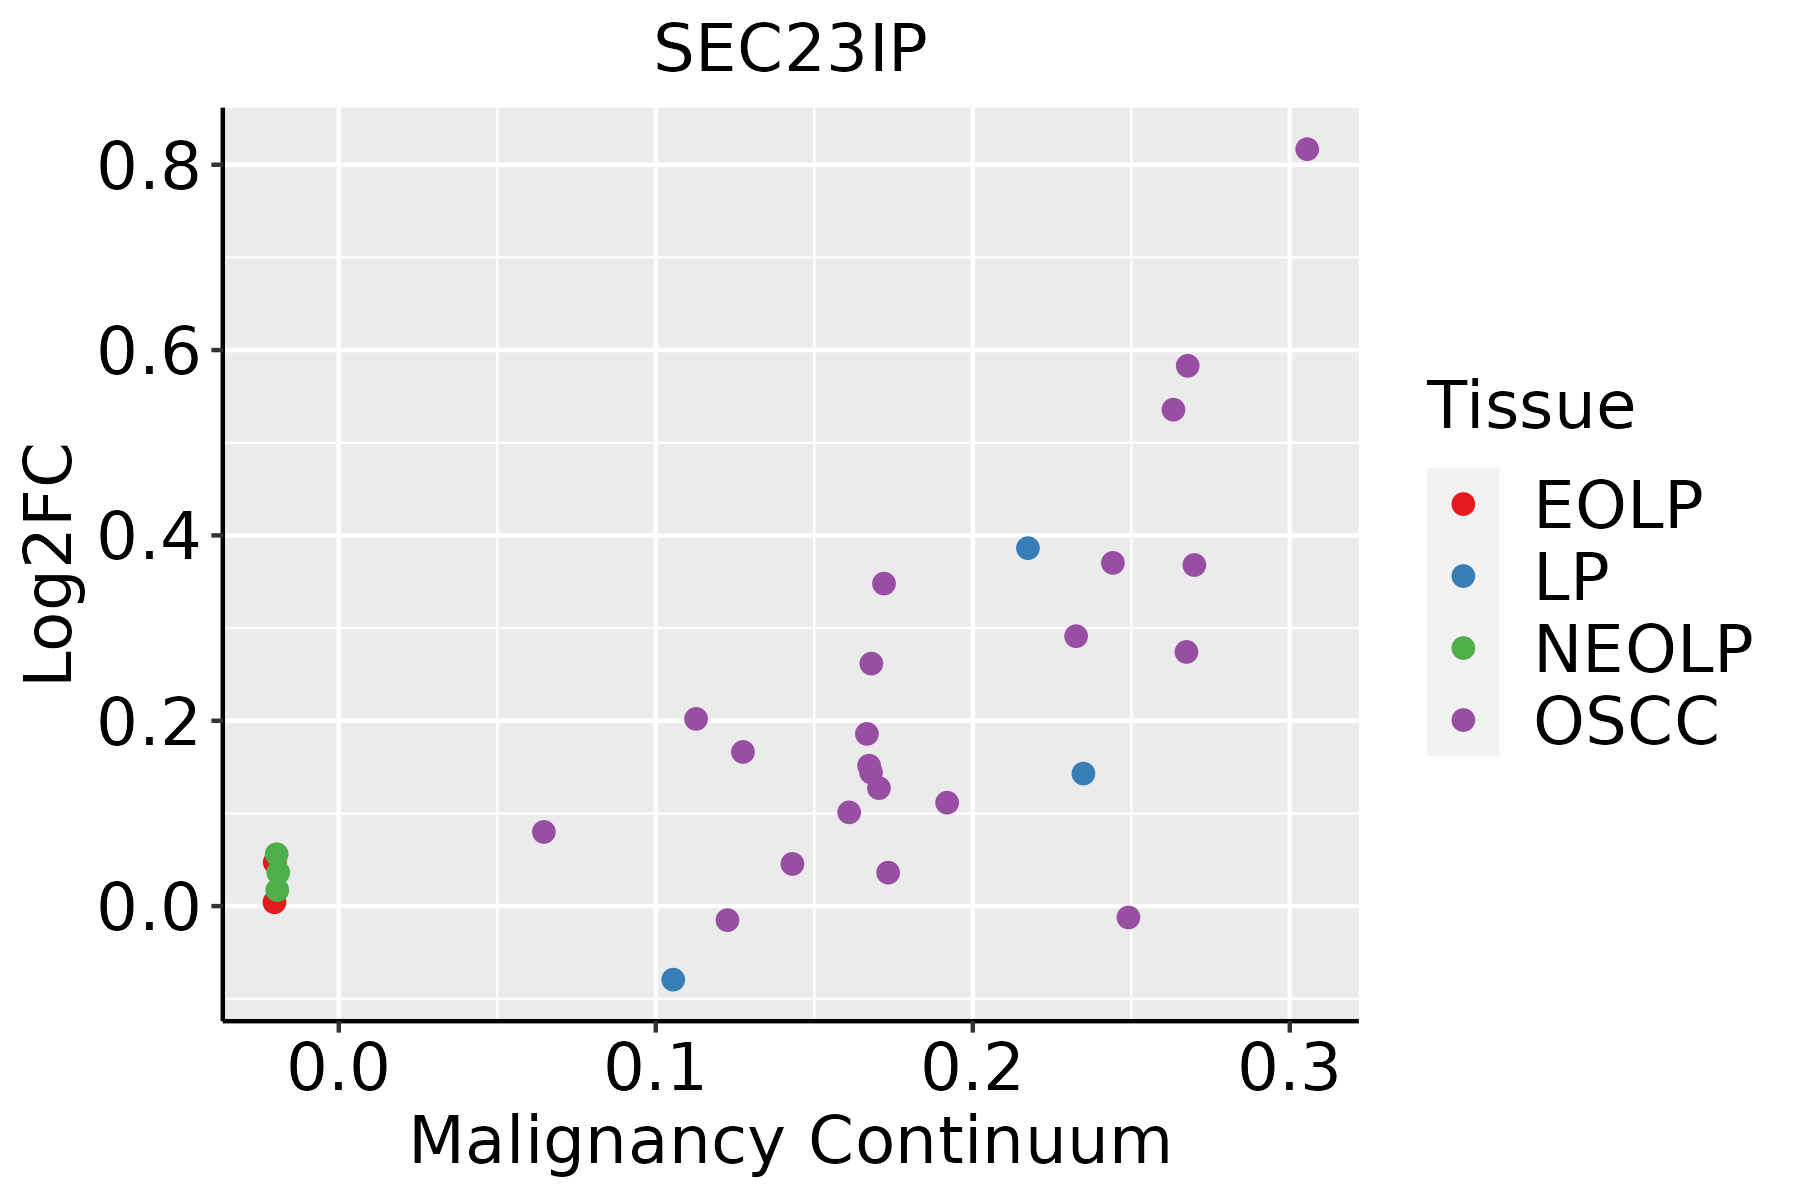 | EOLP: Erosive Oral lichen planus |
| LP: leukoplakia | ||
| NEOLP: Non-erosive oral lichen planus | ||
| OSCC: Oral squamous cell carcinoma | ||
| Thyroid |  | ATC: Anaplastic thyroid cancer |
| HT: Hashimoto's thyroiditis | ||
| PTC: Papillary thyroid cancer |
| ∗log2FC in expression of this searched gene in stem-like cells from each diseased tissue sample relative to stem-like cells in normal samples in each tissue plotted against the malignancy continuum. Samples are colored based on if they are from different disease stage. |
Top |
Malignant transformation related pathway analysis |
| Find out the enriched GO biological processes and KEGG pathways involved in transition from healthy to precancer to cancer |
| Tissue | Disease Stage | Enriched GO biological Processes |
| Colorectum | AD |  |
| Colorectum | SER |  |
| Colorectum | MSS |  |
| Colorectum | MSI-H |  |
| Colorectum | FAP |  |
| ∗Top 15 enriched GO BP terms are showed in the bar plot of each disease state in each tissue. Each row represents a significant GO biological process which is colored according to the -log10(p.adjust). |
| Page: 1 2 3 4 5 6 7 8 9 |
| GO ID | Tissue | Disease Stage | Description | Gene Ratio | Bg Ratio | pvalue | p.adjust | Count |
| GO:004819318 | Esophagus | ESCC | Golgi vesicle transport | 231/8552 | 296/18723 | 1.82e-30 | 9.63e-28 | 231 |
| GO:000688815 | Esophagus | ESCC | endoplasmic reticulum to Golgi vesicle-mediated transport | 102/8552 | 130/18723 | 1.73e-14 | 9.22e-13 | 102 |
| GO:00070308 | Esophagus | ESCC | Golgi organization | 101/8552 | 157/18723 | 1.78e-06 | 2.10e-05 | 101 |
| GO:00481936 | Liver | NAFLD | Golgi vesicle transport | 66/1882 | 296/18723 | 3.66e-10 | 9.30e-08 | 66 |
| GO:0007030 | Liver | NAFLD | Golgi organization | 36/1882 | 157/18723 | 1.76e-06 | 7.68e-05 | 36 |
| GO:00068885 | Liver | NAFLD | endoplasmic reticulum to Golgi vesicle-mediated transport | 26/1882 | 130/18723 | 4.78e-04 | 6.78e-03 | 26 |
| GO:004819311 | Liver | Cirrhotic | Golgi vesicle transport | 153/4634 | 296/18723 | 1.02e-23 | 6.43e-21 | 153 |
| GO:000688811 | Liver | Cirrhotic | endoplasmic reticulum to Golgi vesicle-mediated transport | 77/4634 | 130/18723 | 5.78e-17 | 7.56e-15 | 77 |
| GO:00070301 | Liver | Cirrhotic | Golgi organization | 68/4634 | 157/18723 | 2.57e-07 | 6.41e-06 | 68 |
| GO:004819321 | Liver | HCC | Golgi vesicle transport | 217/7958 | 296/18723 | 2.58e-27 | 1.02e-24 | 217 |
| GO:000688821 | Liver | HCC | endoplasmic reticulum to Golgi vesicle-mediated transport | 100/7958 | 130/18723 | 1.15e-15 | 8.67e-14 | 100 |
| GO:00070302 | Liver | HCC | Golgi organization | 99/7958 | 157/18723 | 1.54e-07 | 2.85e-06 | 99 |
| GO:004819315 | Oral cavity | OSCC | Golgi vesicle transport | 209/7305 | 296/18723 | 1.39e-28 | 6.30e-26 | 209 |
| GO:00068888 | Oral cavity | OSCC | endoplasmic reticulum to Golgi vesicle-mediated transport | 97/7305 | 130/18723 | 1.42e-16 | 1.15e-14 | 97 |
| GO:00070307 | Oral cavity | OSCC | Golgi organization | 92/7305 | 157/18723 | 4.96e-07 | 7.27e-06 | 92 |
| GO:004819320 | Thyroid | PTC | Golgi vesicle transport | 186/5968 | 296/18723 | 3.09e-28 | 1.22e-25 | 186 |
| GO:000688817 | Thyroid | PTC | endoplasmic reticulum to Golgi vesicle-mediated transport | 83/5968 | 130/18723 | 6.19e-14 | 3.52e-12 | 83 |
| GO:000703010 | Thyroid | PTC | Golgi organization | 79/5968 | 157/18723 | 1.11e-06 | 1.64e-05 | 79 |
| GO:0048193111 | Thyroid | ATC | Golgi vesicle transport | 189/6293 | 296/18723 | 9.58e-27 | 5.05e-24 | 189 |
| GO:000688823 | Thyroid | ATC | endoplasmic reticulum to Golgi vesicle-mediated transport | 84/6293 | 130/18723 | 4.40e-13 | 1.97e-11 | 84 |
| Page: 1 2 |
| Pathway ID | Tissue | Disease Stage | Description | Gene Ratio | Bg Ratio | pvalue | p.adjust | qvalue | Count |
| Page: 1 |
Top |
Cell-cell communication analysis |
| Identification of potential cell-cell interactions between two cell types and their ligand-receptor pairs for different disease states |
| Ligand | Receptor | LRpair | Pathway | Tissue | Disease Stage |
| Page: 1 |
Top |
Single-cell gene regulatory network inference analysis |
| Find out the significant the regulons (TFs) and the target genes of each regulon across cell types for different disease states |
| TF | Cell Type | Tissue | Disease Stage | Target Gene | RSS | Regulon Activity |
| ∗The dot plots of a searched regulon are shown for all cell subpopulations in each disease state of each tissue based on the regulon specific score inferred using pySCENIC and by calculating the average expression. |
| Page: 1 |
Top |
Somatic mutation of malignant transformation related genes |
| Annotation of somatic variants for genes involved in malignant transformation |
| Hugo Symbol | Variant Class | Variant Classification | dbSNP RS | HGVSc | HGVSp | HGVSp Short | SWISSPROT | BIOTYPE | SIFT | PolyPhen | Tumor Sample Barcode | Tissue | Histology | Sex | Age | Stage | Therapy Types | Drugs | Outcome |
| SEC23IP | SNV | Missense_Mutation | c.1623N>G | p.Phe541Leu | p.F541L | Q9Y6Y8 | protein_coding | deleterious(0) | probably_damaging(0.995) | TCGA-C8-A1HL-01 | Breast | breast invasive carcinoma | Female | <65 | III/IV | Unknown | Unknown | SD | |
| SEC23IP | SNV | Missense_Mutation | rs778749246 | c.1586G>A | p.Arg529His | p.R529H | Q9Y6Y8 | protein_coding | deleterious(0) | probably_damaging(0.999) | TCGA-D8-A1JM-01 | Breast | breast invasive carcinoma | Female | <65 | I/II | ChemotherapyHormone Therapy | doxorubicine | SD |
| SEC23IP | SNV | Missense_Mutation | c.1388N>A | p.Ser463Asn | p.S463N | Q9Y6Y8 | protein_coding | tolerated(0.05) | benign(0.348) | TCGA-D8-A1X6-01 | Breast | breast invasive carcinoma | Female | >=65 | III/IV | Hormone Therapy | tamoxiphen | SD | |
| SEC23IP | SNV | Missense_Mutation | c.924G>C | p.Glu308Asp | p.E308D | Q9Y6Y8 | protein_coding | tolerated(0.06) | benign(0.023) | TCGA-D8-A1XM-01 | Breast | breast invasive carcinoma | Female | <65 | I/II | Unknown | Unknown | SD | |
| SEC23IP | SNV | Missense_Mutation | c.205C>G | p.Gln69Glu | p.Q69E | Q9Y6Y8 | protein_coding | deleterious(0) | probably_damaging(0.965) | TCGA-OL-A66K-01 | Breast | breast invasive carcinoma | Female | >=65 | I/II | Unknown | Unknown | SD | |
| SEC23IP | SNV | Missense_Mutation | novel | c.2687N>T | p.Thr896Ile | p.T896I | Q9Y6Y8 | protein_coding | tolerated(0.22) | benign(0.014) | TCGA-4J-AA1J-01 | Cervix | cervical & endocervical cancer | Female | <65 | I/II | Unknown | Unknown | SD |
| SEC23IP | SNV | Missense_Mutation | novel | c.640N>G | p.Pro214Ala | p.P214A | Q9Y6Y8 | protein_coding | deleterious(0.05) | benign(0) | TCGA-C5-A1MH-01 | Cervix | cervical & endocervical cancer | Female | >=65 | III/IV | Chemotherapy | cisplatin | PD |
| SEC23IP | SNV | Missense_Mutation | novel | c.2041G>C | p.Asp681His | p.D681H | Q9Y6Y8 | protein_coding | deleterious(0.04) | benign(0.44) | TCGA-JW-A5VL-01 | Cervix | cervical & endocervical cancer | Female | <65 | I/II | Unknown | Unknown | SD |
| SEC23IP | SNV | Missense_Mutation | rs774300336 | c.80N>T | p.Ser27Leu | p.S27L | Q9Y6Y8 | protein_coding | deleterious_low_confidence(0) | benign(0.338) | TCGA-LP-A5U2-01 | Cervix | cervical & endocervical cancer | Female | <65 | III/IV | Unknown | Unknown | SD |
| SEC23IP | SNV | Missense_Mutation | novel | c.2219N>T | p.Ser740Leu | p.S740L | Q9Y6Y8 | protein_coding | tolerated(0.06) | benign(0.003) | TCGA-MY-A5BF-01 | Cervix | cervical & endocervical cancer | Female | >=65 | I/II | Chemotherapy | cisplatin | CR |
| Page: 1 2 3 4 5 6 7 8 9 |
Top |
Related drugs of malignant transformation related genes |
| Identification of chemicals and drugs interact with genes involved in malignant transfromation |
| (DGIdb 4.0) |
| Entrez ID | Symbol | Category | Interaction Types | Drug Claim Name | Drug Name | PMIDs |
| Page: 1 |

Copyright 2023-Present -The University of Texas Health Science Center at Houston |